




 English (pdf)
 Article in xml format
 Article references
 Automatic translation
 Send this article by e-mail
 Cited by SciELO
  Similars in
SciELO
Similars in
SciELO  uBio
uBio 
 Permalink
Genus Triplophysa (Rendahl, 1933) belongs to the family Balitoridea, subfamily Nemacheilinae having 124 nominal species in this genus all over the world (Li, Chen, & Hu, 2015). The distribution of this genus ranges from drainages of China and upper Indus to Tigris River basin of West Asia, and in different river drainages of Central Asia (Zhou & Cui, 1997). In India the distribution of this genus has been reported only in the upper drainage of the Indus River in Jammu and Kashmir, and Lahul and Spiti area of Himachal Pradesh (Kullander, Fang, Delling, & Ahlander, 1999). Triplophysa is a species-rich genus currently having about, 116 recognized species, 99 of which have so far been documented from China (Li, et al., 2008). In Indian 10 Triplophysa has been reported by Menon (1987). The species of Triplophysa have a distinct sexual dimorphism: male on both sides of the head posses tubercle-bearing elevated skin, and a thick tuberculate pad on the dorsal surfaces of the broadened and widened pectoral-fin rays (Zhu, 1989).
In Kashmir valley, Heckel (1838) described two scaleless fish species which he called Cobitis marmorata and C. vittata, but Kullander et al. (1999) referred them as T. marmorata and T. kashmirensis respectively and placed them in family Balitoridae. They have a relatively slender caudal peduncle that is sometimes described as ‘whiplike’ in some species. Triplophysa, species range mostly between about 60 to 190 mm SL in length. Nevertheless, the taxonomic status of various Triplophysa species described from the upper Indus drainage, especially those recorded from the Kashmir valley and Ladakh is not well understood (Kullander et al., 1999). Triplophysa marmorata specimens are identified by having shorter lateral line length and shorter caudal peduncle than T. kashmirensis, but in other morphometric characters, Triplophysa marmorata is similar to T. kashmirensis and are identified as such. However, Kullander et al. (1999) suggested that the morphometry variation may be influenced by habitat and suggested further study to clear the taxonomic status of these two species. Moreover due to various anthropogenic activities, such as overfishing, water contamination, dam construction, and habitat alteration, wild fisheries of these species have declined its population dramatically, and the distribution range has been shrinking rapidly from the last decades (Gao, Tang, Qiao, Yang, & Chen, 2011). For monitoring speciesspecific conservation program, proper identification of the taxonomic unit to be conserved is fundamental. Inaccurate taxonomy leads to the lack of identification and threats to the survival of important components of biodiversity. On the other hand, conservation resources can be a waste by focusing on supposedly rare species that are merely nongenetic phenotypic variants of a common species (Avise, 1994).
Molecular characterization is an initiative for taxon recognition, molecular signature and classification of animals based on DNA sequences. Molecular markers are powerful tools for solving questions concerning ecology, evolution, and conservation of several fish taxa (Wilson, Woods, Maina, & White, 2000; Thangaraj & Lipton, 2010). Presently, the mitochondrial markers are popular DNA markers used for species discrimination (Teletchea, 2009). These markers have been already proven as an important tool to address the molecular systematics status of various species (Lara et al., 2010). The idea of using the standardized cytochrome c oxidase subunit I gene (COI) as a method to identify species was proposed by Hebert, Cywinska, Ball and deWaard (2003) and from that time, over 1.9 million specimens, approximately belonging to 172 000 species, including 9 502 fishes has been characterized (Ratnasingham & Hebert, 2007). The methodology to identify species is based on differences in the sequences of a short standardized DNA fragment from the mitochondrial COI gene (~650 bp) (Hebert et al., 2003).
The present investigation aimed to study the taxonomical and molecular characterization of two Triplophysa species from the Western Himalayan region of India, based on the results of morphology and mitochondrial gene, cytochrome oxidase 1 (CO 1) sequence analysis. The study also attempted to clarify the systematic status of these species using the corresponding CO 1 sequences of some other fish species of family Balitoridae and Nemacheilidae retrieved from GenBank. The results of this study could form taxonomic base for the revision of identity for these species in India subcontinent. The baseline data generated in this investigation will be useful to fisheries managers to make efforts for the conservation of this species group.
Material and methods
Sample collection: A total of nine specimens for molecular analysis per species and a total 92 specimens (46 samples per species) for morphometric analysis were collected from river Jhelum at Brazloo Kulgam (75°2’41.79” E - 33°38’42.588” N) and Dal Lake (74°51’24.118” E - 34°5’19.722” N) in Kashmir, India (Table 1). The fish samples were collected seasonally during winter (DecemberMarch), pre-monsoon or summer (April-June), monsoon or rainy (July-September) and postmonsoon or autumn (October-November) from March 2014 to April 2015 by using cast nets with the help of local fishermen. Identification of fishes was done following the taxonomic keys of Talwar and Jhingran (1999) and Kullander et al. (1999). Fin tissue samples were collected from the caudal fin and preserved in 95 % ethanol. voucher specimens were preserved in 10 % formaldehyde solution and were deposited in museum of Directorate of Coldwater Fisheries Research, Uttarakhand, India.
TABLE 1 Species information, Voucher ID, NCBI GenBank accession number and collection sites of species studied from the Kashmir valley

Morphometric analysis: The following morphometric characters were analyzed for both fish species: Standard Length: SL, Body Depth/Maximum Body Depth: MBD, Snout Length: SnL, Head length: HL, Depth Dorsal/Dorsal fin height: DFH, Base dorsal/dorsal fin Length: DFL, Base Anal Length/Anal fin length: AFL, Length Pectoral/pectoral fin height: PFH, Length Pelvic/ventral fin height: vFH, Straight Lateral line Length: SLLL, Snout to dorsal length/Pre dorsal Length: PrDFL, Snout to pelvic length/pre ventral Length: PrvFL, Snout to pectoral length/Pre Pectoral Length: PrPFL, Snout to Anal length/Pre Anal Fin length: PrAFL, Depth Caudal/Minimum Body Depth: MinBD, Length Caudal/Caudal Fin Length: CFL, Upper Jaw Length: UJL, Sub-Orbital Width: SoW, Eye Diameter: ED, distance from anal fin to caudal fin base: DACB, Distance b/w pectoral and anal fin: DPA, and Distance b/w ventral and Pectoral: DvP. All the measurements were taken using electronic digital calipers (Mitiyo make) to the nearest 0.01 mm (Mir, Patiyal, & Sahoo, 2015).
All the morphometric characteristics were log-transformed and standardized for numerical analysis. The raw morphometric data were firstly transformed to common logarithms in order to increase linearity and multivariate normality and then size-dependent variation was removed using an allometric approach (Elliott, Haskard, & Koslow, 1995).
Mtrans = M (Ls / Lo) b
Whereas Mtrans is the transformed measurement, M is the original measurement, b is the within group slope regression of the M versus SL, Ls is the standard length of the fish, and Lo mean the overall mean of the standard length.
The descriptive statistics for each morphometric characters were obtained. A one-way analysis of variance (ANOvA) was carried out on each transformed morphometric variable. Significant variables were retained and then subjected to Principal component analysis (PCA). All statistical analyses were done using the statistical analysis system (SPSS.20ver.).
Isolation of Genomic DNA, PCR Amplification and Sequencing: A total of nine specimens of both the species were collected from river Jhelum and Dal Lake in Kashmir, India. Total genomic DNA was isolated from the fin tissue following Phenol: Chloroform: Isoamyl alcohol method of Sambrook, Fritsch and Maniatis (2001). Both quality and quantity of the genomic DNA was assessed using 0.8 % agarose gel electrophoresis (Takara Bio, Japan) and Nanodrop (Thermo Fisher, USA), respectively. The genomic DNA was stored at -20 oC for future use. The cytochrome c oxidase subunit I (COI) gene was amplified with primers FishF1-5’-TCAACCAACCACAAAGACATTGGCAC-3’ and FishR-1 5’-TAGACTTCTGGG TGGCCAAAGAAT-CA-3’ (Ward, Zemlak, Innes, Last, & Hebert, 2005) in a 50-μL volume with 100 ng template DNA, 10 pmole of each specific primer, 250 µM of each dNTPs, 1.0 U of Taq DNA polymerase and 1x Taq buffer containing 1.5 mM MgCl2. The PCR conditions consisted of initial denaturation at 94 oC for 3 min, 35 cycles of denaturation at 94 oC (40 s), annealing at 58 oC (40 s), extension 72 oC (60 s) and a single final extension at 72 oC for 10 min and product storage at 4 oC. The PCR products were visualized on 1.2 % agarose gel and the amplicons were purified and sequenced in both directions in automated genetic analyzer (ABI 3730, Applied Biosystem, USA) following Bigdye® terminator v.1.1 Cycle Sequencing Kit (Applied Biosystem, USA).
Sequence analysis: The raw sequences were initially trimmed to remove low quality region or primer sequences, forward and reverse sequences were aligned using the CLC Genomic Workbench v.7.5.1 (Quaigen, Germany). Finally, 681bp nucleotide alignment was obtained and used for further studies. The 681bp assembled sequences were Blast searched (NCBI database) using BLASTN toolkit for confirmation. Kimura two-parameter (K2P) distance model (Kimura, 1980) was used to calculate nucleotide divergences. The mean, minimum and the maximum nucleotide divergence within and between species were computed. The Sequences divergence was estimated by using MEGA6 (Tamura, Stecher, Peterson, Filipski, & Kumar, 2013). To conduct the phylogenetic analysis, we downloaded COI sequences of 23 species (genera: Schistura, Nemacheilus, Paracobitis, Lepturichthys, Lefua, and Triplophysa) from GenBank database. As outgroups, from NCBI database, also we downloaded sequences of Homatula and Barbatula for family-level comparative study and Acanthocobitis and Leptobotia for subfamily-level comparative study (Table 1). The Model test v3.6 program (Posada & Crandall, 1998) was run in order to calculate the best substitution model for analysis. The model with the highest Akaike information criterion value, i.e. K2p model, was selected for further analysis using the nearest neighbor interchange algorithm. Graphical representation of the divergence pattern between the two species was created by using Neighbour-joining (NJ) and Unweighted Pair Group Method with Arithmetic Mean (UPGMA) tree methods of K2P distances (Saitou & Nei, 1987). In the two chosen subgroups of fish, for both graphical representations bootstrapping was performed in MEGA6 (Tamura et al., 2013) with 1 000 replications.
Results
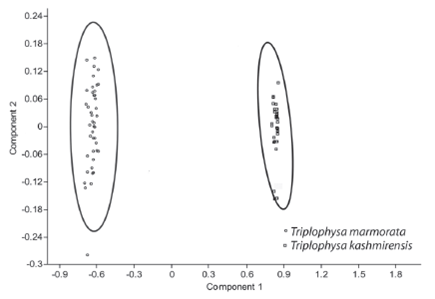
Morphometric analysis: By applying ANOvA on 22 morphometric characters only 15 showed significant difference in their mean values (P < 0.05). The significant variables included BD, HL, DFH, DFL, PFH, SLL, PrDFL, PrvFL, PrAFL, MinBD, CFL, SoW, DACB, DPA and DvP. Principal component analysis of the 15 significant variables produced five principal components (PCs). The first and second PC contributed 93.341 % and 1.7136 % respectively, while the third PC contributed 1.1424 % to the total variance. A PCA plot of PC1 vs. PC2 was generated which grouped the species into two separate clusters (Fig. 1).
Molecular analysis: A total of nine COI sequences were sequenced from both fish species. After exclusion of the primer sequence and low-quality base trimming, sequence alignment yielded 681bp per taxon. The NCBI BLASTx of 681 bp COI of both species in the present study revealed that no sequences of the species were present but showed similarity match with Triplophysa stoliczkae. Both T. marmorata and T. kashmirensis showed 92 % similarity (E value 0.0) with Triplophysa stoliczkae. Well defined peaks indicated that no co-amplification of nuclear pseudogenes has occurred. In T. marmorata the COI sequence analysis across species revealed average nucleotide frequencies as 24.6 % (A), 30.1 % (T), 26.9 % (C) and 18.4 % (G) whereas, in T. kashmirensis the average nucleotide frequencies was 24.1 % (A), 30.4 % (T), 26.9% (C) and 18.5 % (G). All the sequences have been deposited in GenBank (Accession numbers: Table 1). The interspecific sequence divergence between the two species was high as compared to intraspecific sequence divergence. There was no nucleotide divergence (K2P) between individual species of T. marmorata, whereas, in T. kashmirensis it was 0.001. Furthermore, the mean nucleotide divergence between these two species was 0.007 (Table 2). Out of 681bp, 676 were constant sites, whereas, five sites were variable/singleton between the two species. The variable sites were at nucleotide position number 127, 166, 444, 486 and 639.

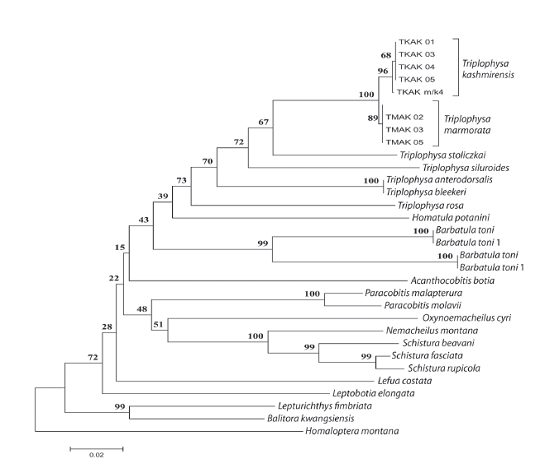
In this study, the overall estimated Transition/Transversion bias (R) was 0.67. It indicated that the COI sequences are not saturated and can discriminate species. The maximum log likelihood for this study was -981.57. The NJ and UPGMA using K2P genetic divergence were created to provide a graphic representation of the patterns of divergences (Fig. 2 and Fig. 3). Despite having low nucleotide divergences (COI) between the species, both the species were separately resolved as monophyletic groups in both tree-building methods (NJ and UPGMA).
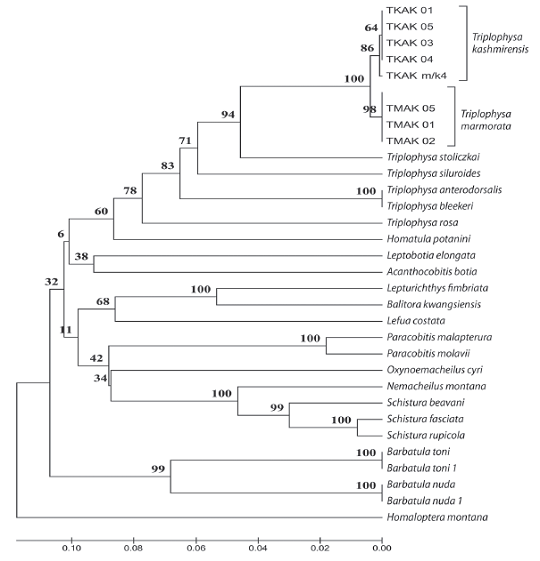
Fig. 2 UPGMA tree of Kimura two-parameter (K2P) distances. Numbers above branches refer to bootstrap proportions among 1 000 bootstrap replicates.
Discussion
In the present study, the numbers of morphometric measurements used are considered to be of adequate number for identification and differentiation of these two fish species. Compared with the earlier reports of Kullander et al. (1999) and Talwar and Jhingran (1991) who reported only significant variation in MBD, SLL and MinBD between the species, this study reported significant variation in 15 morphometric characters that can be used in their identification and differentiation. For most of the morphometric characters the variation within species was less evident, and this suggests that each species consists of a phenotypically and genetically homogeneous group.
Our study provides the first molecular characterization of these species from Kashmir valley. The overall base composition of both T. marmorata and T. kashmirensis was in accordance with the study of the complete mt genome of T. bleekeri by Jiuxuan, Kun, Shengjuan, xiuyue, & Zhaobin (2015) having high A+T bases. The average K2P divergence within conspecific specimens was found only 0.001 and among congeneric species 0.007. The result of our study was in contrast with the results of previous studies. Hubert et al. (2008) found average K2P values of 0.27 % (conspecific) and 8.37 % (congeneric), discriminating 93 % of the species while studying freshwater fishes from Canada. In another study, 93 % of freshwater fishes were discriminated from Mexico and Guatemala showing average K2P values of 0.45 % in conspecific and 5.1 % in congeneric (valdez-Moreno, Ivanova, ElíasGuitiérrez, Contreras-Balderas, & Hebert, 2009). Ward, Hanner and Hebert (2009) tried to analyze the values of K2P genetic divergence among 1 088 fish species and found average K2P values of 0.3 % in conspecific and 8.4 % in congeneric, discriminating about 97.5 % of the species. Recently, Lara et al. (2010) discriminated 96 % of the freshwater fish species from Cuba and found average K2P values of 0.6 % in conspecific and 9.1 % in congeneric, discriminating 96 % of the species. The relatively low value in this study may be due to limited sampling, though we have taken more than one specimen of each species and had tried to sample the maximum variation within both species.
Moreover, the sequence divergence between the two species is very low that it does not follow the > 2 % approach (Ward et al., 2009). As low K2P divergences were reflected between the two species, these low values may be an indication of recent radiation of these species. Perdices, Doadrio and Bermingham (2005) and Ornelas-Garcia, Dominguez-Dominguez and Doadrio (2008) proposed recent radiation for Mesoamerica fish species. Similarly Hubert et al. (2007) pointed to a recent radiation of some groups of freshwater fishes from South America and suggested that these patterns could be found for most Neotropical freshwater fishes. The phlyogenetic analysis showed that both species T. marmorata and T. kashmirensis form separate clades, though it becomes evident that these are too close to each other. Furthermore, both phlyogenetic tree shows that they are more close to Triplophysa stoliczkae thus representing true species of Triplophysa genus. Kullander et al. (1999) places these species into Balitoridae family, but the phlyogenetic relationship showed that these two species were more close to Nemacheilidae family than to Balitoridae.
This study has validated the fact that these are two different species radiated recently from each other. Based on our observation, the inferred phylogenetic closeness indicates that the assignment of these species among the family Balitoridae is improper, and they are closer to family Nemacheilidae. The identification keys developed in the present investigation will be useful in better management and conservation of these species across their natural range of distribution.

