


 English (pdf)
 Article in xml format
 Article references
 Send this article by e-mail
 Cited by SciELO
  Similars in
SciELO
Similars in
SciELO 
 Permalink
Introduction
Physical activity (PA), sedentary behavior (SB) and sleep have a strong impact on adolescents' health (Poitras et al., 2016; Shochat et al., 2014; Tremblay et al., 2011). Among others, physical inactivity is associated with hypertension, metabolic syndrome, obesity, less mineral bone density and mental health issues (Strong et al., 2005). Sedentary behavior, which includes activities that involve a very low energy expenditure (≤ 1.5 METs), constitutes an independent factor for increased risk of cardiovascular disease and allcause mortality, obesity and cognitive development issues (Wu et al., 2017). On the other hand, inadequate sleep is associated with serious health issues such as higher body fat, increased insulin resistance and anxiety (Moore & Meltzer, 2008).
According to World Health Organization (WHO) guidelines for PA, adolescents should accumulate at least 60 minutes of moderate-to-vigorous PA (MVPA) per day, plus participating in vigorous PA (VPA) and strength training 3 days/week (World Health Organization (WHO), 2020). Current WHO recommendations for SB include limiting its duration, especially the recreational screen time. Regarding sleep, adolescents should accumulate between 8 and 10 hours per night to avoid possible health risks (National Sleep Foundation, 2021). Furthermore, they should maintain an adequate sleep quality during sleep time.
Unfortunately, a wide range of evidence shows that a large number of adolescents fail to comply these three behaviors: although there are differences between countries, worldwide, 81% do not meet PA minimum requirements (Guthold et al., 2020). Previous research shows that adolescents spend more than 8 hours per day in sedentary activities (Contardo-Ayala et al., 2019). Regarding sleep, recent data from Health Behavior in School-Aged Children (HBSC) study shows that more than 50% of adolescents have inadequate sleep duration (Gariepy et al., 2020). Moreover, behaviors formed during this vital stage are known to continue into adulthood, worsening the situation (Dregan & Armstrong, 2010).
Adolescents undergoes substantial physical, (e. g., reproductive maturation), psychological (e. g., personality development), cognitive (e. g., improved executive functions) and environmental changes (e. g., increased academic demands, access to electronic devices) (Symonds & Galton, 2014). A combination of these elements could explain the low compliance with health behavior recommendations in adolescents. For instance, sleep seems to be influenced by both intrinsic (e. g., circadian rhythm delay) and extrinsic factors (e. g., early school time, blue light from electronic devices) (Moore & Meltzer, 2008). Similarly, PA and SB levels are driven by personal (e. g., biological maturity) and environmental components (e. g., declines in active commuting) (Francis et al., 2013).
PA and SB objective cohort evidence have increased in the last decade. Different systematic reviews show that during adolescence PA decreases and SB increases (Farooq et al., 2020; Tanaka et al., 2014). Interestingly, both systematic reviews indicate that this situation seems to begin already in childhood but continues in adolescence. On this regard, authors encourage to conduct more cohort accelerometer-based research to obtain more accurate conclusions. Moreover, there are some contradictory results between studies. For instance, Mitchell et al. (2012) found that MVPA remained relatively constant during adolescence, but Francis et al., (2013) observed a significant reduction in MVPA.
Although previous research have tried to evaluate the sleep evolution in adolescence, a large number of them used questionnaires, which leads to potential bias (e. g., social desirability) (Stefansdottir et al., 2020). On the contrary, studies with repeated sleep measures with accelerometers are still scarce (Collings et al., 2015). Regardless the instrument to measure sleep, it seems there is a decrease in average total sleep time (TST) across adolescence (Beltran-Valls et al., 2021; Maslowsky & Ozer, 2014).
On the other hand, longitudinally evaluating these three movement behaviors (PA, SB, sleep) is relevant in order to adapt intervention programs to the adolescent's daily live contexts. Moreover, several previous studies focused only on MVPA, however other PA intensities such as VPA or light PA (LPA) should be taken into account due to their relevance for health (Poitras et al., 2016). In addition, sleep has been measured with accelerometry, which as has been point out, is still scarce. Finally, to the best of our knowledge, this is the first study in a Spanish context that have evaluated longitudinally with accelerometers PA, SB and sleep together. Considering the above, the aim of the present study was to assess the PA, SB and sleep evolution from early to mid-adolescence with 24-hours accelerometry.
Methods
Study design
A longitudinal study was conducted to analyze the PA, SB and nocturnal sleep habits in a cohort of adolescents for one full week over three years. Repeated measures were taken consecutively at three time points, one per year, between January and March. The study was approved by the Regional Ethic Committee (135/18) and followed the Declaration of Helsinki principles (World Medical Association, 2013). Potential participants were informed regarding the study details and written informed consent was provided by the participants and their parents/guardians.
Participants
Taking into account the required level of personal and family involvement in a study of this kind and with the aim of increasing participants' commitment, the sample technique was non-probabilistic and convenience (Peat et al., 2020). Baseline participants included 229 (123 males, 106 females) adolescents aged 13 to 15 years (13.28 ± .57) who met the actigraphy criteria (described below). At T2 and T3 participants decreased by 8.7% (N = 209) and 12.7% (N = 180) respectively.
Instruments
Actigraphy
Wakefulness movement (PA, SB) and sleep were measured using ActiGraph GT3x accelerometers (ActiGraph, Pensacola, FL, USA). Participants wore the actigraphy on the waist along a full week (24 hours per day), except on water activities (e. g., bathing, swimming). Adolescents were previously instructed on how to handle the accelerometer and how to complete a log, in which they recorded the times they went to sleep at night, the times they woke up in the morning and the times they removed the accelerometer. Data were collected at a sampling rate of 30 Hz and downloaded in 15-s epochs. Actigraphy data analysis was conducted using Actilife v.6 (ActiGraph, Pensacola, FL, USA).
Sleep data was re-integrated in 60-s epoch and scored using Sadeh's algorithm (Sadeh et al., 1994). Sleep onset (SO) was fixed when data indicated five consecutive epochs ≤10 after the last 30-s epoch of activity >10 counts. Sleep offset (SOF) was fixed when data indicated the first 30-s epoch of activity >10 counts after five consecutive epochs ≤10. Log's data was used to help identify and confirm SO and SOF. Any interval that exceeded a 15 min difference between raters was reviewed by themselves until agreement was reached (Master et al., 2019). TST was calculated as the main sleep between SO and SOF, and sleep efficiency (SE) as the percentage of time asleep (Full et al., 2018). Sleep valid data included subjects with ≥160 min of sleep duration and ≥3 nights (one of them on weekend) (Kracht et al., 2020). GT3x accelerometers has showed adequate correlations with polysomnography (Full et al., 2018).
Wakefulness movement was extracted after removing nighttime sleep and nonwear time. Choi's algorithm (Choi et al., 2011) and log information were used to exclude non-wear time. This technique assured that PA and SB were obtained from awake and wear time only. PA intensities (LPA, MPA, MVPA, VPA) and SB data were categorized with Evenson's cut points (Evenson et al., 2008), which have shown to be a valid and reliable measure in youth (Trost et al., 2011). Energy expenditure in METs was scored with Freedson et al. (2005) algorithm. Valid data included ≥10 wear-time hours per day and at least ≥4 valid days (one of them on weekend) (Colley et al., 2010).
Anthropometry
Participants' anthropometric measures were obtained following the International
Society for the Advancement of Kinanthropometry (ISAK) recommendations (Marfell Jones et al., 2011). Participants’ weight (kg) was assessed using a digital professional Tanita RD-545 (Tanita Corporation, Tokyo, Japan). Participants’ height was assessed with a portable stadiometer SECA 213 (SECA Ltd., Hamburg, Germany). BMI was calculated based on the formula Kg/m2 (Garrow & Webster, 1985). BMI cut-off points were those established by the International Obesity Task Force (Cole & Lobstein, 2012).
Socioeconomic Status
It was assessed using the Family Affluence Scale II-revised, developed in the HBSC study (Currie et al., 2014). It includes six questions: car, van or truck ownership (No = 0; One = 1; Two or more = 3), having one’s own bedroom (No = 0; Yes = 1), number of computers, including laptops and tables, but no video game consoles and smartphones (None = 0; One = 1; Two = 2; Three or more = 3), family holidays abroad in the past year (Never = 0; Once = 1; Twice = 2; Three or more times = 3). dishwasher ownership (No = 0; Yes = 1) and number of bathrooms, considering this as a room with bath/shower or both (None = 0; One = 1; Two = 2; Three or more =3). Participants’ scores were added in a single factor and categorized in three levels: low = 0-6; medium = 7-9, high = 10-13. The questionnaire has been validated in different European countries (Torsheim et al., 2016).
Statistical analysis
Multilevel models were used, as they are convenient to observe the variables changes over time: first, standard errors of model parameters are not underestimated, reducing the risk of type I error, and second, it can manage missing data adequately (Field, 2013).
Outcome variables (level 1) were nested in participants (baseline). Linear mixed model procedures were carried out with maximum likelihood (ML) estimates following Snijders & Bosker (2011) procedures. Ten models were fitted for PA, SB and sleep variables, taking the variance for level 1 (repeated measures), and level 2 (participants). The amount of explained variance was calculated using the intraclass correlation coefficients (ICC), which identifies the variance proportion and validates the relevance of using multilevel analysis (Hofmann et al., 2000).
The models were tested taking PA, SB and sleep as dependent variables. The predictors included linear time (1 = baseline/T1, 2 = T2, 3 = T3), gender (1 = male, 2 = female), BMI and SES. Variables were included one by one using a boosting model building strategy (West et al., 2014). Finally, restricted cubic splines were modeled to calculate the adjusted OR with 95% CI for each independent variable. Statistical analyzes were performed using Stata/MP v.15 (StataCorp LP, College Station, TX, USA).
Results
Baseline main characteristics results showed that most of the participants had normal weight (60.7%). Respectively, Table 1 and Table 2 present the wakefulness movement and sleep variables mean values at each time-point. Only 30-40% of adolescents followed MVPA guidelines over the years, remaining relativity constant. Sleep recommendations dropped between T1 (65%) and T2 (27%). T3 showed similar values than T2.
Table 1 Wakefulness Movement Variables Over Time
| T1 | T2 | T3 | ||||
| M (SD) | % WHO | M (SD) | % WHO | M (SD) | % WHO | |
| SB | 610.93 (83.91) | - | 674.96 (83.02) | - | 684.74 (82.32) | - |
| LPA | 194.68 (53.76) | - | 79.82 (24.45) | - | 71.87 (31.37) | - |
| MPA | 34.07 (11.57) | - | 29.51 (9.83) | - | 27.23 (10.93) | - |
| VPA | 21.25 (11.41) | - | 27.85 (13.33) | - | 27.35 (15.87) | - |
| MVPA | 55.32 (20.31) | 35,4 | 57.37 (20.95) | 39,7 | 54.58 (23.57) | 38,3 |
| METs | 1.54 (.16) | - | 1.41 (.15) | - | 1.34 (.13) | - |
Note. SB = Sedentary Behavior, LPA = Light Physical Activity, MPA = Moderate Physical Activity, VPA = Vigorous Physical Activity, MVPA = Moderate to Vigorous Physical Activity, METs = Metabolic Equivalents of Task, WHO = Participants who met Word Health Organization guidelines (60 MVPA minutes per day).
Table 2 Sleep Variables Over Time
| T1 | T2 | T3 | ||||
| M (SD) | % NSF | M (SD) | % NSF | M (SD) | % NSF | |
| SO | 23:28 (48) | - | 23:56 (42) | - | 00:14 (45) | - |
| SOF | 7:58 (37) | - | 7:48 (36) | - | 8:06 (36) | - |
| TST (min) | 495.58 (45) | 65,2 | 460.85 (43.22) | 27,75 | 456.21 (41.54) | 29,44 |
| SE (%) | 91.65 (1.79) | 91.04 (2.22) | 90.11 (1.87) | |||
Wakefulness movement changes over time
Table 3 and Figure 1 show the wakefulness movement evolution across the three time-points. SB increased progressively over the years. Specifically, the cubic spline model indicates a strong increase between T1 and T2 (OR = 1.10, 95% CI = .89, 1.30), then it continues rising more moderately until T3 (OR = 1.20, 95% CI = .87, 1.53). Time invested in LPA, MPA and METs decreased over the years. In particular, the cubic spline models (Figure 1) show a significant drop between T1 and T2 (LPA, OR = -1.57, 95% CI = -1.70, -1.45; MPA, OR = -.39, 95% CI = -.61, -.17; METs, OR = -.67, 95% CI = -.86, -.48), then it continues decreasing more slowly until T3. This decrease (T2-T3) was lower in LPA (OR =-1.69, 95% CI = -1.90, -1.47) than in MPA (OR = -.70, 95% CI = -1.08, -.31) and METs (OR =-1.00, 95 % CI = -.1.34,-.67). VPA significantly increased at T2 (OR = .46, 95% CI = .25, .67), but it decreased the following year (T3) (OR = .37, 95% CI = -.01, .74). VPA levels helped to maintain MVPA relatively constant over the years.
Table 3 Multilevel Models Examining Wakefulness Movement Changes Over Timne
| SB | LPA | MPA | VPA | MVPA | METs | |||||||
| β | SE | β | SE | β | SE | β | SE | β | SE | β | SE | |
| Mixed effects | ||||||||||||
| Intercept | 656.15*** | 12.52 | 115.37*** | 4.57 | 33.95*** | 1.36 | 25.50*** | 1.64 | 55.46*** | 25.77 | 1.50*** | .02 |
| Time-point | ||||||||||||
| T1 | - | - | - | - | - | - | ||||||
| T2 | 64.42*** | 13.41 | -111.33*** | 4.41 | -4.59*** | 1.30 | 6.47*** | 1.49 | 1.79 | 2.48 | -.12*** | .02 |
| T3 | 74.73*** | 21.58 | -119.22*** | 7.62 | -8.05*** | 2.26 | 5.12 | 2.66 | -3.10 | 4.38 | -.17*** | .03 |
| Gender | ||||||||||||
| Male | -13.58 | 9.66 | 8.50* | 3.84 | .21 | 1.14 | 3.11* | 1.45 | 3.32 | 2.34 | .04* | .02 |
| Female | - | - | - | - | - | - | ||||||
| Age | 3.32 | 909 | -6.38 | 3.33 | -.26 | .99 | -.08 | 1.17 | -.26 | 1.93 | -.02 | .01 |
| BMI | 4.22 | 5.00 | 9.31 | 0.92 | -.66 | .57 | -.91 | .71 | -1.53 | 1.15 | -.02 | .01 |
| SES | 1.42 | 4.81 | -.51 | 1.82 | -.99 | .54 | .25 | .66 | -.77 | 1.08 | -.00 | .01 |
| Random effects | ||||||||||||
| Intra variance | 7819.50*** | 805.77 | 893.84*** | 68.87 | 76.08*** | 280.33 | 86.57*** | 6.35 | 249.22*** | 18.48 | .01*** | .001 |
| Inter variance | 1076.52* | 622.25 | 530.81*** | 95.09 | 48.56*** | 393.72 | 93.70*** | 12.00 | 232.37*** | 31.97 | .01*** | .001 |
| ICC | 6490.50 | 6122.56 | 4620.23 | 4791.64 | 5412.19 | 708.86 |
Note. SE = Standard Error, SB = Sedentary Behavior. LPA = Light Physical Activity, MPA = Moderate Physical Activity, VPA = Vigorous Physical Activity, METs = Metabolic Equivalents of Task. BMI = Body Mass Index, SES = Socioeconomic Status. *p<05, **p< 01, ***p<.001
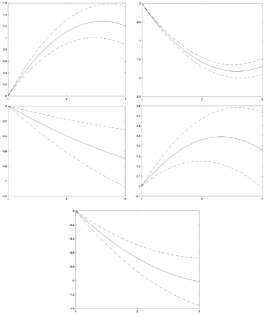
Note. From left to right and from top to bottom: SB = Sedentary Behavior, LPA = Light Physical Activity, MPA = Moderate Physical Activity, VPA = Vigorous Physical Activity, METs = Metabolic Equivalents of Task. The ORs were adjusted with 95% Cl for SB, LPA, MPA, VPA and METs in the three tune-points, controlling age, gender. BMI and SES.
Figure 1 Wakefulness Movement Variables Restricted Cubic Splines Over Time
Sleep variables changes over time
Table 4 and Figure 2 show the sleep variables evolution across the three time-points. SE fell steadily over time. Cubic spline model (Figure 2) shows a progressive decay curve: T2 (OR = -.35, 95% CI = -.56, -.13), T3 (OR = -.83, 95% CI = -1.19,-.48). SO was consistently delayed: T2 (OR = -.52, 95% CI = .31, -.72), T3 (OR = -.93, 95% CI = .58, 1.27).
SOF was earlier in T2 than in T1 (OR = -.32, 95% CI = -.55, -.08), however it was delayed in T3, (OR = .24, 95% CI = -.13, .61). Consequently, TST decreased significantly from T1 to T2 (OR = -.71, 95% CI = -.92, -.51), but the decreasing between T2 and T3 was smaller (OR= -.78, 95% CI = -1.13, -.42).
Table 4 Multilevel Models Examining Sleep Variables Changes Over Time
| TST | SE | SO | SOF | |||||
|---|---|---|---|---|---|---|---|---|
| β | SE | β | SE | β | SE | β | SE | |
| Mixed effects | ||||||||
| Intercept | 470.58*** | 15.70 | 91.07*** | .22 | -1.976*** | 315.44 | 28760.75*** | 248.32 |
| Tune-point | ||||||||
| T1 | - | - | - | |||||
| T2 | -33.40*** | 4.90 | -.72*** | .22 | -1515.52*** | 298.81 | -717.20** | 258.95 |
| T3 | -36.30*** | 8.38 | -1.72*** | .37 | -2712.29*** | 515.03 | 539.61 | 419.81 |
| Gender | ||||||||
| Male | -6.39 | 1.45 | -.72*** | .18 | 211.23 | 269.67 | 40.93 | 196.38 |
| Female | - | - | - | - | ||||
| Age | 1.59 | 3.67 | .10 | 17 | 32.89 | 226.11 | -46.63 | 178.79 |
| BMI | -5.03 | 2.14 | -34*** | .09 | 93.07 | 133.10 | -103.07 | 100.07 |
| SES | -1.30 | 2.05 | .12 | .09 | 354.05 | 126.88 | 291.38 | 97.23 |
| Random effects | ||||||||
| Intra variance | 1130.98*** | 79.92 | 2.76*** | .20 | 4062423.67*** | 289335.17 | 3894663.38*** | 274733.26 |
| Inter variance | 701.91*** | 108.78 | .85*** | 19 | 2855265.34*** | 424985.86 | 842980.59*** | 237358.07 |
| ICC | 6617.18 | 2647.60 | 11824.91 | 11746.06 | ||||
Note. SE = Standard Error, TST = Total Sleep Time, SE = Sleep Efficiency, SO = Sleep Onset, SOF = Sleep Offset, BMI = Body Mass Index, SES = Socioeconomic Status. *p< 05, **p<.01, ***p<.001
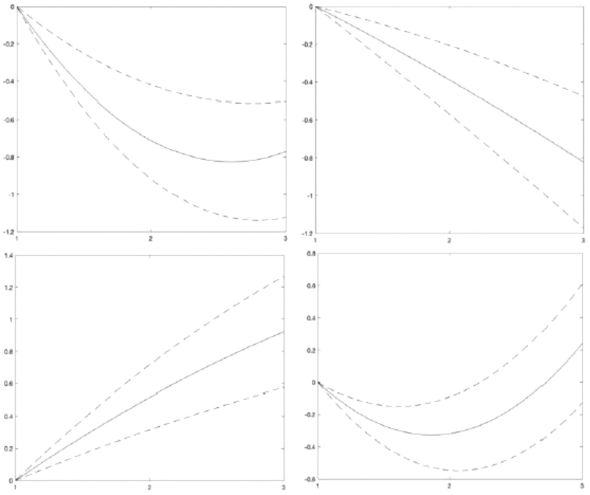
Note. From left to right and from top to bottom: TST = Total Sleep Time. SE = Sleep Efficiency. SO = Sleep Onset. SOF = Sleep Offset. The ORs were adjusted with 95% Cl for TST, SE? SO and SOF in the three time-points, controlling age. gender. BMI and SES.
Figure 2 Sleep Variables Restricted Cubic Splines Over Time
Covariate analysis
Regarding wakefulness movement, boys showed higher levels of LPA, VPA and METs. Neither age, BMI nor SES were significant in any of the PA and SB multilevel analyses (Table 3). Regarding sleep variables, boys had lower SE than girls. BMI was negatively related to sleep efficiency. Neither age nor SES were significant in any of the sleep multilevel analyses (Table 4).
Discussion
The aim of the present study was to assess the wakefulness movement and sleep evolution from early to mid-adolescence with 24-hours accelerometry in a Spanish context. Main results indicate a worsening in most followed variables over time, although with nuances.
Regarding PA variables, there was a decrease in LPA, MPA and energy expenditure. It was particularly noteworthy the strong decline in LPA between T1-T2. Interestingly, VPA significantly increased between T1-T2 and then remained relatively constant, helping to maintain MVPA levels over time. Most previous studies have found that during adolescence total PA decrease due to LPA, while higher intensities such as MVPA and VPA remain constant (Costigan et al., 2019; Metcalf et al., 2015; Mitchell et al., 2013), including in Spanish contexts (Grao-Gruces et al., 2019). However, few studies have found also a decrease in MVPA and VPA levels (Francis et al., 2013; Trang et al., 2012). Indeed, a direct comparison of longitudinal changes in accelerometry assessed PA is challenging due to different data cleaning and processing techniques across studies. Moreover, context factors such as weather conditions can alter PA patterns during the studies measurement period (Quante et al., 2019).
On the other hand, MVPA guidelines adherence was low, considering only 30-40% of adolescents accumulated 60 minutes per day over the three years; similar results as obtained by Metcalf et al. (2015). In addition, longitudinal evidence shows inactivity may track into adulthood (Telama et al., 2005), hence promoting PA in children and adolescents should be a public health priority. In fact, inactivity has been related to hypertension, metabolic syndrome, obesity, less mineral bone density and mental health problems (Strong et al., 2005). Finally, covariate analysis showed that boys had higher levels of LPA, VPA, and more energy expenditure. Most evidence has observed that boys are generally more active than girls (Francis et al., 2013; Grao-Gruces et al., 2019; Mitchell et al., 2013). However, as Farooq et al. (2018) point out, given the high physical inactivity prevalence, there is a need for an approach to all pediatric population and not only specific groups.
Regarding SB, adolescents accumulated many hours doing sedentary activities in all time-points (>10 h). Over time, SB increased, especially between T1-T2. Previous studies systematically show high SB levels in adolescent populations (Beltran-Valls et al., 2021; Contardo-Ayala et al., 2019) as well as its progressive increase throughout adolescence (Tanaka et al., 2014). Among the different sedentary behavior modalities, it seems screen time such as mobile phone use, internet surfing and videogames, is one of the main contributing factors (Marshall et al., 2006). Moreover, considering our results between T1-T2, it seems SB displaced LPA, as has been observed before (Janssen et al., 2016). This could have important implications for future interventions, as light activities could contribute to increase overall PA levels with low structured requirements (e. g. increasing walking time). It should be important in future studies to collect specific data to know the reasons behind this PA and SB pattern.
Regarding sleep variables, TST and SE decreased over time. There was a strong decrease between T1-T2 in TST due to SO delay and SOF advance, although between T2-T3 the decrease was lower (SOF delay). Indeed, regardless of the measurement method, there is a well-documented decline in average TST across adolescence (Beltran-Valls et al., 2021; Maslowsky & Ozer, 2014) as well as a delayed sleep interval (SO and SOF) (Crowley et al., 2014, 2018). Multiple aspects are thought to contribute to these changes, including both intrinsic (e. g., delayed melatonin release; slow wave decrease) and extrinsic factors (e. g., early school start times, increased academic demands, blue light exposure, reduced parental supervision) (Moore & Meltzer, 2008). Thus, a combination of these factors creates the “perfect storm” (Crowley et al., 2018), affecting the adolescents' sleep timing, duration, and architecture. According to our results, previous studies indicate sleep quality decrease during adolescence (Beltran-Valls et al., 2021, Feinberg & Campbell, 2013), although some accelerometer-based evidence shows no significant changes (Kortesoja et al., 2020; Stefansdottir et al. 2020). Maybe discrepancies are due to the context or the method used. For instance, Stefansdottir et al. (2020) conducted the research in a sample of Icelanders aged 15 to 17 years and with two time-points.
Moreover, covariate analysis indicated that boys had less SE compared to girls. Although longitudinal studies have shown that girls have more complains about their sleep (Kortesoja et al., 2020; Meijer et al., 2010), they tend to have an objective better sleep quality than boys (Gillis & El-Sheikh, 2019; Krishnan & Collop, 2006). Finally, it was found an inverse association between BMI and SE. Unfortunately, the underlying reasons for that relationship remain unclear. By contrast, there are certain hypotheses regarding the relationship between BMI and TST, such us the proinflammatory cytokines production and the appetite hormones dysregulation (Spiegel et al., 2004). Moreover, both epidemiological and experimental research demonstrates that short TST is a risk factor for obesity (Sluggett et al., 2019). Thus, following sleep recommendations along with PA and SB guidelines should be also encouraged in adolescent’s populations.
Conclusions
The present study has several limitations: first, due to sample size caution may be needed when generalizing the present findings to other adolescent populations. Second, we controlled in the analyses for several potencial covariates, but other measured ones such as maturity status could have influenced the results. Third, while accelerometers provide valid objective measures, they have limitations such as to collect PA in certain situations (e. g. cycling or swimming). Nevertheless, this longitudinal cohort study with three repeated measures offers an important picture of adolescent PA, ST and sleep levels during adolescence years in a Spanish context. Moreover, 24-h actigraphy was used for one complete week over three consecutive years in the adolescent’s daily live
To sum up, the study shows that Spanish adolescents increased their SB; whereas they decreased their PA levels, especially the lower-intermediate intensities. Although, VPA slightly increased over time, helping to maintain MVPA relatively constant. Despite boys showed better values in some of the PA variables, the high rate of inactivity and SB at the entire sample level require a generalized approach in both genders.
Regarding sleep variables, adolescents delayed their circadian rhythm while reducing sleep quantity and quality. As in the case of wakefulness movement variables, it is necessary to develop interventions and public policies to improve the situation. Future studies should try to include larger samples, more covariates as well as a greater number of time-points in order to obtain more robust conclusions.

