


 English (pdf)
 Article in xml format
 Article references
 Send this article by e-mail
 Cited by SciELO
  Similars in
SciELO
Similars in
SciELO  uBio
uBio 
 Permalink
Introduction
Ant gardens (AGs) are spherical carton nests built by ants on trees; in them, the ants deposit seeds of vascular epiphytic plants, which subsequently germinate (Davidson, 1988). The ants provide these epiphytes with protection against herbivory through patrolling and a suitable substrate for establishment (i.e. growth of epiphytes up to the reproductive phase) through the transport of organic material (Kleinfeldt, 1978). In turn, the plants offer structural support and a variety of food resources to the ants (Madison, 1979).
AGs have been reported in humid tropical ecosystems and near water bodies (Yu, 1994). The composition of epiphytes in AGs is influenced by ant species and AG size, among other factors (Leal et al., 2017). AGs have high ecological value because the mutualistic relationship allows them to hold water and nutrients, harbor an associated fauna, and facilitate vascular epiphytes (Céréghino et al., 2010). However, there are still questions regarding the natural history of AGs (Leal et al., 2017). In addition, studies on ecosystems other than humid tropical forests and Colombian ecosystems, in general, are scarce (Bader, 1999).
Therefore, the objective of this study was to characterize the spatial distribution, formation process, diversity, demography, and phenology of AGs in a secondary dry premontane transitional forest in Colombia.
Materials and methods
Study site: We conduct the study in Colombia, in the rural area of the municipality of Cali, Pance jurisdiction, El Peón district, in Loma Larga Reserve, near Farallones National Park. The geographic coordinates are (3°19'0.7'' N - 76°34'39'' W), with an altitude ranging from 1 100 to 1 250 m.a.s.l. The mean temperature is 24.8 °C, as recorded at Universidad del Valle meteorological station (IDEAM, 2018). The mean annual rainfall is 1 997 mm, as recorded at La Pajarera gauging station, located in Loma Larga Reserve (L. G. Naranjo, personal communication, 2019). According to the system of Espinal (1964), the life zone is a transition between dry forest and premontane forest. The habitat corresponds to secondary forest patches surrounded by ravines, scrub, and livestock pastures (Sardi et al., 2018).
Species identification and formation process of Ant gardens: Ants and insects associated with Ant gardens (AGs) were collected and identified at the entomology section of Universidad del Valle using the key by Longino (2007) and confirmed by J. Longino (personal communication, 2018). AG epiphyte and tree samples were collected, processed, and identified at the CUVC Herbarium of the Universidad del Valle (Cali, Colombia).
We conducted searches for AGs during January and February of 2018, on a transect of 100 m long and 5 m wide, on the banks of the Quesada River and in the forest. In this transect, we recorded a total of 170 AGs to calculate the density (Appendix 1). In addition, we georeferenced each AG with a Garmin GPSMAP 60CSx GPS receiver.
We selected and marked 28 AGs of different sizes and heights for monitoring every two weeks between March 2018 and February 2019. In the biweekly follow-up, we recorded the use (i.e., presence of ants and epiphytes) and the size of the AGs, the phenology, and the demography of their epiphytes. Additionally, we performed day and night observations of AGs for 40 hours on different days to describe ant behavior during AG formation. We prioritized the observation of AGs with epiphytes in the reproductive stage. Finally, we dissected a large AG and described its structure.
We made AG size and ant behavior observations for demography and took photographs and videos with a Canon Powershot Sx530 Hs 50x camera. For heights greater than two meters, we held a ruler next to the AG attached to the tip of a rod. We used the photographs to calculate the size of the AGs.
Spatial distribution and size of Ant gardens: We established six lines 100 m long at each side and at different distances from the Quesada River: 0 (bank), 10, 20, 30, 40, and 50 m, for a total of 12 lines, to ensure coverage of all distances from the river. Within each line, we selected at random eight points using a table of random numbers in Excel. Surrounding each point, we established a plot of 5 × 5 m, to complete 16 plots for each distance from the river and 96 plots in total (2 400 m2). In each plot, we registered only trees with the presence of AGs. We recorded the location, height (m), estimated size (cm), and proximity to the river (m) of the AGs found, as well as the epiphyte species present in them. We used the total AGs registered to calculate the density.
We measured the height of the AGs in the trees using rods of known length, from the ground to the point where the AG was located. The size of the AGs was visually estimated and categorized following Davidson (1988). We established three size categories according to diameter: small (0-19.9), medium (20-39.9), and large (≥ 40 cm). We used metric tape to measure the distance to the river. We performed observations of AGs located more than 3 m high with Nikon 8 × 35 binoculars.
Diversity, abundance, phenology, and demography of epiphytes in Ant gardens: We recorded the diversity, richness, or number of species of epiphytes in the 28 AG selected to follow up. For abundance, we recorded the number of individuals of each species in the AGs. For phenology, we established four phenophases according to Fournier (1974): Flower buds (Fb), flowers (Fl), immature fruits (If), and mature fruits (Mf). In each AG, we recorded the presence of each phenophase for each epiphyte. For epiphyte demography, we established three growth stages: seedling, juvenile and adult. We recorded the number of individuals of each epiphyte for each growth stage in the visible half of each AG.
Data analysis: We calculated the density of AGs on the river bank using the river's length measured in ArcGIS® (ESRI, 2011) and the number of recorded AGs. We evaluated the distribution pattern of the AGs using a distance-based hypothesis test, with the G function, within the context of spatial statistics, the methodology of spatial statistics area data (point patterns). The G function measures the distribution of the distances from an arbitrary point xi to its nearest neighbor, expressed as follows:
G(r)=(N°{r i ≤ r}) ⁄ n
Where n is the total number of AGs found; r i is the minimum distance between an AG and its neighbor; and r is the random variable of the distance to the nearest AG (Bivand et al., 2013).
We tested the relationship between the number of AGs and the distance to the water body with a Pearson (t) correlation analysis (Freedman et al., 2007). We used a simple linear model (lm) to establish the relationship between AG size and proximity to the water body (lm (size ~ proximity)). Likewise, we used a fitted linear model, using the gls function (nlme package, weights: VarPower; Dobson & Barnett, 2008), to establish the relationship between AG height and proximity to the water body (gls (height ~ proximity)). The fitted linear model was necessary due to the absence of normality in the height variable.
We used a simple linear model (lm) to evaluate the relationship between AG size and epiphyte richness. In addition, we performed a post-ANOVA Tukey's Test (Tukey, 1977) to assess which garden size presented greater epiphyte richness. Finally, we performed analyses of richness based on the number of adults and juvenile individuals because these stages are more stable in the AGs.
We performed Pearson (t) correlation analysis between AG growth and size and between AG growth and rainfall. The growth data were obtained by standardizing the AG size data during the months of measurement (March-July 2018) and fitting them using functions in the collection of the tidyverse package (Wickham et. Al, 2019). Adjustment through tidyverse packages allowed us to evaluate the AG growth regardless of size. We evaluated assumptions about the error in the adjusted models through the Shapiro-Wilk test (Shapiro & Wilk, 1965) for normality and the Levene's Test (Levene, 1960) for homoscedasticity. These tests were performed for all datasets, using a significance level of < 0.05. For the correlation analysis among variables, we used the cor.test function with the Spearman (r) and Pearson (t) tests, according to the normality of each pair of variables. We performed all the statistical models and correlation analyses presented above in the statistical software R® (R Core Team, 2013).
We used the photographs to measure AG size and perform the demographic count were processed in ImageJ® software (Version 1.51j8.; Rasband, 2018). We completed the demographic count of seedlings using the cell counter tool of this software.
We performed the phenological analysis using the percentage of intensity of the phenophase in each species. We calculated the intensity from the number of AGs that had a certain phenophase over the total AGs with the presence of the epiphyte in the adult stage. We compared phenological and demographic data with rainfall using correlation analysis. We used Spearman correlation for phenological analyses except for Epiphyllum phyllanthus (Pearson's test). We performed demographic analysis using Spearman's correlation test. We used the classification reported by Newstrom et al. (1994) to describe the frequency of the phenophases of the epiphyte species.
Results
Species, density, and formation process of Ant gardens: We recorded ten epiphyte species (Table 1, Fig. 1) and 13 tree species associated with the Ant gardens (AGs) (Table 2). We identified the AG-forming ant as Azteca ulei (Fig. 2). The hemipterans associated with ants in the AGs belonged to the family Coccidae and were tended by the ants inside channel-shaped cavities.
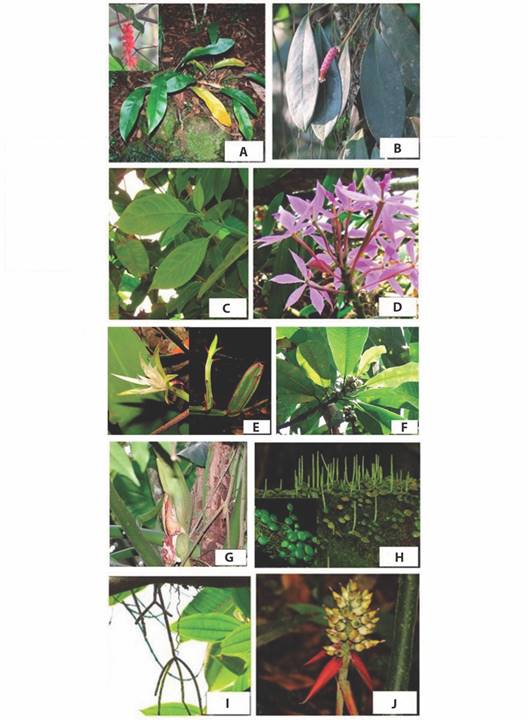
Fig. 1 Epiphytic plants of the Azteca ulei ant gardens in the Loma Larga Reserve, Valle del Cauca, Colombia. a) Anthurium gracile, b) Anthurium obtusum, c) Drymonia serrulata, d) Epidendrum flexuosum, e) Epiphyllum phyllanthus, f) Ficus paraensis, g) Philodendron barrosoanum (Photo: J.M. Ruiz), h) Peperomia rotundifolia, i) Rhipsalis baccifera, j) Aechmea angustifolia. Photos: Á. Barrera.
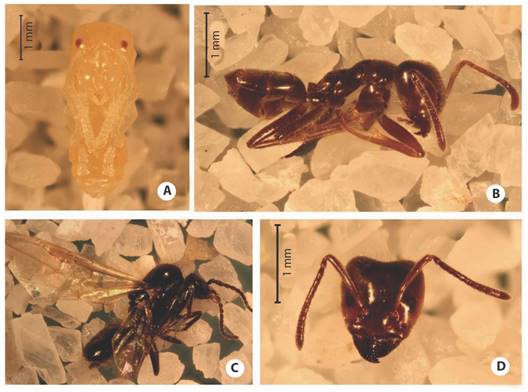
Fig. 2 Individuals of Azteca ulei collected in ant gardens. a.) Pupa, b.) General view of worker, c.) Winged male, d.) Frontal view of worker's head. Photos: V. Sarria.
Table 1 Diversity and abundance of epiphytic plants from the ant gardens in the Loma Larga Reserve, Valle del Cauca, Colombia
| Ant garden size | Small (0-19.9 cm) | Medium (20-39.9 cm) | Large (≥ 40 cm) | ||
| Family | Species | Total | |||
| Araceae | Anthurium gracile (Rudge) Schott 1,2,5 | 2 | 6 | 3 | 11 |
| Araceae | Anthurium obtusum (Engl.) Grayum 1,2,5 | 0 | 0 | 3 | 3 |
| Araceae | Philodendron barrosoanum G.S. Bunting5,6 | 0 | 0 | 1 | 1 |
| Bromeliaceae | Aechmea angustifolia Poepp. & Endl. 1,2,5 | 7 | 13 | 4 | 24 |
| Cactaceae | Epiphyllum phyllanthus (L.) Haw. 1,2,4 | 3 | 13 | 5 | 21 |
| Cactaceae | Rhipsalis baccifera (Sol.) Stearn.6 | 0 | 1 | 0 | 1 |
| Gesneriaceae | Drymonia serrulata (Jacq.) Mart. 6,7 | - | - | - | - |
| Moraceae | Ficus paraensis (Miq.) Miq. 1,2,4 | 5 | 11 | 4 | 20 |
| Orchidaceae | Epidendrum flexuosum G. Mey. 1,2,3 | 3 | 6 | 3 | 12 |
| Piperaceae | Peperomia rotundifolia (L.) Kunth 5,6 | 1 | 0 | 0 | 1 |
| Reproductive status (%) | 28.6 | 66.7 | 83.3 | ||
| Average number of species | 3.0 | 3.3 | 3.8 |
1. Epiphytes where Azteca ulei were observed carrying their seeds to the ant garden. 2. Epiphytes in which Azteca ulei patrolled seedlings and reproductive adults, epiphytes. 3. Found only in ant gardens. 4. Found rarely outside of ant gardens (usually near them). 5. Found inside and outside of ant gardens. 6. Recorded only once in ant gardens. 7. D. serrulata was not found in monitored ant gardens, but it was found in the initial census.
Table 2 Diversity, abundance and proportion of trees from the ant gardens in the Loma Larga Reserve, Valle del Cauca, Colombia
| Family | Species | Abundance (n) | Proportion (%) |
| Araliaceae | Dendropanax cf. arboreus (L.) Decne. & Planch. | 1 | 3.6 |
| Erythroxilaceae | Erythroxylum citrifolium A. St.-Hil. | 1 | 3.6 |
| Fabaceae | Inga cf. ornata Kunth | 2 | 7.1 |
| Fabaceae | Calliandra pittieri Standl. | 5 | 17.9 |
| Lauraceae | Cinnamomum triplinerve (Ruiz & Pav.) Kosterm. | 3 | 10.7 |
| Melastomataceae | Henriettea seemannii (Naudin) L.O. Williams | 3 | 10.7 |
| Melastomataceae | Miconia matthaei Naudin | 3 | 10.7 |
| Meliaceae | Guarea guidonia (L.) Sleumer | 1 | 3.6 |
| Meliaceae | Trichilia pallida Sw. | 2 | 7.1 |
| Moraceae | Ficus paraensis (Miq.) Miq. | 2 | 7.1 |
| Myrtaceae | Eugenia cf. egensis DC. | 3 | 10.7 |
| Myrtaceae | Myrcia cf. popayanensis Hieron. | 1 | 3.6 |
| Myrtaceae | Syzygium jambos (L.) Alston | 1 | 3.6 |
A summary of the natural history observations can be found in the supplementary information (Appendix 2) and discussed in the following section. Patrolling and foraging were the main activities performed by A. ulei. This ant performed patrolling on some of the AG epiphytes (Appendix 2). During patrolling, A. ulei attacked the majority of insects or vertebrates that visited the AGs. The objects foraged by A. ulei included various materials, particularly seeds and pieces of fruits from certain epiphytes in the AGs (Appendix 2). In general, the observed AGs had active ants during the monitored year, except for some AGs that were abandoned.
The dissected AG was constructed from plant material, was light brown in its interior, and contained multiple connected cavities. Internally we observed multiple roots, pieces of leaves, and small hollow branches that bounded the cavities, all held together by a matrix of apparently processed plant material. The A. ulei from the dissected AG were polymorphic workers, winged males, and pupae (Fig. 2). We did not found queens.
Spatial distribution and size of Ant gardens: The AG density was 65/ha (1/154 m2) in the plots and 1/10 m along the river. Within the study site, the distribution of AGs presented an aggregate pattern, such that 32 % of AGs (n = 170) were recorded in groups of two to five AGs in the same tree. Regarding vertical distribution, AGs were found at ground level (fallen) up to 15 m, with a mean height of 5 m.
The number of AGs increased significantly near the river (t = -3.9907, P = 0.0162) and was almost zero 20 m from the riverbank (Fig. 3). However, we did not find a relationship between AG height and proximity to the river (gls, P = 0.5791) or between AG size and proximity to the river (lm, P = 0.5018).
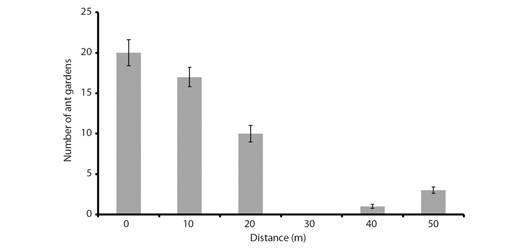
Fig. 3 Number of Azteca ulei ant gardens found at different distances from the Quesada River, in the Loma Larga Reserve, Valle del Cauca, Colombia. Vertical lines = ± S.D.
The AGs had a mean diameter of 30.1 cm, ranging from 4-61.6 cm. We did not find a trend for AG growth, nor was there variation in the growth of AGs of different sizes (t = -0.5182, P = 0.5549). Moreover, AG growth was not dependent on rainfall.
Diversity, abundance, phenology, and demography of epiphytes in Ant gardens: Epiphyte richness in AGs consisted of ten species and was higher in large AGs (lm, P = 0.0110). The abundance of these epiphytes and their restriction to the AGs are shown in Table 1. Differences were found between the richness of large and small AGs (Tukey, P = 0.037) and between small and medium AGs (Tukey, P = 0.030). On average, we recorded three species of epiphytes in each AG, with variations in AG size (Table 1). The richness of trees was 13 species; their abundances are shown in Table 2.
Among the observed AGs, 60 % had epiphytes with some reproductive phenophase during the year of study and had diameters between 21.5 and 62 cm. In addition, we registered reproductive phenophases in 83 % of the large AGs, 87 % of the medium AGs, and none of the small AGs during the studied year.
Aechmea angustifolia and Epidendrum flexuosum had a sub-annual (bimodal) phenological pattern for most of its phenophases (Fig. 4A, Fig. 4B). For both species, we observed an increase in the intensity of the flower bud and flower phenophases in the dry season. The flower bud and flower phenophases showed a significant and negative relationship with the cumulative rainfall for two, three, and four weeks before the event for both species (Spearman correlation). The mature fruit phenophase increased in the rainy season in both species, with a significant positive relationship between this phenophase and cumulative rainfall four months before the event only for E. flexuosum. For Anthurium gracile (Fig. 4C), the pattern of phenophases was the same as A. angustifolia and E. flexuosum, with no correlation between the phenophases and rainfall. Anthurium obtusum did not show a trend in its phenophases (Fig. 4D), and Epiphyllum phyllanthus showed a continuous pattern in its phenophases (Fig. 4E), without any correlation between the phenophases and rainfall.
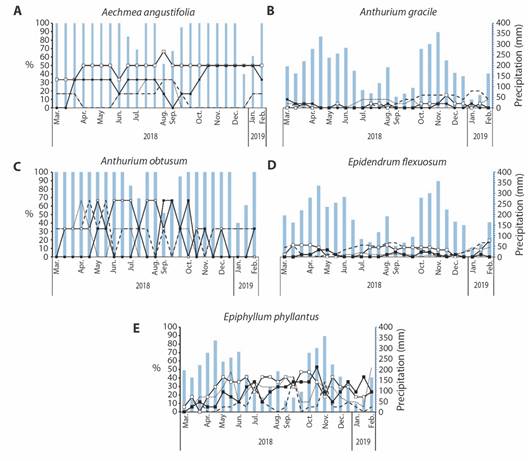
Fig. 4 Phenology of epiphytic plants from ant gardens growing in the Loma Larga Reserve, Valle del Cauca, Colombia. A. Aechmea angustifolia (n = 16). B. Epidendrum flexuosum (n = 9). C. Anthurium gracile (n = 5). D. Anthurium obtusum (n=3). E. Epiphyllum phyllanthus (n = 18). Blue bars ( ) represent precipitation (mm); dotted line (
 ) represents flower buds; dashed line (
 ) represents flowers; open squares line () represents immature fruits; closed squares line (
 ) represents mature fruits.
The proportion of the epiphyte growth stages varied according to AG size, and there was also a variation in the number of individuals at each stage during the count months. Only the seedlings had a positive correlation with rainfall (r = 0,6914; P = 0,0064), where the number of individuals was reduced in the dry season.
The population size of the epiphytes of AGs also varied during the count months (Fig. 5). A. obtusum, E. flexuosum, and A. gracile had smaller populations (< 100 individuals), while E. phyllanthus, A. angustifolia, and Ficus paraensis had larger population sizes (160-753 individuals). F. paraensis was the only species with a positive relationship with rainfall (r = 0.5859, P = 0.0226).
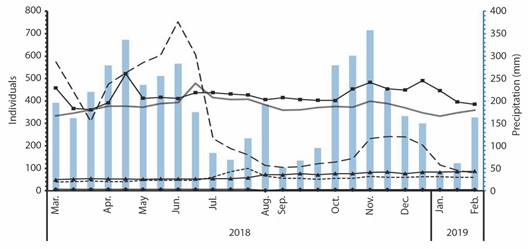
Fig. 5 Population size changes of epiphytes found in Azteca ulei's ant gardens, during March 2018 to February 2019, in the Loma Larga Reserve, Valle del Cauca, Colombia. Closed squares line () represents Aechmea angustifolia; dotted line () represents Anthurium gracile, black rhombuses line ( ) represents Anthurium obtusum; black triangles line (
 ) represents Epidendrum flexuosum; double continuous line () represents Epiphyllum phyllanthus; dashed line () represents Ficus paraensis. Blue bars () represent precipitation (mm).
Discussion
Species and formation process of Ant gardens: The morphological characteristics of the ants in the Ant gardens (AGs) resemble those of Azteca gnava from Costa Rica and A. ulei from Brazil. We chose A. ulei because it is the oldest name (Longino, personal communication, 2018). Furthermore, there are no known differences between A. gnava and A. ulei, suggesting that they are closely related, are the same species, or perhaps are a species complex (Longino, 2007; Ward, 2019).
The Coccidae found in the Loma Larga AGs are phloem-sucking insects associated with AGs (Youngsteadt et al., 2008) and with ants of the genus Azteca (Catling, 1997) and serve as a food source for the ants (Way, 1963). In this regard, Weissflog et al., (2017) suggest that the feeding of Coccidae on the host plant phloem is a mechanism that has a nutritional function and provides moisture to the AG.
The care of hemipterans on E. flexuosum by A. ulei could be related to the restricted occurrence of this epiphyte in AGs and could compromise the condition of this epiphyte (Kaufmann, 2002). However, we did not record plants of E. flexuosum in poor condition.
A. gracile, E. flexuosum, E. phyllanthus, P. rotundifolia and F. paraensis were reported as epiphytes of AGs in previous studies (Davidson, 1988; Morales-Linares et al., 2017; Orivel & Leroy, 2010). However, the identification of A. angustifolia and A. obtusum as epiphytes of neotropical AGs is novel.
As in other ant species that build AGs (Kleinfeldt, 1978; Vantaux et al., 2007), patrolling and foraging are performed throughout the day by A. ulei. The foraging performed by AG ants such as A. ulei includes the lodging of particles in the walls of the internal cavities of the AGs, which enriches the substrate (Weissflog et al., 2017). The patrolling carried out by A. ulei safeguards the food and structural resources offered by the plants. Among the frequent epiphytes in AGs, A. angustifolia, A. gracile, A. obtusum, E. flexuosum, E. phyllanthus, and F. paraensis provided structural and food rewards for A. ulei, which corroborates their contribution to the mutualistic relationship and have been reported previously (Catling, 1995; Davidson, 1988; Davidson & Epstein, 1989).
We explain the presence of the orchid E. flexuosum in AGs by the active transport of their tiny seeds (5-9.5 mm), which they carry, held on their mandibles, one by one, as observed in this study and by Morales-Linares et al., (2018). These findings are evidence against other hypotheses for the presence of orchids in AGs by mechanisms such as wind dispersal (Catling, 1995) or by the opportunistic establishment of AGs around orchids (Kaufmann et al., 2001).
The observation of the growth stages of F. paraensis in the AGs shows that this hemiepiphyte, in addition to providing food via its fruits (Yu, 1994), offers two types of structural support for AGs. First, in the juvenile stage, F. paraensis generates roots that support the AG; then, in the adult stage, it develops adventitious roots in the fork of its branches that create spaces conducive to the accumulation of detritus by the ants, which allows the formation of AGs (Bain et al., 2014). Consequently, the F. paraensis individuals sown by the ants increase the space for the A. ulei colony to build new AGs.
The abandonment by the ants of certain AGs with big plants showed the AG allows the maintenance of the substrate and prevents the plants from dehydrating. Schmit-Neuerburg & Blüthgen (2007) observed that ants constantly repair the substrate and incorporate new materials.
Spatial distribution and size of Ant gardens: The AGs of the studied dry premontane transitional forest showed an aggregated distribution pattern, which coincides with the polydomy of A. gnava colonies (Longino, 2007). This aggregated distribution pattern could also be explained by the abundance of AGs in the riparian habitat. The abundance of AGs in these open habitats could be due to a greater supply of resources and moisture (Yu, 1994). However, the vicinity to the river of AGs did not mean an increase in the size of the gardens. The size of AGs in this study was similar to that reported for AGs of A. gnava in other ecosystems (> 60 cm) (Longino, 2007; Morales-Linares et al., 2017). We suggest that the ants' behavior determines the size of AGs and not the microhabitat.
Diversity, abundance, phenology, and demography of epiphytes in Ant gardens: The diversity of epiphytes in the dry forest is lower than in other ecosystems due to the water stress experienced by these plants (Gentry & Dodson, 1987; Werner & Gradstein, 2009). This pattern is consistent with the richness of ten epiphytes found in the AGs compared with that involving up to 26 epiphytes in AGs of A. cf. gnava in humid tropical forests (Morales-Linares et al., 2016; Morales-Linares et al., 2017).
Nevertheless, the mean diversity of three epiphytes per AG was similar to that found by Morales-Linares et al., (2016), along with a pattern of greater richness in larger AGs (Catling, 1997; Morales-Linares et al., 2017). This positive relationship between richness and size can be understood through island biogeography theory (MacArthur & Wilson, 1967), where a larger area provides greater possibilities of colonization by epiphytes.
A. angustifolia and E. phyllanthus were the most frequent epiphytes in AGs, possibly due to their adaptations to water stress (Benzing, 1990; Kaufman, 2002). Despite not having evident anatomical or metabolic adaptations against desiccation, F. paraensis was also very common in AGs, which shows that the mutualistic interaction with A. ulei could be protecting it against seedlings desiccation (Schmit-Neuerburg & Blüthgen, 2007), in addition to the high number of its seeds that were observed germinating in the AGs.
Regarding the trees, arboreal ants are more abundant in trees with a capacity to host hemipterans or those that have extrafloral nectaries (Blüthgen et al., 2000; Morales-Linares et al., 2016). However, Calliandra pittieri was the most frequent tree species for AGs despite not having these characteristics. Therefore, the frequency of AGs in C. pittieri may be because it is one of the most abundant trees in this forest (Sardi et al., 2018) and not a possible preference by A. ulei.
The AGs allowed the establishment of adult epiphytes in reproductive status, where the bimodal sub-annual phenological pattern was the most common (i.e., A. angustifolia, A. gracile, E. flexuosum). The flowering peaks in the dry season and fruiting peaks during the rainy season registered for these species is a frequent pattern in tropical forest plants (Sahagun-Godinez, 1996). This pattern can be explained by proximate causes, which correlate with environmental phenomena (Van Schaik et al., 1993; Williams-Linera & Meave, 2002).
The flowering of A. angustifolia, A. gracile, and E. flexuosum in the dry season could be due to endogenous factors such as the water state of the plant, which in turn responds to the seasonal availability of water in the environment. In this case, these epiphytes have organs or mechanisms to accumulate moisture; therefore, they can trigger flowering in the dry season by collecting water during the rainy season (Borchert, 1994). In turn, fruit production in the rainy season is common in tropical dry forests (Levey, 1988). Therefore, it could have as a proximate cause the high water demand required by fleshy fruits (e.g., A. angustifolia, A. gracile) for their development and turgor (Lieberman, 1982).
E. phyllanthus was the only epiphyte with a continuous phenological pattern. The succulence of its leaves likely allows it to retain water at a level where its reproductive phenophases are independent of rainfall.
Aridity is the most significant physical threat to seedlings because they dehydrate more quickly than at more advanced growth stages due to their higher surface/volume ratio and smaller size (Benzing, 1990). The number of seedlings established during the dry season decreases, and it marks the limit of the number of adult individuals that remain in the AGs of A. ulei.
Similar to seedling survival, the variation in the population sizes of the epiphytes could be related to the presence of adaptive, morphological, and metabolic strategies against desiccation, which includes their occurrence in AGs. For this reason, all epiphytes, except F. paraensis, showed a demographic pattern independent of rainfall because they have these strategies. However, the high number of F. paraensis individuals that germinate during the rainy season could compensate for the intense pressure imposed by the dry season on the growth of these seedlings and, again, explain why F. paraensis is one of the most frequent epiphytes in AGs.
In conclusion, the mutualism between A. ulei and the epiphyte species growing in their AGs is partially influenced by the seasonality of an ecosystem with dry forest elements. Nevertheless, the information on the spatial distribution, the formation process of AGs, diversity, phenological and demographic patterns indicate that AGs built by A. ulei are favorable microhabitats for epiphytes germination, establishment, and reproduction in this dry premontane transitional forest.
Ethical statement: the authors declare that they all agree with this publication and made significant contributions; that there is no conflict of interest of any kind; and that we followed all pertinent ethical and legal procedures and requirements. All financial sources are fully and clearly stated in the acknowledgements section. A signed document has been filed in the journal archives.

