


 English (pdf)
 Article in xml format
 Article references
 Send this article by e-mail
 Cited by SciELO
  Similars in
SciELO
Similars in
SciELO  uBio
uBio 
 Permalink
Carnivore decline and local extinctions are tragic, and they can produce effects that reverberate across entire ecosystems (Hunter, 2011). To know the environmental variables that affect the ecological role of wildlife is a clue about factors influencing carnivore population size and dynamics, and the role of resource limitation (a bottom-up process; Laundre & Hernández, 2010). For conservation purposes, it is essential to determine how species respond to habitat disturbance; for example, fire has a strong influence on forest structure; it has been associated with the simplification of forest structure (Collins, 2012) and animal communities can be affected by fire via direct mortality, or indirectly through the alteration of habitat resources (Whelan, Rodgerson, Dickman, & Sutherland, 2002).
If we are to take actions focused on preserving the species, the cougar (Puma concolor) could be a good key species because it is considered a species with low tolerance to human activity (Logan & Sweanor, 2001; Foster, Hamsem, & Doncaster, 2010; ZarcoGonzález, Monroy-Vilchis, Rodríguez-Soto, & Urios, 2012; Rodríguez-Soto, HernándezTéllez, & Monroy-Vilchis, 2013), and low population densities and wide home ranges, render this predator vulnerable to environmental changes (Núñez, Miller, & Lindzey, 2002; Rodríguez-Soto et al., 2013), such as deforestation, changes in soil use, and human activity (Ripple & Beschta, 2006; Foster et al., 2010; Foster et al., 2014; Zarco-González & Monrroy-Vilchis, 2014), which directly affect its distribution, abundance, reproduction and survival (Mcloughlin, Morris, Fortin, Wal, & Contasti, 2010). Studies on cougars in Mexico are scarce (Monroy-Vilchis, Rodríguez-Soto, Zarco-González, & Urios, 2009; Zarco-González, Monroy-Vilchis, & Alaníz, 2013; Monroy-Vilchis & Soria-Díaz, 2013).
It is important to know how the cougars take advantage of environmental factors and how its use varies along time (Laundre & Hernández, 2010). The cougar utilizes habitat components differentially (Krauman, 1999), according to availability, abundance, or possible advantages to supply its needs (Hutton, 1985); and the cougar use or selection of resources depend on the species with which it coexists, such as co-predators and preys, which may limit its distribution (McLoughlin et al., 2010). Besides, there are no medium-term studies on how this species adapts to changes in the environment. Thus, the goal of this study was to document the factors that affect the way in which cougars use environmental variables: such as vegetation and paths based on their availability, and whether this usage is the same throughout the years. We also investigated the degree of association between this predator and sympatric species in the spatial or temporal context. Additionally, we analyzed which variables determine cougar presence in the study area, with or without natural disasters, like the fire of 2011 near to the reserve.
Material and methods
Study area: The study area was the El Edén Ecological Reserve (REEE) and its surroundings, in the Lazaro Cardenas municipality, State of Quintana Roo, Northeast of Yucatán Peninsula in Mexico (21°36’00” - 20°34’00” N & 87°06’00” - 87°45’00” W). The altitude varies from 5 to 10 m (Lazcano-Barrero, March, Núñez, Ruelas, Muñoz-Alonso, & Martínez, 1992). El Edén encompasses 3 077 ha and is part of the Yalahau biological region (Gómez-Pompa, Allen, Fedick, & Jiménez-Osorio, 2003). It is one of the Northernmost tropical forests in the continent, which are partially under federal protection within the 154 052 ha Yum Balam Wildlife Protection Area (Navarro, Ramolina, & Pérez, 2007). The reserve includes five types of vegetation; the most extended types are the medium forest (MF) the secondary forest (acahual), also in less proportion savanna and mixed farming (Schultz, 2003).
Field work: A sampling plan was designed to assess the habitat use of cougars. Fourcamera trapping periods were established (Figure 1): for the months of July-September 2008, October-December 2010, May-July 2011, and August-December 2012. We used digital-camera traps of various models: Cuddeback (expert, Capture and Capture IR; Non Tipical INC), Moultrie (model D444; EBSCO Industries, Inc), and Wildwiew (model Xtrem 4; Stealth CammLLC). The CENJAGUAR (Chávez, Zarza, Ceballos, & Amin, 2007) design was used for camera installation, which consists in selecting two or three stations (places for camera location) inside a 9 km2 plot. At least nine adjacent plots were established, and at least one station per plot was “double” (i.e., two cameras facing each other). These cameras were placed at no more than 1.5 meter-wide trails used by humans, firebreaks, and approximately sixmeter wide dirt roads. Devices were placed at distances between 1.5 and 3 km. In 2008, nine stations were placed in MF, and 18 in Acahual. In 2010, ten stations were placed in MF, and 14 in Acahual. In 2011, ten stations were placed in MF, and 12 in Acahual. In 2012, 12 stations were placed in MF, and 22 in Acahual (Figure 1). Cameras were active 24 hours a day, and were programmed to take a picture every 30 seconds.
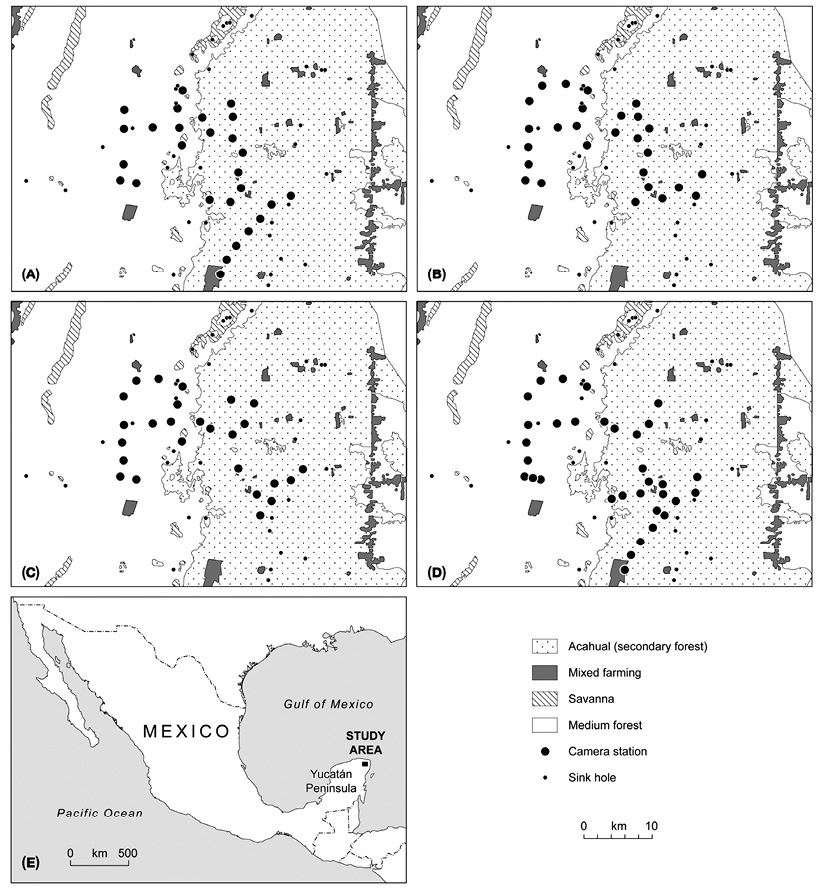
Figure 1: Sampling station distribution over a four-year study (2008, 2010-2012) at the El Eden Ecological Reserve, Quintana Roo, Mexico
The recognition of individuals (cougars) was made by identifying conspicuous marks, such as tail shape, scars, notches on the ears, spots on the inside of the legs and the shape and bearing of the animal (Kelly et al., 2008). Independent photographic records of each species were used for analysis. Independence criteria were: 1) same-species records, identified by color pattern or distinguishing marks, every period longer than 30 minutes; 2) Consecutive records showing different individuals from the same species; 3) Each individual in the photograph among several individuals; 4) each individual from the same species which was not possible to be identified as a distinct individual in consecutive photographic records. Photographic records separated by three-hour or longer periods, were considered independent records.
Relative abundance (RA): The number of independent registers for each species per unit of sampling effort, was used to estimate abundance of cougars and coexisting species (Monroy-Vilchis, Zarco-González, RodríguezSoto, Soria-Díaz, & Urios, 2011). We used the following formula RA=(C/SE)*1000, where: “C” represents captures (independent photographic events); “SE” represents sampling effort (number of cameras per sampling days. To estimate the RA for cougars and to compare it between vegetation and path types for years, the sampling effort by type of vegetation or path was taken into account; a 1000-day-trap unit was established as a standard.
Habitat and environment use: In order to find out whether cougar use environmental variables (vegetation type and paths type) according to the availability of those resources, our null hypothesis was that these are not selected by the animals or selection is random. This was demonstrated by a Pearson’s chisquared statistical test (Chernoff, & Lehmann, 1954; Siegel & Castellan, 1988), using a Monte Carlo method to estimate the corresponding sample significance level (P-value) (Hope, 1968). Camera capture frequencies were taken as observations in each one of the resource categories (MF, acahual, trail, firebreak, and dirt road), as well as in each activity pattern. The percentage of stations placed at each resource type (vegetation and path) was determined in order to calculate the expected proportions resulting from random selection. All the photographic records from each resource type were considered for activity pattern determination. An expected proportion of 10/24 hours for the diurnal/nocturnal period, and of 4/24 hours for the crepuscular period were considered. The size of the sample and the spatial distribution of the cameras involved an increased association between camera observations from nearby devices as well as violation of the principle of normality. For this reason, the bootstrap technique was used to calculate simultaneous confidence intervals (Mandel & Betensky, 2008) for proportions of use by category. The number of bootstrap repetitions was 10 000, with a confidence interval of 1-α/2k using the percentile method, where k is the number of resource categories. The statistic used to demonstrate H
0: p
i
= p
0 , where the real proportion is p
i
for the i-th category, and p
0 is the expected proportion according to the null hypothesis, was the observed proportion for the i-th category  . H0 was rejected when the bootstrap interval for pi did not contain p0.
Activity patterns: Activity patterns were established as: nocturnal, from 20:00 to 06:00; crepuscular, from 06:00 to 08:00, and 18:00 to 20:00, and diurnal, from 08:00 to 18:00 (Monroy-Vilchis et al., 2011). Group of hours; starting with 00:00 hours, hours were grouped in pairs in order to determine activity peaks.
Cougar-prey temporal association: Species associations, as result of activity patterns, were analyzed using the overlapping coefficient (∆), which ranges from 0 (no overlapping) to 1 (full overlapping) (Ridout & Linkie, 2009). The overlapping coefficient estimator was defined as  , where
  , are the two activity functions at the time t when they are compared. Statistical analysis was implemented using the overlap library in R statistical software (V 3.1.0). Confidence intervals were calculated at 95% for d, with 1 000-repetition bootstrap percentiles of ∆.
Cougar-prey spatial association: Spatial association was calculated by means of 2x2 contingency tables, and the null hypothesis stating that species are distributed independently from each other was proven (α = 0.05). The statistic test suggested by Ludwig and Reynolds (1988), with Yates’ correction factor was:
 = (N[|(ad - (bc))| - (N/2)])2/mnrs. Where a = number of sampling units where both species meet; b = number of sampling units where A occurs, but not B; c = number of sampling units where B occurs, but not A; d = number of sampling units where none of the two species were found. N = total number of sampling units (N = a + b + c + d); m = a + b; n = c + d; r = a + c; s = b + d. Consequently, if
  , where
  is quantile 1 - α quantile from the Χ
2 distribution with two degrees of freedom, the hypothesis of species distribution independence is rejected.
is quantile 1 - α quantile from the Χ
2 distribution with two degrees of freedom, the hypothesis of species distribution independence is rejected.
Effects of environmental variables and resource availability on cougar presence: In order to prove the hypotheses concerning the role of environmental variables on cougar presence in the study area (Table 1); this study estimated the effects of vegetation type, horizontal and vertical plant cover (Horizontal plant cover was defined as the percentage of vegetation capable of hiding a subject when it is 15 m away) (Griffith & Youtie, 1988). Vertical plan cover was estimated as the proportion of visibility through the canopy of trees). Distance to water bodies and towns (WPS points of camera traps was analyzed with GIS in ArcView 8.3), path type, as well potential prey, co-predator (jaguar and ocelot), human presence (was analyzed like other species), activity patterns of potential prey, and co-predators were analyzed. In addition, group of different animal by weight were added as a second group of variables.
Table 1: Environmental variables considered for the generalized linear models (GLM). By studied year (2008, 2010-2012) and 18 models with information from the four years at the El Eden Ecological Reserve, Quintana Roo, Mexico byPuma concolor
| Model | Environmental variables | AIC 2008 | AIC 2010 | AIC 2011 | AIC 2012 | AIC Full |
|---|---|---|---|---|---|---|
| 0 | Nil | 93.6 | 53.6 | 68.6 | 99.5 | 320.7 |
| 1 | Co-predators per AP | 90.5 | 59.0 | 74.0 | 81.5 | 315.9 |
| 2 | Co-predators per AP, AVS | 87.6 | 57.0 | 68.6 | 80.0 | 308.9 |
| 3 | All sp + human | 89.2 | 51.8 | 63.1 | 94.8 | 314.7 |
| 4 | All sp + human AVS | 76.9 | 41.8 | 55.6 | 86.2 | 300.2 |
| 5 | All sp + co-predators + human | 79.3 | 55.8 | 57.7 | 91.6 | 307.9 |
| 6 | All sp + co-predators + human AVS | 72.9 | 40.6 | 55.7 | 86.2 | 291.6 |
| 7 | All sp + human per AP | 98.9 | 59.8 | 66.7 | 98.6 | 318.6 |
| 8 | All sp + human per AP AVS | 82.9 | 35.8 | 57.6 | 75.5 | 295.6 |
| 9 | All sp + co-predators + human per AP | 94.6 | 66.2 | 63.7 | 99.4 | 303.4 |
| 10 | All sp + co-predators + human per AP AVS | 80.6 | 43.6 | 51.7 | 70.1 | 288.28 |
| 11 | EF | 88.9 | 56.2 | 75.5 | 107.1 | 326.78 |
| 12 | EF AVS | 84.8 | 55.3 | 68.63 | 99.5 | 320.2 |
| 13 | EF + all sp + human | 89.1 | 51.8 | 63.7 | 98. | 296.5 |
| 14 | EF + all sp + human AVS | 76.2 | 35.2 | 47.5 | 84.7 | 290.6 |
| 15 | All sp by weight group | 89.2 | 54.7 | 73.0 | 105.3 | 328.20 |
| 16 | All sp by weight group AVS | 87.5 | 50.0 | 69.3 | 98.2 | 320.7 |
| 17 | All sp by weight group + EF | 86.2 | 49.8 | 75.7 | 112.4 | 329.9 |
| 18 | All sp by weight group + EF, AVS | 79.0 | 47.8 | 68.6 | 98.2 | 322.2 |
Activity pattern (AP); after variable selection as per AIC (AVS); environmental factors -distance to bodies of water, vegetation type, path type, prey or co-predator traces, plant cover- (EF). All species, considered all species photographed with independent records (All SP).
According to Davis, Kelly and Stauffer (2011), species were classified as large mammals (8-26 kg), medium-sized mammals (3-8 kg), small mammals (1-3 kg), large birds (2-6 kg), and small birds (< 2 kg).
To analyze the effect of the presence of cougar by environmental variables, prey and co-predator presence, the stations were considered as independent sampling units when the distance between them was longer than 1.5 km. It was assumed that all vegetation and path types were accessible to all species.
The effects of all variables on cougar presence were evaluated with a generalized linear model (GLM) (Sileshi, 2008) assuming a negative binomial distribution. Parameters were estimated using the glm.nb function in R software. Variable effect significance was determined by means of an asymptotic t-test at α = 0.05 level. Akaike’s Information Criterion (AIC) was employed to select the best model (Burnham & Anderson, 2002); this criterion favors simpler models by penalizing by number of parameters. Ninety models were thus generated.
Results
The sampling effort of 6 942 day-traps resulted in the identification of 40 cougars during the four-year study. The number of individuals varied across years: the lowest number of captures was in 2010 (seven individuals), and the greatest in 2008 (13 individuals). Of these, only five were considered residents when identified through the years, and only one of them was identified the four years. A total of 134 independent records were obtained and used to perform the habitat use and activity pattern analyses. A total of 26 species cohabited with cougars in this study area, but their capture rates varied across years, and not all the species were registered every year of the study (Figure 2).
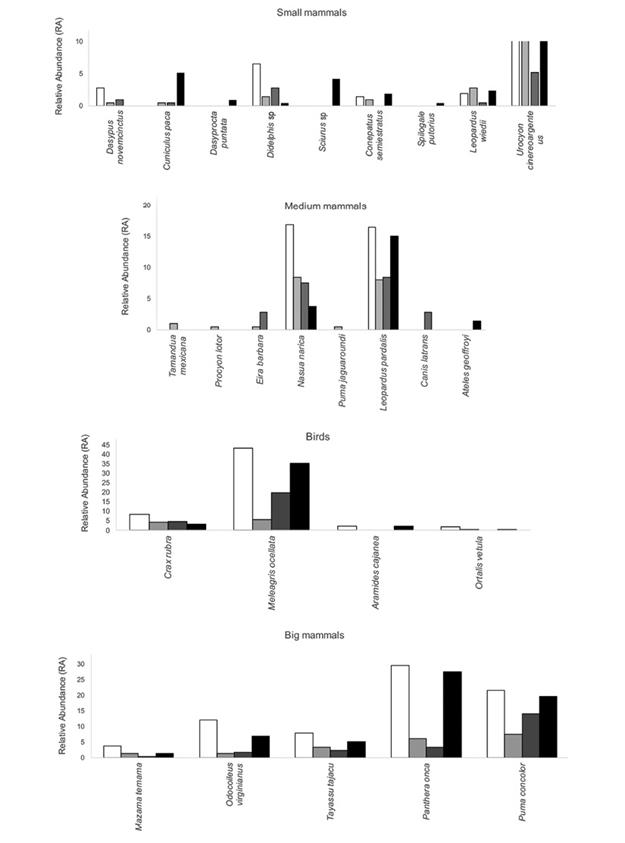
Figure 2: Bird and mammal species photographed during the four-year study and their relative abundance (independent photos /sampling effort * 1000) in the El Eden Ecological Reserve, Quintana Roo, Mexico (Black bars= 2008, light grey bars= 2010, dark grey bars = 2011, White bars = 2012).
Habitat and environmental use: The 54 % of photographic records occurred in acahual and the remaining 46 % in MF. Relative abundance varied annually in both vegetation types. In MF the RA was 34.7, 25, 19 and 7.8 respectively per year, and in acahual the RA was 14.6, 5.9, 13.8 and 15.6. According to the χ 2 test and bootstrap intervals, acahual use was less than expected in 2008, while in 2011 it was used more than expected; the opposite was for the MF in the same years.
During the four study years period, 46% of records were obtained on trails, 44% on roads, and the remaining 10% on firebreaks. Cougar presence in each type of path varied annually: RA on trails was 12.5, 20.8, 11.9 and 10.41; in roads 15, 5.6, 18.5 and 13.1, and in firebreaks 12.5, 20.8, 11.9 and 10.41, respectively per year of study. In 2011, cougars used the trail category in a less than expected proportion, while the dirt road was used more than expected, based on availability (α = 0.05).
Activity pattern: Cougars were active at all times; most of the registers were nocturnal, with activity peaks between 20:00 and 02:00. The predator’s crepuscular activity pattern, comprising 25 % of registers, showed a higher activity between 06:00-08:00. A total of 33% of the records were obtained during the diurnal (08:00-18:00) activity pattern. In the diurnal percentage of records, the lowest activity levels were registered between 10:00 and 16:00 (Figure 3). These percentages for the number of records did not maintain the same proportions during the four-year study. However, the nocturnal activity pattern consistently produced the majority of records: 48 %, 31 %, 47 %, and 38%, respectively. For the diurnal activity pattern, percentages were 26%, 37 %, 27 %, and 43 %, and 26 %, 31 %, 27 % and 19 % for the crepuscular activity pattern.
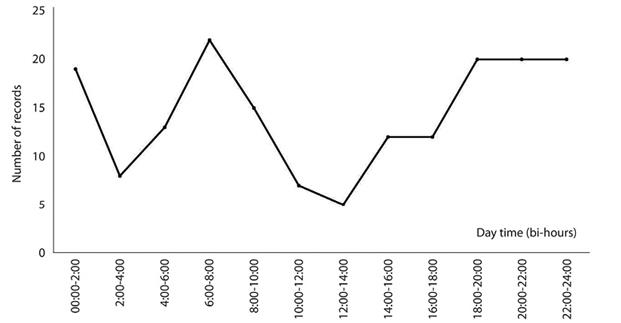
Figure 3: Cougar (Puma concolor) activity patterns at the el Eden Ecological Reserve, Quintana Roo, Mexico over a four-year study. Times of the day grouped in pairs.
Cougar-prey spatial association: Analyses of the associations between cougars and the 26 photographed species (potential prey and co-predators) determined that opossum (Didelphis sp.), armadillo (Dasypus novemcinctus), ocellated turkey (Meleagris ocellata), red brocket deer (Mazama temama), and collared peccary (Pecari tajacu) (Χ2 ˃ 3.84, α < 0.05) had significant associations with the cougar. In acahuals, changes were detected in some of the years. In 2008, associations with great curassow (Crax rubra), D. novemcinctus, and plan chachalaca (Ortalis vetula) were detected; in 2010, with spotted paca (Cuniculus paca), and in 2011 with P. tajacu. There were no significant associations in this vegetation type during 2012. Concerning MF, associations with striped hog-nosed skunk (Conepatus semistriatus), Didelphis sp., M. ocellata, M. temama and Nasua narica were detected in 2008, and no significant associations were detected in this vegetation type in 2010, 2011, and 2012.
In 2008, P. concolor was found to be spatially associated with birds such as C. rubra, O. vetula, and A. cajanea, and with mammals such as C. semistriatus, D. novemcinctus, M. temama and N. narica. In addition, the highest relative abundances of those species were registered (Figure 2), where as M. ocellata’s relative abundance was not the highest for the species. In 2010, species C. paca y T. tajacu showed significant associations with cougar. This year was one of the least abundant for both species as compared to the other studied years. Despite the higher relative abundance of those species in 2011 and 2012, no association with the cougar was found.
Cougar-prey species time association: The association between P. concolor and other species presented variations not only in spatial distribution, but also in time distribution. This overlapping was: C. rubra (∆ = 0.58), D. novemcinctus (∆ = 0.73), Didelphis sp. (∆ = 0.64), Leopardus pardalis (∆ = 0.687), M. ocellata (∆ = 0.55), M. temama (∆ = 0.66), Panthera onca (∆ = 0.87) and P. tajacu (∆ = 0.52). Higher values indicate higher use of time overlapping.
Effects of environmental and resource availability on cougar presence: The year’s effect was significant in each one of the 90 studied models. Those models, containing only environmental variables, were important to predict the cougar presence within the Reserve. However, model 10 obtained the lowest Akaike’s Information Criterion score (288.26; Table 2). Additionally, human activity exerts negative pressure on its presence. In 2010 and 2011, besides the aforementioned variables, the environmental variables played an important role in predicting P. concolor presence.
Table 2: Environmental variables that determine cougar presence in El Eden Ecological Reserve, Quintana Roo, Mexico (AIC, 288.26)
| Coefficient | Standard error | z | Pr >|z| | |
| (Intercept) | -6.47 | 0.19 | -32.58 | 0.00 |
| diurnal_human | 0.02 | 0.00 | 4.64 | 0.00 |
| diurnal_peccari | 0.69 | 0.15 | 4.41 | 0.00 |
| crepuscular_coati | 0.51 | 0.27 | 1.88 | 0.05 |
| crepuscular_ocellated turkey | -0.84 | 0.51 | -1.64 | 0.09 |
| diurnal_ocellated turkey | 0.47 | 0.14 | 3.22 | 0.00 |
| nocturnal_margay | -0.69 | 0.36 | -1.91 | 0.05 |
| diurnal_jaguar | -0.30 | 0.15 | -1.99 | 0.04 |
| nocturnal_jaguar | 0.56 | 0.11 | 4.94 | 0.00 |
| crepuscular_jaguar | 0.37 | 0.14 | 2.52 | 0.01 |
| crepuscular_ocelot | -0.66 | 0.27 | -2.39 | 0.01 |
| nocturnal_ocelot | 0.17 | 0.05 | 3.01 | 0.00 |
| diurnal_gray fox | -0.57 | 0.21 | -2.65 | 0.00 |
| crepuscular_gray fox | 0.27 | 0.15 | 1.77 | 0.07 |
| nocturnal_opossum | 0.40 | 0.14 | 2.90 | 0.00 |
| nocturnal_armadillo | -1.34 | 0.63 | -2.12 | 0.03 |
Discussion
The number of cougars identified during the four years was high, but the density in the study area varied from 1.85-5.17 (Ávila-Nájera, Chávez, Lazcano-Barreto, PérezElizalde, & Alcántara-Carbajal, 2015). This value resulted similar to other cougar distribution sites, for example, 1.9 in Venezuela, 2.44.9 in Belize, or less than others sites like 6.13 in Brazil, or 12.4-19.4 in Bolivia (Laundre & Hernández, 2010).
According to general analysis compilation of the habitat selection by pumas, the results showed that the habitat or variables selection depends of environmental conditions and may be contrasting and opposing if compared between different biomes (Laundre & Hernández, 2010). Cougars live in areas with presence of native protected forests, avoiding highly modified and accessible to man areas (De Angelo, 2009; Foster et al., 2010; Foster et al., 2014; Zarco-González & Monrroy-Vilchis, 2014). The results of this study suggested that cougars use vegetation and path type variables on an availability basis. Factors such as human, prey, and co-predator presence modify the use, which reflects reports by other studies (Monroy-Vilchis, Rodríguez-Soto, Zarco-González, & Urios, 2009; McLoughlin et al., 2010; Foster et al., 2014). Despite cougars may be found in all vegetation types in Mexico (Chávez, 2005), the species favors forests that provide them with dense plant cover (Lira & Naranjo, 2003; Chávez, 2010; Rodríguez-Soto et al., 2013).
The camera-traps were located on the dirt roads, firebreaks and trails already existing within the study area; the number of cameratraps by type of trail was in accordance with their availability. This was taken into account in the statistical analysis. In all the studied years except 2011, the cougar was observed using trails, firebreaks, and dirt roads proportionally to the availability of those features; in 2011, road use was higher than expected, which was associated with changes produced by that year’s fire, this path is associated to acahual. This effect may have been due to two factors. Firstly, although these man-made sites facilitated cougar movement, the closeness to the place where fires occurred, made the sites less favorable. In addition to environmental factors, we should consider the presence of co-predators, and the selection of most favorable environments by dominant species such as the jaguar (Harmsen, Foster, Silver, Ostro, & Doncaster, 2009; Romero-Muñoz, Maffe, Cuéllar, & Noss, 2010). Secondly, roads into the Reserve are not very much used by humans, which may explain why cougars use them, since cougar do avoid road stretches frequently used by humans (Dickson & Beier, 2002; RodríguezSoto et al., 2013), a trend that contrasts with their usage of paths providing tree cover (Lira & Naranjo, 2003).
Habitat use and resource selection may be affected by external factors. Within the Reserve, cougars favored the MF, but natural disruptions and interaction with co-predators, compelled the animals to use environments that may not have been the most productive or favorable for them, as was the case for the year 2011; this same behavior has been documented in other areas (Scognamillo, Maxit, Sunquist, & Polisar, 2003).
Environmental disruptions may determine how cougar use environmental variables in the study area, as was the case with the fire in the month of May, 2011, in the Lazaro Cardenas municipality; where the Reserve is located. A total of 2 750 ha adjacent to the Reserve perimeter were damaged, which had a considerable impact on animal mobility and, consequently, on the relative abundance of all the species evaluated in the Reserve. Besides, the fire is mentioned like one of the most important natural environmental factors influencing regional biodiversity (Cox, Moehr, & Larkin, 2006). During that fire and immediately afterwards, the animals changed their activity patterns and significantly decreased their abundance in places close to the fire, as resulted for other regions (Dees, Clark, & Van Manen, 2008). But the vegetation recovered quickly after fire; some species like peccaries and deer, could be attracted to burnt habitats because of the increased quality and/or quantity of forage (Dees et al., 2008).
Cougar presented a cathemeral activity pattern within the Reserve, and its activity peaks were associated with hunting (Chávez, 2005), as opposed to reports from different geographical areas, where the predator has been described as predominantly crepuscular (Chávez, 2005), and having activity peaks between 2:00 and 10:00 (Hernández-Saint Martin et al., 2013). Cougar activities in the Reserve were associated to the activities of their primary potential prey (armadillos, peccaries, and red brocket deer), their evasion strategy towards the jaguar (Gómez-Ortiz & Monroy-Vilchis, 2013; Hernández-Saint Martin et al., 2013; Ávila-Nájera, 2015), and the temporal and/or spatial avoidance of human activity (Sweanor, Logan, Bauer, Millsap, & Boyce, 2008). According to the assessed models, human activity exerts a negative influence on feline’s presence.This effect was marked in 2011, when park rangers, volunteers and firefighters were in the study area to fight the fire, while during the other years, the frequency of humans was reduced to the reserve staff. The negative effect was reported in others areas (Chávez, 2005; Foster et al., 2010; Rodríguez-Soto et al., 2013). The effect of the variables in the presence of pumas can be responses to different abiotic and biotic variables, so that negative values, in the case of the activity patterns of certain species or use of habitat variables, may be the result of complex ecological interactions.
In tropical forests in the North of the Yucatán Peninsula, cougars favor conservation areas where water resources are available through the year. Cougar presence in the study area was defined by the activity pattern of certain species that have been reported as important parts of the predator’s diet (Ávila-Nájera, 2015). Its home range depends on interactions with predators, and sympatric species. Studies have been carried out along its distribution and the factors that most affect the species is the destruction of habitat and fragmentation, as well as human-cougar-conflict (Laundre & Hernández, 2009). In conclusion, environmental variables that determine the presence of the cougar and modify its use of the environmental variables are the co-predators, potential prey and human. The RA can be high when the human is present however it modifies their activity patterns, being more nocturnal.

