


 English (pdf)
 Article in xml format
 Article references
 Send this article by e-mail
 Cited by SciELO
  Similars in
SciELO
Similars in
SciELO 
 Permalink
Introduction
Water is a renewable resource, but it depends on the dynamics of the hydrological cycle. While its total volume does not change, there are many variables that affect its availability for human activities, highlighting the limitations of using this resource (Soriano et al., 2016). Water security is the ability of a population to safeguard sustainable access to adequate amounts of water of acceptable quality to maintain livelihoods, human well-being, and socio-economic development to ensure protection against waterborne and water-related pollution disasters and preserve ecosystems in a climate of peace and political stability (United Nations, 2013).
The tremendous increase in water demand, accompanied by population expansion, rapid urbanization, and economic booms, has intensified the issue of water scarcity and is now jeopardizing food security, regional stability, and sustainable development in numerous areas (Li et al., 2019). The pressures of regional water use and supply will intensify with rapid socio-economic development. Meanwhile, the inefficient utilization and irrational allocation of water resources can generate a series of adverse effects on regional water security and sustainable socio-economic development (Liu et al., 2019). Clearly, the growth in water demand compared to supply constraints is leading to an untenable situation that needs not only water conservation, but also significant efforts in water redistribution (Blignaut & Heerden, 2009).
Ensuring water security for communities has been a global concern (Ghisi et al., 2006). In the case of Brazil, water availability has gradually declined in recent years. By the end of the twentieth century, the country reported a water potential of 5610 km3/year for a population of 157,070,163 inhabitants, which represented a water availability of 35,732 m3/inhabitant (Rebouças et al., 1999). Von Sperling (2006), using data from the World Resources Institute, reported a per capita water availability of 47,125 m3/inhabitant/year. The National Water Agency of Brazil (Agência Nacional de Águas, 2005) estimated a water availability of 33,376 m3/inhabitant, based on the information related to surface waters with an average flow of 179,433 m3/s and a population of approximately 170 million inhabitants. More recent information from the World Bank indicated a water availability of about 31,000 m3/inhabitants/year in Brazil for the year 2014, considering a population of 200 million inhabitants (World Bank, 2014). It is clear that population growth increasingly compromises water availability in Brazil. Additionally, changes in the hydrological cycle due to human influences, such as deforestation, changes in land use, and the effects of climate change, impact water availability (United Nations, 2013).
According to Chenoweth (2008), a range of estimates of per capita water requirements have been developed, ranging from 20 L/inhabitant/day through to 4,654 L/inhabitant/day (7.3 to 1,699 m3/inhabitant/year). However, when considering the components of a minimum water requirement estimate for human health, economic and social development, the author suggests that a country requires a minimum of 135 L/ inhabitant/day (49.3 m3/inhabitant/year).
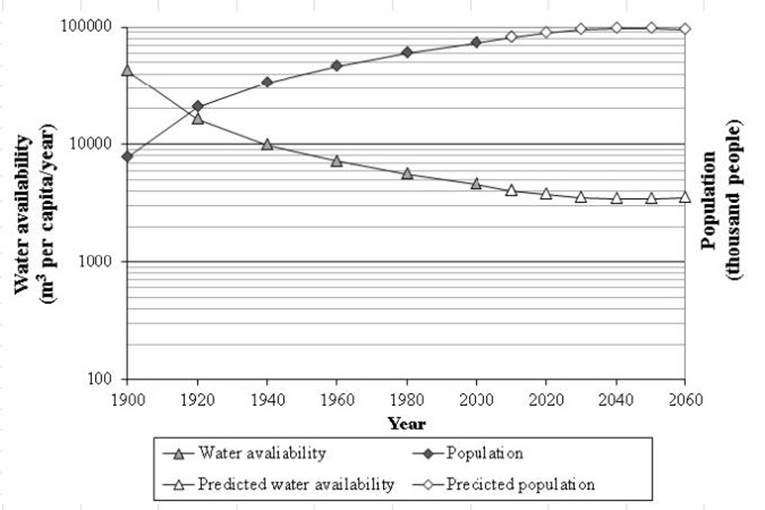
Adapted from IBGE (2020), IBGE (2021) and Ghisi (2006).
Figure 1 Population and water availability in the Southeast region of Brazil.
Figure 1 presents the demographic and water availability values in the Southeast region of Brazil, including the states of Minas Gerais, São Paulo, Espiritu Santo, and Rio de Janeiro, between 1900 and 2060. Although the projected water availability for 2060, i.e., 3541 m3/inhabitant/year, is not below the 2500 m3/inhabitant/year threshold established by UNESCO (WWAP, 2012) as a reference for water vulnerability, the graph depicts a decrease in availability in the states of the region. This decrease is primarily attributed to population growth, as registered and projected by the Brazilian Institute of Geography and Statistics.
In 2015, representatives of Brazilian government agencies declared that the southeastern region of the country faced the most severe water crisis since 1930 (Folha de São Paulo, 2015). The impacts of the water crisis have historically accumulated in the state of Minas Gerais. In 2014, the drought drastically affected the water supply in several municipalities in the southwestern region of the state, specifically in the area known as Zona da Mata Mineira (Zona da Mata-MG, 2014). In 2015 in the municipality of Viçosa, as a consequence of this crisis, the mayor’s office of the city issued a decree declaring a state of emergency, which imposed restrictions on water usage, rationing of the drinking water service and various contingency plans (Zona da Mata- MG, 2015). Although the droughts in the following years were not equally drastic, the situation of the municipality raised concerns among its population and representatives at the Municipal Council (Câmara Municipal de Viçosa, Estado de Minas Gerais, 2019). In the state of Minas Gerais the increase in water demand, associated with environmental and climatic issues, generated conflicts over water use in some cases. Evidence of this can be found in the 2020 Mineiro Institute of Water Management’s declaration of 67 conflict areas (Oliveira et al., 2020).
The motivations for seeking solutions and alternatives to reduce water stress are undoubtedly important because, despite being renewable, quality water resources are scarce (Moura et al., 2020). One alternative increasing the urban demand for drinking water is the use for both potable and non-potable purposes. In that sense, Goodwin et al. (2018) stated that the reuse of wastewater for non-potable purposes is less controversial than its reuse for drinking water. They also affirmed that the acceptability of reuse is associated with the degree of contact or exposure to water. For instance, high-exposure water usage, like in swimming pools, is likely to be less acceptable than the use in toilet flushing. In the absence of reuse alternatives to reduce the use of drinking water, the two main alternatives in water management can be grouped as follows: (i) improving efficiency in water use; and (ii) exploring alternative sources of water (Silva et al., 2015). Rainwater harvesting is one of the most promising alternative sources of water, as it can be easily collected and used for non-potable purposes without significant treatment.
Rainwater is an alternative water supply for domestic use in urban environments. Such use can constitute an anticipated response to the high demand on a water network resulting from urban growth. Additionally, it can help mitigate the effects of climate change in both developed and developing countries (Morales-Pinzón et al., 2015). Over the past few decades, rainwater harvesting systems development have been globally developed to address water scarcity. Since most domestic demand can be satisfied with low-quality water, rainwater can substitute higher-quality drinking water for both outdoor and indoor uses (Villar-Navascués et al., 2020). Rooftop rainwater harvesting involves collecting and storing water from rooftops. This practice can provide water supply in almost any place, either as a sole source or by reducing stress on other sources through water savings (Ojwang et al., 2017). Domestic rooftop rainwater harvesting systems, in particular, can support improved water resource allocation, providing relevant water-saving benefits at the household level (Campisano & Lupia, 2017).
According to Tomaz (2003), in Brazil, the consumption of water intended for non-potable residential uses, such as toilet flushing, laundries and washing machines, can constitute 40% of the total water consumed, which is comparable to the 38% reported by Silva et al. (2015) in a study conducted in single-family homes in Portugal. Alternative sources can replace this fraction of water to conserve drinking water and generate cost savings for consumers.
Determining the feasibility (potentiality) of implementing rainwater harvesting technology in a specific region requires a quantitative study. Within this context, this research aimed to evaluate the potential for saving drinking water through the use of rainwater as a source of supply for non-potable purposes in urban homes in two social housing neighborhoods in the municipality of Viçosa, Minas Gerais, Brazil. The study serves as a reference to analyze the potential for reducing drinking water consumption through the collection and use of rainwater for non-potable purposes in communities with single-family homes under similar conditions.
Methodology
The municipality of Viçosa, Minas Gerais, Brazil, is located in the mesoregion known as Mata Mineira Zone, in the Rio Doce watershed (Maria et al., 2014). The main watercourses in the area include the Turvo Sujo River and its sub-tributary, the São Bartolomeu stream, which cross the urban area and constitutes one of the main sources of water for the city’s population..
Since 1970 mainly, the urban growth relocated buildings that had previously occupied the bottom of the city’s valleys not only to the hills in the downtown area but also to those in the outskirts of the city. (Coelho, 2020).
As a result of the rapid urban growth of the city, the municipality of Viçosa defined locations to build housing for low-income families. In that sense, through investments, the Federal Government executed the programs called Minha Casa Minha Vida, aimed at families with incomes ranging between 0 and 3 minimum wages. These homes were built in lots near the Nova Viçosa neighborhood (Silva, 2014).
According to Barbosa & Caixeiro (2016), between 2011 and 2012 three housing complexes were constructed: the Benjamin José Cardoso complex, also known as “Coelhas 1”, which was constructed in September 2011 and has single-family houses built on lots of 10 m x 13 m; the Floresta housing complex, which is a vertical condominium, consisting of 80 housing units distributed among five four-story buildings with four apartments per floor; and the César Santana Filho or Sol Nascente complex, also known as “Coelhas 2,” located 500 m from the Benjamin José Cardoso complex, with single-family houses built on lots of 10 m x 15 m. Since this study focused on independent single-family housing units, it was conducted in the housing complexes Benjamin Jose Cardoso and Sol Nascente. The two housing complexes and other houses built with the Minha Casa Minha Vida program used a standard typology suggested by the Caixa Econômica Federal Brasilera (Borges, 2013). Each unit has two rooms, a living room, a kitchen, and a bathroom, with a total area of 40.34 m2; the houses have ceramic tile supported in metal structure as covering material.
According to Alves (2009), the distribution of people per bedroom in the urban region of Nova Viçosa, where Coelhas 1 and Coelhas 2 complexes are located, is as follows: 67.10% with 1 or 2 people, 24.83% with 3 people, 4.72% with 4 people, and 3.35% with 5 or more people. Based on the above and considering that the houses have two rooms, the average number of occupants per household is 5 people.
The monthly consumption statistics for the year 2020, as reported by the Serviço Autônomo de Água e Esgoto-SAAE (Directorate of Engineering and Maintenance of the Autonomous Water and Wastewater Service) of Viçosa were used for every household in the Benjamin Jose Cardoso (Coelhas 1) and Sol Nascente (Coelhas 2) Housing Complexes. In the analysis of the data, household consumption values exceeding 30 m3 per month were excluded because they indicated possible pipe breakage or issues in hydraulic or sanitary devices like toilets.
To estimate the proportion of drinking water used for non-potable purposes in homes, this study adopted the 40% reported by Tomaz (2013) and Neves-Filho et al. (2019).
The analysis of monthly rainfall for the city of Viçosa used historical information available in the Meteorological Data Bank (BDMEP) offered by the National Institute of Meteorology (INMET), belonging to the Ministry of Agriculture, Livestock and Supply of the Brazilian government. Specifically, the rainfall data for Viçosa was obtained from the Viçosa (A510) station, located at 20.76° South Latitude and 42.86° West Longitude, which operates at an altitude of 712.20 meters above sea level. The analyzed data corresponded to the historical series of monthly rainfall spanning from January 1, 1970 to December 31, 2020. The data series are available at https:// tempo.inmet.gov.br/page
With the information corresponding to the 50 years of monthly rainfall records, the values of the average monthly multi-sheet rainfall, the minimum and maximum values and the average of the typical rainfall deviations for each month of the year were determined.
To determine the monthly amount of precipitation that could be captured, the expression proposed by Ghisi & Oliveira (2007) was used, with adaptations as described in Equation 1:

 (1)
(1)
Where: MVRH: Monthly volume of rainwater that could be harvested in each house (m3/ month/house) MR: Monthly average rainfall (mm/day = L/m2 per day) TRA: Total roof area of each house (m2) Rc: Runoff coefficient (non-dimensional) 1000: Conversion factor, from L to m3
The following are some of the values used in the literature for the runoff coefficient in tile roofs made of ceramic material:
0.75 (Kumar, 2004), 0.80 (Ghisi et al., 2006; Silva et al., 2015; Ghisi & Oliveira, 2007), and 0.87 (Silveira et al., 2016). Additionally, in several studies conducted on rainwater collection and use for single-family homes (Neves-Filho et al., 2019), public schools (Andrade-Lima et al., 2017), and vertical buildings (Santos-Martins et al., 2021), runoff coefficient in the order of 0.8 has been used. In this study, a conservative value of Rc = 0.80 was chosen to account for the discarding of an initial volume of the “first flush” runoff that eliminates high concentrations of pollutants from the first millimeters of rain that flows across the roof surface, carrying these pollutants.
The potential to substitute drinking water monthly destined for non-potable uses by rainwater was calculated employing the Equation 2:
MVRH
PSDWNPA=100*
 (2)
(2)
DWMCNPU
Where:
PSDWNPA: Potential substitution of drinking water used for non-potable applications (%)
MVRV: Monthly volume of rainwater harvested in each house (m3/month per house)
DWMCNPU: Drinking water monthly consumption for non-potable uses (m3/month per house)
Potential for saving drinking water
The potential to save drinking water monthly was calculated based on the Equation 3:
PWS=100* MVRH (3)
DWMA
Where:
PWS: Potential water saving (%)
MVRV: Monthly volume of rainwater har-vested in each house (m3/month per house)
DWMCA: Drinking water monthly average consumption (m3/month per house)
Analysis and Results
Consumption of drinking water in homes The drinking water consumption values for 2020 provided by the SAAE of Viçosa corresponded to 268 family units for both social housing complexes.
Figure 2 presents the monthly varia-tion of drinking water consumption corre-sponding to the 137 dwellings of the Coel-has 1 Housing Complex.
There was a high variability in con-sumption values in homes, with the highest average consumption and standard devi-ation in the month of August (8.02 ± 6.39 m3/month); on the other hand, the month of October registered the lowest average con-sumption (5.51 ± 4.32 m3/month).
Figure 3 reports the monthly variation of drinking water consumption correspond-ing to the 131 dwellings of the Coelhas 2 Housing Complex.
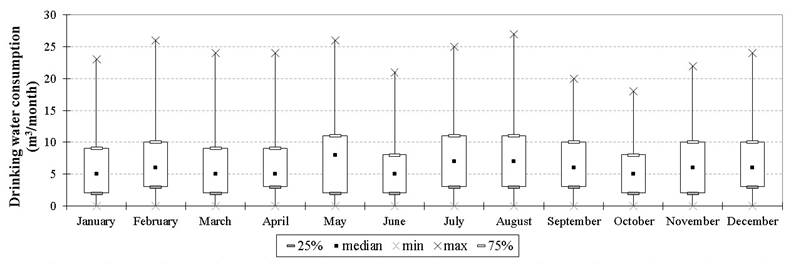
Note: data derived from research
Figure 2 Monthly variations of drinking water consumption in the Benjamin José Cardoso Housing Complex.

Note: data derived from research.
Figure 3 Monthly variations of drinking water consumption in the Sol Nascente Housing Complex.
Similar to the consumption values re-corded in the Coelhas 1 Complex homes, a high variability was observed in the dif-ferent households, with the highest average consumption occurring in May (6.98 ± 6.40 m3/month). Conversely, the lowest aver-age consumption was registered in October (4.87 ± 5.38 m3/month).
Considering that approximately 40% of the monthly drinking water consump-tion of in homes is intended for non-po-table purposes, Table 1 lists the estimated volumes of such consumption for the two housing complexes.
The average volumes of drinking wa-ter used for non-potable purposes were 2.64 m3/month for the Benjamin Jose Cardoso Housing Complex and 2.49 m3/month for the Sol Nascente Housing Complex.
Based on the rainfall data provided by INMET through the BDMEP, Table 2 presents the minimum, maximum, and stan-dard deviation of multi-year monthly values calculated for the rains recorded between 1970 and 2020, with the exception of the period between 1984 and 1990 since such information is not available.
The months ewith no recorded rain-fall were as follows: June 2003; July 1980, 1981, 1996, 2010, 2011, and 2016; August 1991, 1995, 1999, and 2007; and September 1994 and 2004. On the other hand, the max-imum monthly rainfall within the studied period occurred in the months of November 2014 and December 2008.
Figure 4 illustrates the average rain-fall, with its respecting numerical values, and the standard deviations calculated for the city of Viçosa in the study period.
The graph clearly shows the three most critical months of each year, when droughts have occurred, severely impacting the state of Minas Gerais, particularly the municipalities of the Mata Mineira area, in-cluding the municipality under study.
Table 1 Monthly volume of drinking for non-potable purposes (m3/month)
| Month / Housing complex | January | February | March | April | May | June |
| Coelhas 1 | 2.43 | 2.62 | 2.47 | 2.55 | 3.01 | 2.17 |
| Coelhas 2 | 2.54 | 2.69 | 2.50 | 2.56 | 2.87 | 2.09 |
| Month / Housing complex | July | August | September | October | November | December |
| Coelhas 1 | 3.09 | 3.21 | 2.79 | 2.20 | 2.58 | 2.54 |
| Coelhas 2 | 2.56 | 2.78 | 2.43 | 2.04 | 2.13 | 2.66 |
Note: data derived from research
Table 2 Multi-year monthly rainfall data on the city of Viçosa
| Month/Value | January | February | March | April | May | June |
| Minimum | 30.4 | 15.7 | 3.8 | 1.8 | 2.0 | 0.0 |
| Maximum | 496.8 | 416.8 | 353.2 | 138.2 | 146.8 | 58.8 |
| Standard deviation | 123.2 | 91.8 | 83.5 | 34.0 | 30.6 | 16.3 |
| Month/Value | July | August | September | October | November | December |
| Minimum | 0.0 | 0.0 | 0.0 | 25.9 | 62.2 | 2.6 |
| Maximum | 94.4 | 85.4 | 147.4 | 263.9 | 605.7 | 605.7 |
| Standard deviation | 19.9 | 19.2 | 38.0 | 58.1 | 103.2 | 98.8 |
Note: data derived from research
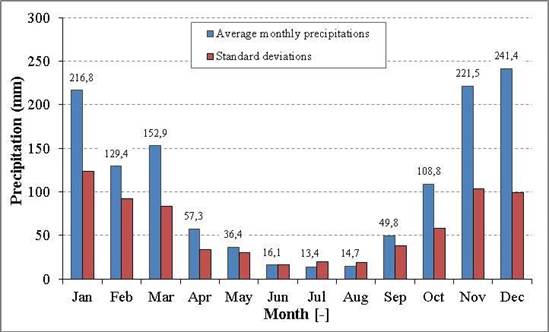
Note: data derived from research
Figure 4 Average values and standard deviation of multi-year monthly rainfall for Viçosa MG.
Table 3 Monthly volume of rainwater that can be captured per household
| Month | January | February | March | April | May | June |
| Harvested volume (m^{3} ) | 7.00 | 4.18 | 4.94 | 1.85 | 1.18 | 0.52 |
| Month | July | August | September | October | November | December |
| Harvested volume (m^{3} ) | 0.43 | 0.47 | 1.61 | 3.52 | 7.15 | 7.80 |
Note: data derived from research.
Considering the horizontal projection of the roof area available for rainwater har-vesting (40.34 m2), the volumes to be captured calculated with Equation 1 from the multi-year monthly average rainfall are presented in Table 3.
The average monthly volume of rain-water that could be captured through the roof area of each dwelling is 3.39 m3.
Table 4 Percentage of monthly consumption of drinking water for non-potable purposes that can be replaced by rainwater
| Month / Housing complex | January | February | March | April | May | June |
| Coelhas 1 | 288.6 | 159.6 | 199.7 | 72.5 | 39.0 | 23.9 |
| Coelhas 2 | 275.4 | 155.6 | 197.9 | 72.4 | 40.9 | 24.9 |
| Month / Housing complex | July | August | September | October | November | December |
| Coelhas 1 | 14.1 | 14.8 | 57.6 | 159.5 | 276.9 | 307.3 |
| Coelhas 2 | 16.9 | 17.0 | 66.2 | 172.4 | 336.5 | 292.6 |
Note: data derived from research.
Note: data derived from research
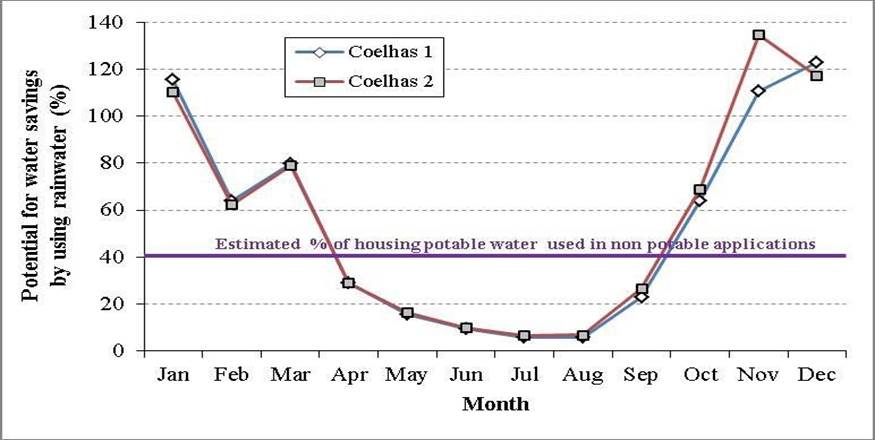
Figure 5 Monthly percentage of potential savings of drinking water for the Coelhas 1 and 2 housing complexes.
the usual available sources (Azizul, 2017). According to Avis & Avis (2019), harvest-ed rainwater storage is used to carry over any net surplus or compensate for water deficits. Therefore, the sizing of a rainwater reservoir that exceeds the monthly liquid needs for these purposes would enable the surplus water collected to supply the short-fall between April and September. In some cases, the daily demand for non-potable water could be met by utilizing either the harvested rainwater from the storage tank or a backup water supply, or a combination of both if necessary (McCarton et al., 2021).
Figure 5 illustrates the calculated percentages of the potential for monthly savings of domestic drinking water for the two housing complexes.
It is evident that during the first three and last months of the year it would be feasible to save a higher percentage of water than that destined for non-potable purposes, with an overall average value of 53.8% for Coelhas 1, ranging between 5.6 and 122.9%; and an average of 55.6% for Coel-has 2, ranging between 6.8 and 134.6%.
Our values exceed the range of 17.0 to 25.3% reported by Macena et al. (2020) for single-family houses and multi-family buildings in Campina Grande, Paraíba, a region with a semiarid climate in Northeast Brazil. They also exceeded the average values of 44.9% reported by Gonçalves et al. (2011) for single-family homes in Irati, Paraná, in the southern region of Brazil. They were similar to the 57% reported by Marcelino & Cauduro (2021) for a single-family house in Içara, Santa Catarina, in the southern region of Brazil. In comparison to results obtained in other similar investigations conducted for the Brazilian Southeast region, the average values calculated in this study exceeded the range of 35.5 and 33.6% reported by Ghisi & Oliveira (2007) for two types of single-family homes in the city of Palhoça, state of Santa Catarina. Additionally, the values exceeded the average of 39.4% reported by Sánchez et al. (2009) for the residential sector of Piracicaba, São José dos Campos, Sorocaba, and Ribeirão Preto, which are intermediate cities in the state of São Paulo. However, this value was lower than the overall average of 69% reported by Ghisi et al. (2006) for 62 cities in the state of Santa Catarina, because the average catchment area for this research was 81.84 m2, which represents slightly more than double the area available in the homes in this study.
Since the average percentage of general drinking water savings for both neighborhoods exceeded 53% to meet water needs for toilet flushing, irrigation of gardens, laundry rooms, and washing machines, achieving a 40% saving in monthly consumption can significantly contribute to reducing the payment for the drinking water service. The reduction in monthly payments for the 268 homes of Coelhas 1 and 2 housing complexes is not the only benefit. The 6.60 m3 average monthly consumption of the 137 homes of the Benjamin Jose Cardoso Housing Complex and the 6.22 m3 of the 131 homes of the Sol Nascente Housing Complex, respectively, represent a significant reduction in the monthly consumption of drinking water in Viçosa by 1,719 m3, which is particularly beneficial for this municipality, especially during drought months. If government programs were implemented to promote potable water savings through rainwater harvesting and usage, this could lead to significant potable water savings and preservation of water resources in the city of Viçosa.
It is recommended to conduct specific studies to determine the costs of implementing rainwater harvesting systems for non-potable purposes and the period of return on investment for the investigated construction type. Likewise, it is advisable to evaluate alternatives for government support at the federal, state, or municipal level that favor their execution in housing settlements of social interest. Studies in the Brazilian context have documented several periods of return on investments associated with rainwater collection and use for non-potable purposes; the following are examples of these periods: 12.6 years for single-family residences of medium socioeconomic stratum in Palmas-Tocantins (Batista, 2019), between 1 and 9 years for homes in different cities and regions of Brazil (Leite et al., 2022), over 14 years for small constructions in Marau-Rio Grande do Sul (Katagiri et al., 2019), and 6.07 years for application in public schools in Recife-Pernambuco (Andrade-Lima et al., 2017).
Conclusions
The potential for saving drinking water through the harvesting and use of rainwater in the housing complexes of social interest Benjamin Jose Cardoso and Sol Nascente de Viçosa was demonstrated.
The average monthly savings in drinking water were 53.8% at the Coelhas 1 housing complex and 55.6% for the Coelhas 2 housing complex, depending on the monthly average rainfall values.
These values indicate that the volume of rainwater collected can cover more than 40% of non-potable consumption water such as garden irrigation, toilet flushing, car washes, and floor cleaning.
The implemented methodology for this study is useful for estimating potential savings in water supply consumption in communities with various types of urban and rural conditions, especially in regions facing increasingly critical water stress.
Acknowledgments
The authors would like to thank the Serviço Autônomo de Água e Esgoto (SAAE) of Viçosa for the values of drinking water consumption in the housing complexes of social interest.

