


 English (pdf)
 Article in xml format
 Article references
 Send this article by e-mail
 Cited by SciELO
  Similars in
SciELO
Similars in
SciELO  uBio
uBio 
 Permalink
Introduction
The presence of microplastics (particles of sizes below 5 mm) in marine ecosystems and even in organisms, has been recognized for years as a global environmental problem (MSFD-TSGML, 2013). This problem is particularly serious in the ocean, where large amounts of microplastics accumulate and persist for a long time (Thompson et al., 2004; Van Cauwenberghe et al., 2015). Microplastics threaten marine ecosystems mainly due to their inclusion in marine food webs through ingestion (Wesch et al., 2016; Wright et al., 2013), causing a negative impact on different organisms. These impacts are both physical, due to the accumulation of plastics inside organisms (Cannon et al., 2016; Desforges et al., 2015; Fossi et al., 2014; Nadal et al., 2016; Ogonowski et al., 2016; Strungaru et al., 2019; Von Moos et al., 2012) and chemical, produced by the toxicity of plastic additives and contaminants that are adsorbed (Fossi et al., 2014; Li et al., 2016; Lu et al., 2018; Rochman et al., 2013; Setälä et al., 2014). Although microplastics are ubiquitous in the water column and sediments across a wide bathymetric range, including deep water (Faraday, 2019), these problems are more acute along populated coastlines (Cole et al., 2011), where microplastics are more abundant. In these areas, the accumulation of microplastics is influenced by their own physical characteristics, such as size and density, but also by external environmental factors, such as rainfall, hydrological changes, tidal zones, and even stochastic storm (Lusher, 2015).
The general risk of microplastic contamination along seacoasts is increased by the proximity of land-based sources of contamination (Mathallon & Hill, 2014), which include infrastructures linked to the port industry, touristic development, and coastal urbanization. In Latin America, the problem is exacerbated by the high population density in the coastal areas combined with a poor waste management and lack of wastewater treatment in many regions (Derraik, 2002; Kutralam-Muniasamy et al., 2020). In this sense, urban beaches are environments that are especially susceptible to this type of pollution. On one hand, beaches are in fact, depositional environments that naturally accumulate particles carried by surrounding areas, including microplastics (Acosta-Coley & Olivero-Verbel, 2015). In Latin America, urban beaches are not only exploited as mass tourist destinations but are also highly urbanized and subject to heavy industrial activities, such as ports or fisheries, making them particularly vulnerable (Wright et al., 1979; Wright & Short ,1984). Therefore, the impact of microplastics pollution on urban beaches often acts synergically with other human-driven impacts, such as erosion and trampling, collectively affecting local conditions, leading to changes in the composition and variation of the structure of the benthic communities and, in particular the interstitial meiofauna (Gheskiere et al., 2005; Martínez et al., 2020; Rangel-Buitrago et al., 2015).
Interstitial meiofauna is an important component of the biodiversity on marine sand beaches, due to its high taxonomic richness and abundance. Unfortunately, meiofaunal animals are often neglected in biodiversity studies, as their characterization requires specialized sampling techniques and taxonomic expertise (Curini-Galletti et al., 2012; Martínez et al., 2019). This neglect is problematic not only because it produces biased information about actual biodiversity in many regions, but also an incomplete view of ecosystem functioning. Meiofaunal organisms provide important services in marine ecosystems, such as the transfer of energy from microbial production to higher trophic levels, thus catalysing many geochemical processes in coastal environments (Giere, 2009). Meiofaunal assemblages comprise almost all animal phyla, responding differentially to specific physical-chemical environmental factors and often showing a faster response to changes (Zeppilli et al., 2015). Therefore, studying the abundance and composition of meiofaunal communities remains as a valuable tool for environmental assessments, since they allow a rapid detection of different types of impacts at different temporal and spatial scales (Alexeev & Galtsova, 2012; Alves et al., 2015). Surprisingly, although experimental work has shown that meiofauna are affected by microplastics in different marine habitats (Fueser et al., 2019; Fueser et al., 2020; Mueller et al., 2020; Wakaff et al., 2020), few studies have focused on the specific impact of microplastics on the interstitial meiofaunal communities in natural environments. Large accumulations of microplastics in the marine sediment affects its structure, and therefore (Carson et al., 2011) could also affect the meiofauna.
Our case of study relies on several qualitative surveys done over the last ten years around the coastal areas of Santa Marta, in which different beaches have been sampled to describe the diversity of organisms. These studies collectively forecasted the richness of the meiofaunal communities in the sandy beaches of Santa Marta region (Castro et al., 2021; González-Cueto et al., 2014; Lagos et al., 2018; Lagos, 2018; Sevilla-Hernández, 2016), and highlighted the presence of microfibers and debris. The co-occurrence of meiofauna and microplastics raises the question on whether the accumulation of microplastics in the sediments might affect the abundance and composition of the meiofaunal communities inhabiting those beaches (Carson et al., 2011).
The main goal of this study is to investigate the distribution of microplastics, in the three main urban sandy beaches of the Santa Marta region (Colombia), all with similar impacts in terms of tourism, population, and wastewater discharge. Our main hypothesis is that, since microplastics are deposit in the sediment modifying its structure, they might have an effect on the abundance and composition of the interstitial meiofaunal communities on these beaches.
Materials and methods
Area of study: This study was focused on the only three beaches accessible in a radius of 10 km from Santa Marta, Northern Colombia, which exhibit a comparable sedimentary regime and are affected by similar human-driven impacts, such as erosion and trampling, allowing us to isolate the changes produced only by the local variation of debris in the sediment (Gheskiere et al., 2005; Martínez et al., 2020; Rangel-Buitrago et al., 2015). These urban sandy beaches in Santa Marta are: El Rodadero, Santa Marta Bay, and Taganga (Fig. 1). All of them are pocket reflective beaches with sparse swell, and narrow tide range, composed of coarse to medium-fine sand eroded from adjacent foothills of the Sierra Nevada de Santa Marta (Correa & Morton, 2010; García et al., 2011; Rangel-Buitrago et al., 2019; Rubio-Polanía & Trujillo-Arcila, 2013). They are all subjected to strong tourism, population, and fishermen pressure (Botero & Zienliski, 2020). The three investigated beaches are similar to each other, while they differ from other sandy beaches in the region.

Sampling: Sampling was performed in April 2019. Three sites were selected along each beach. Three spots were sampled in each site, corresponding to the lower, mid and upper level of the intertidal zone. Three adjacent samples were collected in each spot: one for microplastics quantification, another for the meiofaunal community characterization, and a third for granulometric analysis. A total of 81 samples were studied, 27 for each beach. Samples for microplastics and meiofauna were collected using a 10-cm-high steel corer with 3.5 cm of inner diameter (Buchanan, 1984; Piperagkas et al., 2019). Granulometric samples were collected using a steel shovel.
Sample processing: Debris were extracted using the flotation method adapted from Thompson et al. (2004). Each sample was deposited in a 1 l glass conical flask, gauged with a supersaturated saline solution (1.2 kg/l), and stirred during 3 min at 200 rpm. After allowing the mixture to settle for 10 min, the supernatant was vacuum filtered through a membrane filter (MCE). This process was repeated four times for each sample. All particles were separated from the filter and visually categorized using a DIC microscope (Hidalgo-Ruz et al., 2012). To avoid contamination, we minimized the exposure of each sample, which remained sealed during most of the processing. All containers and beakers were rinsed with distilled water prior and after being used, and reagents were prepared with molecular graded milli-q water and periodically tested to confirm they were plastic-free.
Samples for meiofauna were anesthetized for 10 minutes in an isotonic 7.4 % magnesium chloride solution, fixed using a 4 % solution of buffered formalin, and dyed with Rose Bengal to facilitate the counting. Fixed samples were rinsed over a two-sieve stack of 500 and 45 µm. The fraction retained by the 45 µm sieve was mixed with LUDOX-TM solution (specific density 1.15 g/cm3), successively centrifuge, and decanted four times to extract all the meiofaunal organisms (De Jonge & Bouwman, 1977), which were then identified and counted under a Leica WILD M8 stereomicroscope.
Granulometry was evaluated from 300 g of sediment, previously homogenized and dried in an oven at 80 °C for 24 hours. The sediment was sieved through a standard stack of six sieves, and after 15 min, the fraction retained in each sieve was weighted. Mean grain size and sorting coefficient were calculated with the software Gradistat (Bezerra et al., 1997; Folk & Ward, 1957). The results were expressed using the Wentworth fi coefficients for the mean grain size (Giere, 2009).
Statistical analyses: Our first goal was to understand the variation of microplastics and meiofauna in our samples, accounting for the effect across beaches, as well as for the different intertidal levels and granulometry within each beach. We expect that comparable amounts of microplastics will arrive to each beach, as well as a homogeneous deposition in the sediment across the intertidal zone favoured by the small tidal amplitude in the Santa Marta region. We tested this hypothesis in two steps. First, we assessed whether the homogeneous distribution of marine microplastics and meiofauna across beaches held true using an analysis of variance (ANOVA); and then, we tested the effect of the granulometry and tidal level at each beach on the meiofauna and microplastics abundances using generalized linear models (GLM). Abundance of microplastics and meiofauna were selected as response variable for those models, while we considered the intertidal levels (categorical: upper, mid, lower) and the two continuous granulometric parameters (mean grain size, sorting coefficient) as response variables. The abundance of microplastics was included as an additional explanatory variable when the total abundance of meiofauna was the response variable. Beaches were included explicitly in each model to account for unmeasured differences between them. Beaches were not included as a random effect due to the low number of replicates. A negative binomial distribution was assumed for each model to account for the over dispersion of our response variable consisting of counting data.
Our second goal was to explicitly investigate the effect of the abundance of microplastics at each intertidal level on the meiofaunal abundances. Meiofauna and microplastics occur together in the spaces amongst the sand, potentially competing for the same space. Therefore, we expect a reduction, yet small, of the meiofaunal abundances in those samples with a higher amount of microplastics. We expect this reduction to be stronger in the mid and lower levels, where meiofauna achieved the highest abundances thereby increasing competition for the space. We used again generalized linear models to test this hypothesis, selecting the abundances of meiofauna at each tidal zone as the response variable. Total abundance of microplastics and the two granulometric continuous variables (mean grain size, sorting) in each intertidal level were selected as explanatory variables. As above, beaches were included as an additional explicit factor; and a negative binomial distribution was included to account for the over dispersion of the counting data.
Before performing these two sets of analyses, we checked whether the explanatory variables were not correlated. After obtaining the results, we checked the model fit by visually confirming the normal distribution of the residuals, the absence of deviation in the residual versus fitted plot, Q-Q plot, and plot of Cook's distances. The results are presented in Analyses of Deviance Tables, as they show the effect of each variable, calculating the significance using likelihood ratio (LR) chi-square tests for GLMs and Wald (W) chi-square tests for GLMs. All analyses were run using (R Core Team, 2016).
Finally, if the accumulation of microplastics affects the structure of the sediment (Carson et al., 2011), we expect this to favour certain meiofaunal groups, affecting the overall meiofaunal community composition in terms of presence and abundance of each taxon, particularly in the mid and lower zones-where competition is expected to be stronger. We tested these potential differences in species composition using a permutational multivariate test (Permanova). A pairwise distance community matrix calculated with a Bray-Curtis index at each intertidal level was selected as a response variable against the same explanatory variables that were included in the previous models. A Bray-Curtis index was selected as it is a widely used index that accounts for the abundances of each taxon in the samples (Somerfield, 2008). The analysis was run using the function Adonis included R package vegan v. 2.5.2 (Oksanen et al., 2018).
Results
Microplastic abundance and visual characterization: We counted a total of 1 131 microplastics on the three beaches. Fibres were the most abundant (94.8 %), followed by foam (2.9 %), films (1.2 %), and fragments (1.1 %) (Fig. 2). The smallest observed microplastic was 0.15 mm in length. The most predominant colours were blue (39,1 %), black (28.6 %), transparent (11.7 %), and red (9.1 %), (Fig. 2). The largest amount of microplastics was recorded in the Santa Marta Bay (46.7 pieces/10 cm2) at the lower intertidal levels (45.9 pieces/10 cm2) (Table 1). However, the differences in the abundance of microsplastics were not significant between beaches (ANOVA, P = 0.421) or within tidal levels in the same beaches (Table 2).
Table 1 Average and standard deviations of the abundances of microplastics and meiofauna in each beach and intertidal levels.
| Beach | Intertidal level | Sediment description | Average abundance of microplastics (Items/10 cm2) | Average abundance of meiofauna (Individuals/10 cm2) | Total abundance of meiofauna |
| Bahía de Santa Marta | Upper | Medium Sand | 27.3 ± 7.5 | 1 026.3 ± 470.4 | 3 079 |
| Mid | Coarse Sand | 41.0 ± 13.1 | 2 569.7 ± 1 298.8 | 7 709 | |
| Lower | Coarse Sand | 37.7 ± 12.0 | 567.3 ± 871.0 | 1 702 | |
| Rodadero | Upper | Fine Sand | 45.3 ± 22.5 | 1 860.7 ± 388.4 | 7 690 |
| Mid | Fine Sand | 36.0 ± 6.2 | 3 186.3 ± 2 289.0 | 12 019 | |
| Lower | Medium Sand | 58.7 ± 19.7 | 871.7 ± 725.0 | 3 442 | |
| Taganga | Upper | Fine Sand | 42.3 ± 34.4 | 1 361.0 ± 343.0 | 4 083 |
| Mid | Coarse Sand | 47.3 ± 19.9 | 501.0 ± 184.5 | 1 503 | |
| Lower | Coarse Sand | 41.3 ± 26.3 | 575.3 ± 347.1 | 1 726 |
Table 2 Effect of the abundance of microplastics, together with the confounding factor of the granulometry and beach, on the abundance of meiofauna at the different beach intertidal levels, according to a type II ANOVA output for generalized linear models.
| LR Chisq | Estimate ± s.e. | d.f. | P | ||
| Total | Abundance of debris | 5.087 | -0.013 ± 0.006 | 1 | 0.024 |
| Mean grain size | 20.553 | 0.824 ± 0.172 | 1 | < 0.001 | |
| Sediment sorting | 4.265 | 1.143 ± 0.499 | 1 | 0.039 | |
| Intertidal level | 11.990 | NA | 2 | < 0.01 | |
| Beach | 1.912 | NA | 2 | 0.385 | |
| Upper level | Abundance of microplastics | 1.984 | 0.008 ± 0.005 | 1 | 0.159 |
| Mean grain size | 5.397 | 0.962 ± 0.412 | 1 | 0.021 | |
| Sediment sorting | 1.583 | 1.279 ± 1.011 | 1 | 0.208 | |
| Beach | 14.680 | NA | 2 | < 0.001 | |
| Midlevel | Abundance of microplastics | 0.003 | -0.013 ± 0.018 | 1 | 0.9559 |
| Mean grain size | 0.203 | 1.626 ± 0.855 | 1 | 0.6521 | |
| Sediment sorting | 0.901 | -1.857 ± 1.793 | 1 | 0.3425 | |
| Beach | 30.385 | NA | 2 | < 0.001 | |
| Lower level | Abundance of microplastics | 82.43 | -0.029 ± 0.003 | 1 | < 0.001 |
| Mean grain size | 121.66 | 0.905 ± 0.081 | 1 | < 0.001 | |
| Sediment sorting | 32.37 | 1.647 ± 0.282 | 1 | < 0.001 | |
| Beach | 75.63 | NA | 2 | < 0.001 |
Abbreviations: LR Chisq, likelihood ratio chi-square values; d.f., degree of freedom; P, chi-square goodness to fit, s.e., standard error.
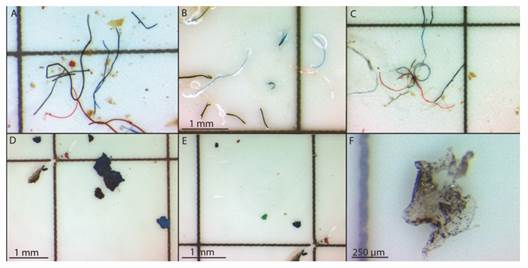
Fig. 2 Types of microplastics particles found in the intertidal zone: A-C. Fibers. D. Foam. E. Fragments. F. Film.
Characterization of the meiofauna and the effect of microplastics. A total of 17 taxa was found in the samples, being Nematoda, Gastrotricha, Platyhelminthes, and Copepoda the most abundant groups. It is important to note that microplastics fibres were occasionally observed in the intestine of larger meiofaunal specimens (Fig. 3M, Fig. 3N). A list of the species recorded so far for the beaches in the Santa Marta region is summarized in Appendix 1. The highest meiofaunal abundances were counted in El Rodadero (2 151.8 ind/10 cm2), although there are not significant differences with the other beaches (ANOVA, P-value = 0.138). However, as expected, the abundance of meiofauna was significantly affected by intertidal levels and the granulometric composition, with the highest abundances registered in the mid intertidal level (2 085.7 items/10 cm2) (Table 1, Table 2), and towards medium and fine sediments (Fig. 4, Table 2).
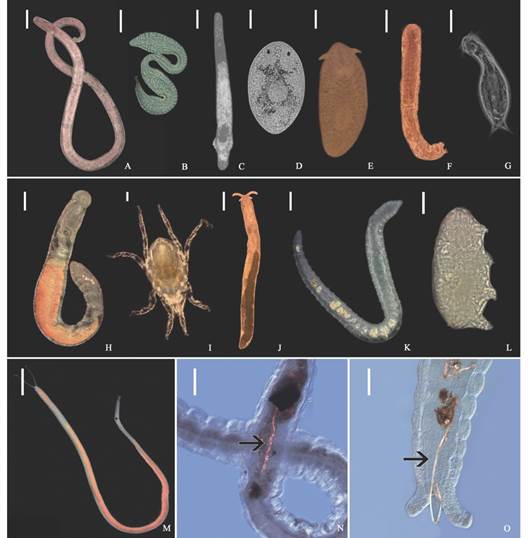
Fig. 3 Meiofauna diversity shown by examples from a variety of higher taxa. A. Nematoda, Enoplida; B. Nematoda, Epsilonematidae; C. Platyhelminthes, Proseriata; D. Platyhelminthes, Dalyelliidae; E. Platyhelminthes, Polycladida; F. Gastrotricha, Macrodasyidae; G. Gastrotricha, Chaetonotida; H. Annelida, Sedentaria,Ctenodrilussp.; I. Arthropoda, Chelicerata, Acari; J. Mollusca, Gastropoda,Microhedylesp; K. Annelida, Clitellata, Olygochaeta, L. Tardigrada, Heterotardigrada, Echiniscoididae; M. Annelida, Sedentaria, Saccocirrus cf. pussicus; N.-O. Saccocirrus cf. pussicus collected from the Santa Marta region that exhibit microfibers inside their gut. Scales in A., E., H., J., K., M. 200 µm; in C., D., N., O. 100 µm; and in B., F., G., I., L., 50 µm.
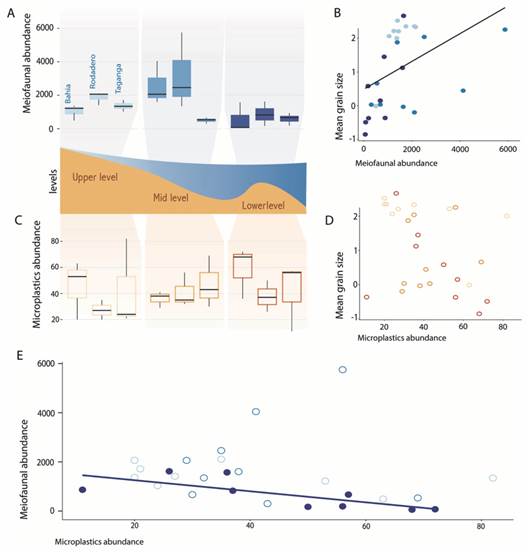
Fig. 4 Graphical summary of the regression analyses. A. Boxplot showing the meiofaunal abundances in each beach and intertidal levels. B. Relationship between the meiofaunal abundances and the mean grain size, represented as fi-coefficient (-1 = very coarse sand, 2 = fine sand). C. Boxplot showing the abundance of microplastics in each beach and intertidal levels. D. Relationship between the abundance of microplastics and mean grain size expressed as fi-coefficient. E. Relationship between the abundance of meiofauna and abundance of microplastics. Plots represented with filled colour are significant.
We found a marginally significant, negative relationship between the abundance of meiofauna and microplastics, although with a small estimate (GLM, estimate = -0.012, P = 0.044). When we isolated this effect in the different intertidal levels, this relationship was only retained at the lower intertidal level (GLM, estimate = -0.03, P < 0.001) (Fig. 4, Table 2).
The effect of microplastics was more conspicuous when the community species composition was analysed, significantly explaining the 39.3 % of the variation of the samples collected at the lower intertidal level (PERMANOVA, R2 = 39.3 %, P < 0.01). Other significant predictors for the community composition were the intertidal level of the overall meiofauna (PERMANOVA, R2 = 16.5 %, P = 0.035) and the beach for the meiofauna collected in the mid intertidal level (R2 = 16.5 %, P = 0.035) (Table 3).
Table 3 Effect of the abundance of microplastics and other variables in the meiofaunal community composition.
| Predictor | R2 | P | |
| Total | Abundance of microplastics | 0.021 | 0.699 |
| Intertidal level | 0.165 | 0.035 | |
| Mean grain size | 0.068 | 0.109 | |
| Sediment sorting | 0.023 | 0.659 | |
| Beach | 0.038 | 0.858 | |
| Residuals | 0.686 | ||
| Upper | Abundance of microplastics | 0.146 | 0.205 |
| Intertidal level | 0.301 | 0.077 | |
| Mean grain size | 0.098 | 0.355 | |
| Beach | 0.189 | 0.426 | |
| Residuals | 0.266 | ||
| Mid | Abundance of microplastics | 0.085 | 0.229 |
| Intertidal level | 0.202 | 0.050 | |
| Mean grain size | 0.216 | 0.058 | |
| Beach | 0.332 | 0.050 | |
| Residuals | 0.164 | ||
| Lower | Abundance of microplastics | 0.393 | < 0.01 |
| Intertidal level | 0.149 | 0.098 | |
| Mean grain size | 0.142 | 0.133 | |
| Beach | 0.128 | 0.466 | |
| Residuals | 0.189 |
Results are reported from permutational multivariate analyses of variance (PERMANOVA) on the effect of different sets of explanatory variables on community composition calculated as pairwise Bray-Curtis dissimilarities of the occurrence and abundance of the major meiofaunal groups. Analyses are performed for all the dataset, as well as the upper, mid, and lower intertidal levels. R2 and P values are reported. P values for significant predictors are marked in bold.
Discussion
The high abundance of microplastics in the intertidal zone of the sampled beaches is most likely a consequence of the strong tourist pressure, the presence of underwater outfalls that discharge untreated wastewater, the water from the outlets of the Manzanares and Gaira rivers, as well as the activity of fishing and maritime ports (Altamar et al., 2020; Fuentes-Reines et al., 2021; Mancera-Pineda et al., 2013). In previous studies in other coastal areas, all these causes have been identified as sources of debris and microplastics for the marine environments (Talvitie et al., 2015; Willis et al., 2017; Zubris & Richards, 2005). Previous reports of microplastics in the Santa Marta urban beaches (Garcés-Ordóñez et al., 2020a; Garcés-Ordóñez et al., 2020b), have recorded lower concentration than those of the present study, probably because they have been focused only on large fragments discarding the fractions below 1 mm (Piperagkas et al., 2019). Therefore, a comparison of the findings here with those of these previous studies results inappropriate due to the lack of methodological standardization, which is a common problem in studies associated with microplastics, and other marine debris (Van Cauwenberghe et al., 2015). Regarding the distribution of microplastics in our samples, we found no significant differences between the abundance of microplastics across intertidal levels, unlike other studies in which the highest abundances of microplastics have been reported for the lower level (Browne et al., 2011; Claessens et al., 2011; Thompson et al., 2004). This could be explained by the high percentage of microfibers present in the collected sample, since these are more homogeneously distributed in the marine environment than other microplastics, probably due to their low density (Faraday, 2019; Liebezeit & Dubaish, 2012; Mathallon & Hill, 2014), and as a consequence of the small tidal amplitude in the studied area. There was no relationship between the grain size and microplastics concentrations, which is congruent with previous studies that suggested that the distribution of microplastics depends on the density of the material as well as the biological interactions with microbial films, and coastal physical processes (Alomar et al., 2016; Browne et al., 2011; Mathalon & Hill, 2014; Nor & Obbard, 2014; Wang et al., 2020).
Our results agree with other global studies (Alvarez-Zeferino et al., 2020; Browne et al., 2011; Claessens et al., 2011; Kutralam-Muniasamy et al., 2020; Van Cauwenberghe et al., 2013) that found a predominance of fibres among the types of microplastics present in sandy beaches. However, this differs with investigations in the Caribbean coast of Colombia, which reported higher concentrations of fragments rather than fibres; these differences are likely to be a consequence of different methodological approaches, as well as the larger mesh size sieves (1-5 mm) used by those researchers (Acosta-Coley et al., 2019; Garcés-Ordoñez et al., 2020a; Portz et al., 2020). In accordance with our finding, blue is the most common colour of the microplastic recovered from other sandy beaches around the world (Alvarez-Zeferino et al., 2020; Hidalgo-Ruz et al., 2012; Lots et al., 2017), followed by black and to a lesser extent red, yellow, and green (Alvarez-Zeferino et al., 2020; Coley et al., 2020). Other authors, however, referred to transparent as the dominant colour (Di & Wang, 2018; Peng et al., 2017; Tsang et al., 2017; Zhu et al., 2019), but this variation could be again a methodological issue related to the method of classification, especially if a visual sorting is performed without confirmation with other methods (e.g., Spectrometry, micro-Raman spectroscopy). We speculate that the abundance of blue fibres might be related to the presence of fisheries near the localities, given that most of the nets used by the fishermen in Taganga or Santa Marta Bay are made of blue plastic polymers. However, specific chemical analyses are necessary to confirm this hypothesis.
Regarding the meiofauna, the average of abundances and number of taxa were like those recorded in other tropical sandy beaches (Fonseca et al., 2014; Liñero-Arana et al., 2012), whereas the dominance of taxonomic groups coincided with the findings of McLachlan and Brown (2006) on reflective beaches. The high abundances were recovered in the mid intertidal level, like previous studies (Ape et al., 2017; Baia & Venekey, 2019; Fanini et al., 2020). However, even though our study was carried out on protected beaches, it is interesting that the abundance of meiofauna had been significantly affected by the intertidal level because a weak zoning pattern is expected in protected sandy beaches with a small tidal range (Hourston et al., 2005; Pereira et al., 2018). The significant relation between the sand grain size and meiofauna density is also not surprising; it has been extensively shown in other beaches that particle size, sorting, shape, and porosity are key factors that determine the distribution of the meiobenthic communities (Defeo & McLachlan, 2005; Giere, 2009; Rodríguez et al., 2001; Rodríguez, 2004). Despite the present study is the first evidence of the impact of marine microplastics on meiofaunal in the natural environments, our results agree with recent experimental work, which have showed a weak yet significant impact of microplastics on the meiofauna (Wakkaf et al., 2020) attributed to the chemical toxicity of these pollutants over certain species. This toxicity could have a greater effect on organisms belonging to certain trophic guilds, such as non-selective filtering, or deposit and suspension feeders that might accidentally ingest microplastics and debris fragments (Gusmão et al., 2016). Additionally, soft-bodied organisms with weak cuticles that might absorb chemicals accumulated in the interstitial water, or organisms that adhere particles either directly using adhesive glands, or indirectly by secreting viscous substances through dermis for movement can be highly affected (Cole et al., 2013; Fueser et al., 2020; Haegerbaeumer et al., 2019).
The impact of microplastic ingestion has been studied in specific meiofaunal groups (Gusmão et al., 2016) and this might explain our results regarding abundance and composition at the lower intertidal level, where some of those species (i.e., polychaete species) might be concentrated due to the abundance of microplastics. However, we propose that these changes are not only related to the direct impact of the microplastics, but also to the indirect physical effect that their accumulation cause on the sediment structure and thereby in the selection of different species assemblages than those occurring in microplastic free areas. Disentangling such effects and isolating them from the many other physic-chemical and anthropogenic factors that synergically affect sandy meiofaunal communities (Giere, 2019; Leasi et al., 2018; Martínez et al., 2020; Zeppilli et al., 2015) deserves future studies, desirably increasing the number of localities and geographical areas, incorporating a larger number of taxonomic operational units (morphological species or molecular sequences produced by next generation sequencing tools), and adding functional information. This will alleviate local confounding factors, as well as species-specific effects of microplastics, explaining better the patterns in abundance and species composition observed here (Mueller et al., 2020). By publishing these results, yet limited to three beaches, we hope to stimulate further research in that direction.
There is a significant relationship between the presence of microplastics in the sediment, and the abundance and composition of interstitial meiobenthic communities on three studied sandy beaches. We are aware that the results here rely on a limited sampling, and that they will need to be evaluated more extensively. We argue, however, that these limitations are otherwise justified in this specific case by the geographic particularities of the Santa Marta region. Since we were able to find a significant impact even with these limitations, we consider these results relevant to inspire future research in other areas, considering that the locations selected in this study represent iconic examples of the urban beaches commonly found in tropical and subtropical areas worldwide. In addition, we provide an updated checklist on the meiofaunal taxa known from Colombian Caribbean beaches, including several new reports collected during this project.
Ethical statement: the authors declare that they all agree with this publication and made significant contributions; that there is no conflict of interest of any kind; and that we followed all pertinent ethical and legal procedures and requirements. All financial sources are fully and clearly stated in the acknowledgements section. A signed document has been filed in the journal archives.

