


 English (pdf)
 Article in xml format
 Article references
 Send this article by e-mail
 Cited by SciELO
  Similars in
SciELO
Similars in
SciELO  uBio
uBio 
 Permalink
Introduction
The underwater visual census forms the basis of many studies on the ecology of fish in fresh and marine shallow waters (Caldwell et al., 2016; Samoilys & Carlos 2000). Since its implementation in the 1950s, it has become the preferred method for sampling reef fish communities (Kulbicki et al., 2010; Pais & Cabral, 2017; Thanopoulou et al., 2018), as a result of it being a non-destructive (Thanopoulou et al., 2018; Widmer et al., 2019; Yulianto et al., 2015) and inexpensive method (Holmes et al., 2013; Watson & Quinn, 1997) that offers quick estimates of the richness, the abundance, and the sizes of fish (Samoilys & Carlos, 2000).
Although its use has spread, it is important to note that it presents limitations for its execution, related to environmental factors (depth, water clarity, weather conditions), logistics (immersion time or sampling frequency) (Emslie et al., 2018; Holmes et al., 2013; Williams et al., 2006), influence of the diver on the behavior of certain species (attraction or repulsion) (Dickens et al., 2011; Pais & Cabral, 2017; Pereira et al., 2016) and error pathways, being these related to the diver (experience, ability, and behavior) (Assis et al., 2013; Bozec et al., 2011; Widmer et al., 2019), erroneous identification of the species, underestimating the abundance of small and cryptic species (Willis, 2001) and overestimating the most abundant (Williams et al., 2006), which influence the estimation of the richness and abundance (Brock, 1982; García-Charton et al., 2000) and therefore may compromise the ability to detect significant changes in the fish community (Langlois et al., 2010; Wakefield et al., 2013).
Regarding the afore mentioned, the implementation of techniques based on video has been proposed (Langlois et al., 2010; Mallet & Pelletier, 2014). Although the development of video sampling methodologies for the study of marine communities dates back to the 1950s, there were several limitations (cost and low operation of the equipment, battery autonomy, storage capacity) (Bacheler et al., 2017; Widmer et al., 2019), these have been overcome as a result of technological progress (greater operability, autonomy and capacity) and that are economically more affordable (Goetze et al., 2019; Mallet & Pelletier, 2014; Zarco-Perello & Enríquez, 2019).
With regards to its advantages, it is specified that they allow to reduce the error related to the variability between observers, since the information can be verified (Assis, 2013; Langlois et al., 2010; Widmer et al., 2019). It's a permanent record, it allows to re-examine the data for various purposes (Goetze et al., 2019; Pelletier et al., 2011; Tessier et al., 2013), and it allows to collect field data by divers who are not experts in fish identification (Pelletier et al., 2011; Tessier et al., 2005; Tessier et al., 2013).
Operationally, among its disadvantages are the cost of the equipment, complications for its execution (Holmes et al., 2013; Widmer et al., 2019), the precision with respect to the human eye (Bortone et al., 2000; Holmes et al., 2013; Tessier et al., 2005), as well as the limitation to identify small and cryptic species (Goetze et al., 2019; Grane-Feliu et al., 2019; Wilson et al., 2018). Other aspects that have been mentioned are that it can be more expensive and slower than the traditional census since it involves video processing for analysis (Grane-Feliu et al., 2019; de la Guardia et al., 2021; Holmes et al., 2013).
Within the video method, the most recognized techniques are stationary (with bait or without bait), diver-operated video (DOV), and remote underwater video (Mallet & Pelletier, 2014; Schramm et al., 2020; Wilson et al., 2018). According to Muphy & Jenkins as well as Goetze et al. (2015) report that each technique offers advantages and disadvantages. Of these techniques, those operated by divers (DOV) stand out, since they are considered the most profitable for estimating the abundance and richness of fish communities (Goetze et al., 2015; Grane-Feliu et al., 2019; Langlois et al., 2010; Wilson et al., 2018). Watson et al. (2005) refers that this technique allows greater maneuverability of the camera(s), which offers advantages in structurally complex habitats such as coral reefs. Likewise, it is specified that this technique is the most pertinent when there is an interest in the associations of fish with a particular type of habitat or physical structure due to the ability to restrict the size of the sample unit (Galaiduk et al., 2017; Tessier et al., 2013).
This technique consists in the use of a video camera(s) to record the route that is made in the sampling unit, the identification of the species and registration of their abundance is carried out later by viewing the recording on a computer monitor (Goetze et al., 2015). Within the DOV, two variations are recognized, the first is the use of a single camera where the technique consists of the video operator swimming alongside the diver who performs the census (Bortone et al., 1991; Pelletier et al., 2011; Tessier et al., 2005), and the second consists of a system where two cameras are mounted on a base (stereo video) (S-DOV) and in the same way the video operator swims next to the diver who performs the census (Goetze et al., 2015; Harvey et al., 2001; Harvey et al., 2004; Langlois et al., 2010).
Taking them into account, studies that have compared the traditional census with the S-DOV are frequent (Grane-Feliu et al., 2019; de la Guardia et al., 2021; Wilson et al., 2018), this is not the case for studies that compare the DOV with the traditional one (Bortone et al., 1991; Tessier et al., 2005; Tessier et al., 2013; Wartenberg & Booth, 2015). These studies coincide that through both methods they can provide comparable estimates, however, it is emphasized that a greater number of species and individuals are recorded through the traditional census.
In this regard, it should be noted that the implementation of the diver-operated video technique to evaluate ichthyofauna in the Mexican Pacific is limited, and there is no information on its use. Therefore, the present objective is to compare the estimates obtained through the traditional census and the video census of the fish community of two localities in the central Mexican Pacific.
Materials and methods
Study area: The localities selected to carry out the study were Maguey and La Entrega bays, which are located in the complex “Huatulco Bays'' (15°40'48'' - 15°45'36'' N & 96°14'24'' - 96°07'13'' W), on the coast of the state of Oaxaca, Mexico (Fig. 1). This area is considered one of the most important regions in the reef ecosystems of the Mexican Pacific, since it is home to a great diversity of species of echinoderms, corals, and fishes (Juárez-Hernández & Tapia-García 2017; Juárez-Hernández & Tapia-García, 2018a; López-Pérez et al., 2014). Both bays are characterized by high species richness, abundance, and fish diversity (Juárez-Hernández & Tapia-García, 2017; Juárez-Hernández et al., 2021; López-Pérez et al., 2010).
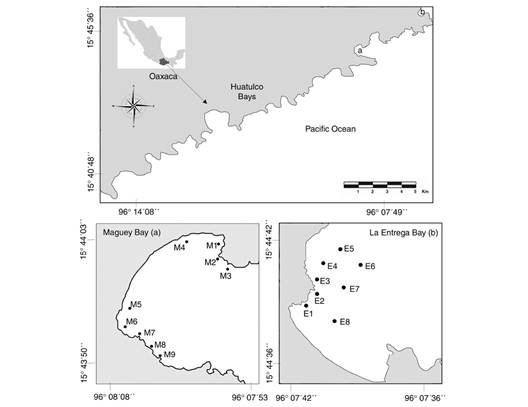
Fig. 1 Location of the study area “Huatulco Bays''. Distribution of sampling points in A. Maguey Bay and B. La Entrega Bay.
Sampling strategy: The sampling was carried out in September 2019, and the selection of the sampling sites in each locality corresponded to previous studies (Juárez-Hernández & Tapia-García, 2017; Juárez-Hernández et al., 2021). Specifically for Maguey, nine sampling points were selected and eight for La Entrega. These points covered environments with rocky substrate (M1, E1), coral (M7, E3, E4, E5; E6, E7), coral rubble (E8), sand (M4, M5) as well as mixed environments, such as coral-rocky (M3, M8), rocky-coral (M2, M9) and sandy-rocky-mixed (M6) (Fig. 1). The depth at these sampling points was at least 3 m and the maximum was 10 m.
At each sampling point, a 10 meter long transect was established, in which the traditional census (TC) and the video census (VC) were carried out using the diver-operated video technique (DOV) by the same subject using free diving (snorkel) (Fig. 2). Therefore, the video camera was placed in the visor of the observer, which is designed for this purpose. The equipment used to record was a Mobo action camera, model 9031 and the camera parameters were 4K recording (Ultra High Definition- 3840x2160) without any zoom. It is required that the observer be trained in the identification of the fish species and the execution of the method.
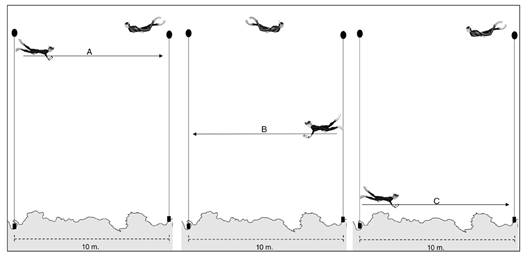
Fig. 2 Representation of the routes made at each sampling point. A. near the surface, B. mid-water and C. near the bottom.
The procedure consisted of the observer standing at one end of the transect, recording the transect number on an acrylic table, and then turning on the camera and recording the transect number annotation. In this way, the recording began as the observer recorded the species and their abundance on the acrylic table. In each transect three routes were made, 10 meters each (Fig. 2), the first was to the opposite end of the transect (near the surface) (Fig. 2A), then back to the point of origin (mid-water) (Fig. 2B), and finally a third route to the opposite end of the transect (near the bottom) (Fig. 2C). At the end of the routes, both the recording of fish in the acrylic table, as well as the recording, stopped. The duration of the routes was approximately five minutes.
The videos were viewed two months after sampling on a 23-inch monitor. The analysis of the video was similar to the in-situ procedure carried out in the traditional census, that is, at the beginning of the video the species and number of individuals were recorded on a sheet of paper. It is specified that the video was played continuously and without pauses, for a total of five minutes.
Data analysis: The taxonomic status of the species was verified according to Fricke et al. (2020a) and the taxonomic arrangement was based on Fricke et al. (2020b). For each of the censuses (TC and VC), on each sampling point and locality, the number of species, abundance (number of individuals), and diversity (Shannon & Wiener, 1963) were calculated. Species accumulation curves were performed using the non-parametric estimator (Chao 1) based on abundance. The curves were constructed with 9 000 randomizations using the EstimateS v9 packet (Colwell, 2013).
For each locality, the results of each census were compared using a qualitative similarity coefficient (Sorensen). The degree of agreement between the observations of both censuses was evaluated by means of Kendall's W concordance coefficient (Kendall & Smith, 1939; Legendre, 2005). Paired t-tests were carried out to compare the number of species, abundance, and diversity by type of census in each locality, when the normality assumption was fulfilled (Shapiro-Wilk test, P > 0.05), and if this assumption was not testable, the Wilcoxon test was applied (Whitlock & Schluter, 2009). To compare the number of species, abundance, and diversity of the same sampling site (environment) by type of census, permutation tests were used. This test calculates the richness, abundance, and diversity for two samples and compares each of these parameters using permutations (9999) (Hammer, 2021). In addition, a meta-analysis was carried out (Sokal & Rohlf, 1995) considering the p values of each of these tests with the objective of verifying if there were differences in the number of species, abundance and diversity between census type by locality. For this analysis it was taken into account that if the resulting value of the product of the meta-analysis (-2 Σ Ln P) was greater than the value of the Chi-square statistic (α = 0.005 with 2*k degrees of freedom), there were differences between the attribute analyzed (number of species, abundance, diversity) by type of census. The evaluation of the degree of similarity of the ichthyofauna between the types of census was carried out using the Bray-Curtis index (Clarke & Warwick, 1994), and its analysis was carried out by a Non-metric Multidimensional Scaling (nmMDS) and analysis of similarity (ANOSIM) (Clarke, 1993) with permutation (9999) to identify significant differences in terms of composition and abundance of fish. If the similarity analysis revealed differences, a similarity percentage analysis (SIMPER) (Clarke, 1993) was performed to identify the species that contribute to the differentiation between both types of censuses (TC vs VC). Finally, the abundance of the most represented species was compared between both types of censuses (TC vs VC) using paired t-tests, or, when appropriate, using the Wilcoxon test. All tests and analyzes were carried out with the Past V.4.5 packet (Hammer et al., 2001).
Results
Maguey Bay: In the traditional census (TC), 27 species (Mean = 7.25 ± 3.32) corresponding to 21 genera, 13 families, and seven orders were identified (Table 1). The total abundance was 235 individuals (Mean = 9.37 ± 15.68), the diversity was 2.172 (Mean = 1.41 ± 0.38) (Fig. 3). According to the Chao 1 estimator, the expected number of species was 33. Stegastes acapulcoensis, Thalassoma lucasanum and Microspathodon dorsalis were the most abundant species.
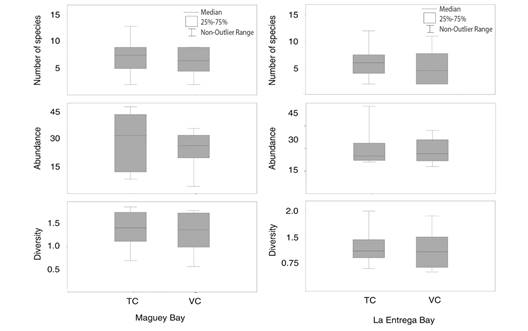
Fig. 3 Variation of the number of species, abundance, and diversity between the traditional census (TC) and video census (VC) in each locality.
In the video census (VC), 21 species (Mean = 6.5 ± 2.56) corresponding to 16 genera, 10 families and five orders were identified (Table 1). The abundance was 203 individuals (Mean = 24.62 ± 10.62), the diversity was 1.969 (Mean = 1.38 ± 0.42) (Fig. 3). According to the Chao 1 estimator, the expected number of species was 23. S. acapulcoensis, T. lucasanum and M. dorsalis were the most abundant species.
Table 1 Taxonomic list of the fish community of Maguey and La Entrega bays
| Class | Order | Family | Species | Maguey | Entrega | |||
| TC | VC | TC | VC | |||||
| Actinopteri | Syngnathiformes | Fistularidae | Fistularia commersonii Rüppell, 1838 | 1 | 1 | 1 | ||
| Carangiformes | Carangidae | Caranx caballus Günther, 1868 | 5 | 1 | ||||
| Caranx caninus Günther, 1867 | 2 | 5 | ||||||
| Trachinotus rhodopus Gill, 1863 | 4 | 3 | ||||||
| Mugiliformes | Mugilidae | Mugil curema Valenciennes, 1836 | 7 | 1 | ||||
| Acanthuriformes | Pomacanthidae | Holacanthus passer Valenciennes, 1846 | 3 | 3 | 2 | 2 | ||
| Chaetodontidae | Chaetodon humeralis Günther, 1860 | 2 | ||||||
| Johnrandallia nigrirostris (Gill, 1862) | 1 | 3 | 2 | |||||
| Acanthuridae | Acanthurus xanthopterus Valenciennes, 1835 | 2 | 5 | |||||
| Prionurus laticlavius (Valenciennes, 1846) | 11 | 13 | 9 | 14 | ||||
| Tetraodontiformes | Tetraodontidae | Arothron meleagris (Anonymous, 1798) | 1 | 6 | 7 | |||
| Canthigaster punctatissima (Günther, 1870) | 1 | |||||||
| Ostraciidae | Ostracion meleagris (Shaw, 1796) | 1 | ||||||
| Balistidae | Sufflamen verres (Gilbert and Starks, 1904) | 1 | 2 | |||||
| Centrarchiformes | Kyphosidae | Kyphosus elegans (Peters, 1869) | 7 | 1 | ||||
| Kyphosus vaigiensis (Quoy and Gaimard, 1825) | 2 | 1 | 2 | |||||
| Cirrhitidae | Cirrhitichthys oxycephalus (Bleeker, 1855) | 3 | ||||||
| Perciformes | Serranidae | Cephalopholis panamensis (Steindachner, 1877) | 3 | 2 | ||||
| Epinephelus labriformis (Jenyns, 1840) | 1 | 1 | ||||||
| Lutjanidae | Lutjanus argentiventris (Peters, 1869) | 3 | 2 | |||||
| Mullidae | Mulloidichthys dentatus (Gill, 1863) | 1 | 2 | |||||
| Pomacentridae | Abudefduf concolor (Gill, 1862) | 3 | 2 | |||||
| Abudefduf troschelii (Gill, 1862) | 2 | 2 | 3 | |||||
| Azurina atrilobata (Gill, 1862) | 10 | 4 | ||||||
| Microspathodon bairdii (Gill, 1862) | 1 | 7 | 1 | 1 | ||||
| Microspathodon dorsalis (Gill, 1862) | 24 | 27 | 7 | 11 | ||||
| Stegastes acapulcoensis (Fowler, 1944) | 94 | 81 | 84 | 68 | ||||
| Stegastes flavilatus (Gill, 1862) | 1 | 4 | 1 | |||||
| Labridae | Bodianus diplotaenia (Gill, 1862) | 6 | 4 | 4 | 3 | |||
| Halichoeres chierchiae Di Caporiacco, 1948 | 1 | |||||||
| Halichoeres dispilus (Günther, 1864) | 2 | 1 | ||||||
| Halichoeres nicholsi (Jordan and Gilbert, 1882) | 1 | 2 | ||||||
| Halichoeres notospilus (Günther, 1864) | 2 | 4 | ||||||
| Thalassoma lucasanum (Gill, 1862) | 43 | 30 | 105 | 96 | ||||
| Scaridae | Scarus ghobban Forsskål, 1775 | 1 | ||||||
| Scarus perrico Jordan y Gilbert, 1882 | 2 | 5 | ||||||
Species registered in the traditional census (TC) and video census (VC) in in each locality.
The species that were only identified using the traditional method were: Arothron meleagris, Canthigaster punctatissima, Epinephelus labriformis, Fistularia commersonii, Halichoeres chierchiae, H. nicholsi, Johnrandallia nigrirostris, Kyphosus vaigiensis and Sufflamen verres. For their part, the species that were only identified by video were Cirrhitichthys oxycephalus, Kyphosus elegans and Stegastes flavilatus. Through the video census, 77 % of the species observed by the traditional census were recorded.
The species similarity between both methods was 75 % (Sorensen). The degree of agreement between observers was substantial (W = 0.766, P = 0.029). Number of species (t = 0.8143, P = 0.4422), abundance (t = 1.1232, P = 0.2983) and diversity (t = 0.2897, P = 0.7804) did not show differences between the type of census, as well as by environment (P > 0.05) According to the meta-analysis, the number of species (10.80 < 37.2), abundance (30.80 < 37.2) and diversity (14.10 < 37.2) showed no differences between census types. The non-metric scaling showed the similarity of the ichthyofauna recorded by both censuses (traditional and video) both by sampling point, as well as in a general way (Fig. 4A). Regarding composition and abundance, no differences were found (ANOSIM = -0.078, P = 0.8914). The abundance of the dominant species did not show differentiation (S. acapulcoensis: t = 0.759, P = 0.461), (T. lucasanum: t = 0.853, P = 0.418), (M. dorsalis: W = 13.5, P = 0.092).
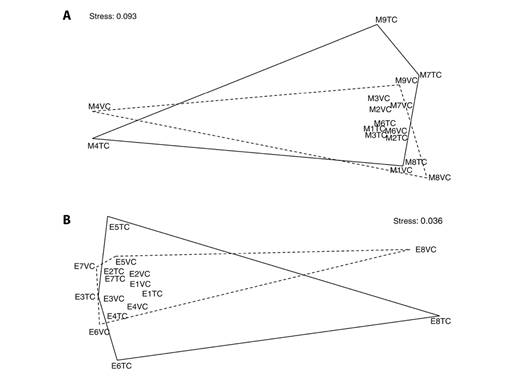
Fig. 4 Non-metric multidimensional scaling of sampling points carried out using the traditional census (solid line) and video census (punctuated line) in A. Maguey Bay and B. La Entrega Bay.
La Entrega Bay: In the traditional census (TC), 20 species (Mean = 6 ± 3.03) belonging to 16 genera, 12 families, five orders were identified (Table 1). The total abundance was 239 individuals (Mean = 29.87 ± 12.33), the diversity was 1.601 (Mean = 1.21 ± 0.486) (Fig. 2). According to the Chao 1 estimator, the expected number of species was 23.5. T. lucasanum, S. acapulcoensis and P. laticlavius were the most abundant species.
On the other hand, the video census (VC) identified 18 species (Mean = 5.12 ± 3.39) belonging to 16 genera, 11 families, five orders were identified (Table 1). The abundance was 225 individuals (Mean = 28.125 ± 8.166), the diversity was 1.741 (Mean = 1.13 ± 0.53) (Fig. 2). According to the Chao 1 estimator, the expected number of species was 19. T. lucasanum, S. acapulcoensis and P. laticlavius were the most abundant species.
The species that were only identified by the traditional method were Halichoeres nicholsi, Kyphosus elegans, Microspathodon bairdii, Ostracion meleagris, Scarus ghobban and Sufflamen verres. The species that were only identified through the video census were Abudefduf troschelii, Chaetodon humeralis, Epinephelus labriformis and Kyphosus vaigiensis. Through the video, 90 % of the species observed by the traditional census were recorded.
The species similarity between both methods was 78 % (Sorensen). The degree of agreement between observers was very high (W = 0.803, P = 0.036). Number of species (t = 1.433, P = 0.1949), abundance (W = 22.5, P = 0.5281) and diversity (t = 0.870, P = 0.4129) did not show differences between the type of census, as well as by environment (P > 0.05). The meta-analysis corroborated these results, as it showed that the number of species (12.86 < 34.26), abundance (22.76 < 34.26) and diversity (14.90 < 34.26) were not different between census types. Through non-metric scaling, the similarity of the ichthyofauna recorded by both censuses (traditional and video) was observed both by sampling point, as well as in a general way (Fig. 4B). In the same way, the composition and abundance did not show differences between the type of census (ANOSIM = -0.05497, P = 0.8197). The abundance of the dominant species did not show differentiation (T. lucasanum: t = 0.4269, P = 0.682), (S. acapulcoensis: t = 2.116, P = 0.109), (P. lativlavius: W = 2, P = 0.654).
Discussion
According to the results, it is specified that the similarity of species between both techniques in each locality was high (more than 70 %), as well as that related to orders, families, genera, and dominant species. Regarding the comparison of the composition and structure, number of species, abundance and diversity of the fish community and dominant species between both methods, no significant differences were found in each locality, which is different to studies that have used a technique similar to the one presented here (DOV) (Pelletier et al., 2011; Tessier et al., 2005; Tessier et al., 2013), but it is similar to that reported by Bortone et al. (1991) as well as Wartenberg & Booth (2015) who used the same technique, as well as other works that used the S- DOV (Grane-Feliu et al., 2019; de la Guardia et al., 2021).
Probably no significant differences will be found, it is the result of the way in which the chosen technique (DOV) was implemented as well as the technique itself, conjoined with the experience of the observer both in the identification of the fish, as well as in the execution of the census (traditional and by video). Regarding its execution, the observer who registered the species is the same one who carried out the recording and analysis of it, which determines that there is a high concordance between observations, which is different from the way in which it was carried out in other works that have used the DOV (Bortone et al., 1991; Pelletier et al., 2011; Tessier et al., 2005; Tessier et al., 2013), since they used a second observer to record the video. Regarding the chosen technique, compared to other video techniques, it allows greater maneuverability of the camera(s), which offers advantages in structurally complex habitats such as coral reefs (Watson et al., 2005). This allowed for an adequate characterization of the fish components (surface, mid-water, and bottom), and of particular of the cryptic fish component, for which the third route was carried out, which is recommended to adequately characterize this component (Holmes et al., 2013; Pelletier et al., 2011; Watson et al., 2005).
One aspect that was considered to cause differences in the number of species, abundance and diversity between both techniques was the complexity of the habitat (determined by the combination of substrates, number of coral species, depth, or exposure to waves) for certain environments, which are characterized by presenting a greater number of fish species and abundance (Juárez-Hernández & Tapia-Garcia, 2018a; Juárez-Hernández & Tapia-Garcia, 2018b; Juárez-Hernández et al., 2013). Specifically, in Maguey Bay these environments are the mixed, coral, and rocky-coral environments (Juárez-Hernández et al., 2021), and in La Entrega the coral and rubble-sandy environments (Juárez-Hernández, 2014), however, it was found that there were no significant differences in the community parameters analyzed in the mentioned environments, as well as for the rest of the environments.
Given these results, it can be specified that the DOV technique provides comparable estimates of richness and abundance with respect to the traditional census, coinciding with that reported by Bortone et al. (1991) as well as Wartenberg & Booth (2015), revealing that the DOV can be considered as a complementary technique and/or equivalent to the traditional census (Davis et al., 2014; Wartenberg & Booth, 2015). Similar conclusions have been obtained using the S-DOV technique (Grane-Feliu et al., 2019; de la Guardia et al., 2021; Wilson et al., 2018).
Considering its complementary character for Maguey Bay, combining the information from both techniques provides a total of 29 species, this estimate being similar to that obtained by Juárez-Hernández et al. (2013), in which the sampling effort was higher (15 transects) than that carried out here. In La Entrega, when combining the information, it provides a total of 23 species, this estimate being higher than that obtained in a sampling carried out in September 2010 with the same sampling effort (nine transects) (Juárez-Hernández, 2014). It should be noted that both mentioned studies used two observers and transects of the same length as the ones used in this study.
In addition to the aforementioned, the use of this technique as a complement has several advantages, one of which is that it offers a permanent record, allowing the correction of misidentified in situ species (Bortone et al., 1991; Langlois et al., 2010; Wartenberg & Booth, 2015), it limits the potential effects of the observer, since the video can be viewed and examined repeatedly by different people (Langlois et al., 2010; Pelletier et al., 2011; Preuss et al., 2009), it provides additional information, since the characteristics of the habitat are recorded on the video (Pelletier et al., 2011; Tessier et al., 2013; Wilson et al., 2018). This is essential since many times the observer, being focused on registering and counting the fish, is not able to adequately characterize the reef architecture and the attributes associated with it (Preuss et al., 2009; Tessier et al., 2013; Wartenberg & Booth, 2015).
The disadvantages of video methods have been stipulated to be the cost associated with purchasing the equipment as well as the additional time it takes to process and analyze the recording (Goetze et al., 2019; de la Guardia et al., 2021; Tessier et al., 2013). Regarding the cost of the equipment used for this study, it is specified that it was low (<$100 dollars), highlighting the role of action cameras, which offer a perfect balance among price, image quality, and operability (Letessier et al., 2015; Zarco-Perello & Enríquez, 2019), thus granting viability and accessibility (Goetze et al., 2015; Letessier et al., 2015). In relation to the procedure, processing and analyzing the recording, as well as the execution of the census and its analysis in the study, did not last more than five minutes and it should be clarified that the video was not edited so it was viewed exactly as it was recorded. Whereas these aspects allow us to consider this technique as profitable, coinciding with what has been described by various authors (Grane-Feliu et al., 2019; Langlois et al., 2010; Tessier et al., 2005), it is vital to mention that a more detailed analysis of the recording (setting a longer time for its analysis) would provide valuable additional information.
Considering all these elements, it can be indicated that the combination of both techniques could provide a more complete evaluation and a permanent record of all fish (Grane-Feliu et al., 2019; de la Guardia et al., 2021; Wartenberg & Booth, 2015), which undoubtedly can increase the spatial and temporal scope of the monitoring programs, potentially improving the understanding of the environmental and anthropogenic changes in fish communities (Wilson et al., 2018). The foregoing is highly significant in reef systems given their current situation (Hoegh-Guldberg et al., 2017; Hughes et al., 2017), since, if biodiversity is to be conserved, it is necessary to evaluate it in an adequate and representative way through a census (Jackson et al., 2001; Wilson et al., 2018) using an appropriate survey method (Rotherham et al., 2007; Thomas, 1996; Wartenberg and Booth, 2015).
Although the differences were not significant, it is denoted that using of the TC a greater number of species and abundance were registered, which is consistent with other studies that have used the DOV (Bortone et al., 2000; Pelletier et al., 2011; Tessier et al., 2005), as well as other video techniques (S-DOV) (Davis et al., 2014; de la Guardia et al., 2021; Wilson et al., 2018). The fact that a greater number of species and abundance is recorded has been explained under various points, the first of which is that the field of view of the camera is smaller than that of the observer (Bortone et al., 2000; Tessier et al., 2013; Widmer et al., 2019), that the definition capacity of the human eye is greater than that of the video camera (Holmes et al., 2013; Lowry et al., 2012; Wilson et al., 2018), and that the identification of the species in a video projected on a screen is more complex because the resolution is lower than that of the human eye (de la Guardia et al., 2021; Pelletier et al., 2011). These conditions, at first, would limit the equivalent character, as referred by Tessier et al. (2005), however, with technological advancement and multiple options and configurations of action cameras (Goetze et al., 2015; Goetze et al., 2019; Zarco-Perello & Enríquez, 2019), these limitations can be overcome, and therefore, their equivalence character could be established (Grane-Feliu et al., 2019; de la Guardia et al., 2021; Wartenberg & Booth, 2015).
Another aspect that has been referred to is that indicated by Bortone et al. (1991) as well as by Tessier et al. (2013) who refer that the reason why a greater number of species are identified by TC is that unlike the camera, the observer can turn his head to survey fish. However, with the technique used here, since the camera is attached to the observer's visor, it rotates in the direction where the observer's view is directed. Although this is an advantage, it must be specified that in some cases in the present study it resulted in an inconvenience, since the used camera does not have an image stabilization system, determining that when the observer made “sudden'' movements to observe species, the image is destabilized, limiting the identification of the species and the recording of their abundance. Probably this situation determined that in Maguey the percentage of species that were recorded in the video was lower (77 %) than in the traditional census. This compared to La Entrega, which through the video recorded 90 % of the species in comparison to the traditional census. The foregoing refers to the fact that the environments of Maguey, unlike La Entrega, are characterized by having a greater structural complexity, meaning that they present a greater number of species and abundance (Juárez-Hernández, 2014; Juárez-Hernández & Tapia-García, 2017), which within the sampling determined to carry out a greater number of movements, causing the loss of stability of the video and therefore limiting the identification of the species. To reduce this effect, it is necessary to purchase a camera that has an electronic stabilization system.
Video techniques have been established to be deficient in identifying small and cryptic species (de la Guardia et al., 2021; Holmes et al., 2013; Wilson et al., 2018). In this order, for Maguey Bay of the eight species not identified through the video, only three of these are considered cryptic or associated with the substrate (Halichoeres chierchiae, H. nicholsi and Epinephelus labriformis) (Robertson & Allen, 2015), while for La Entrega, only four species were not identified through the video (Table 1), being H. nicholsi the only of these considered as cryptic. As it can be seen, only a minimal percentage of the species referred to as cryptic was not observed through the video, which may be the result of the technique used (DOV) and the third route, which is precisely designed to characterize the cryptic or components associated to the bottom (Holmes et al., 2013; Pelletier et al., 2011; Watson et al., 2005). In accordance with this argument, it is noted that only with the video the species Cirrhitichthys oxycephalus was recorded in Maguey, which has been referred to as cryptic and small (Juárez-Hernández & Tapia-Garcia, 2018b; Robertson & Allen 2015; Thomson et al., 2000), while for La Entrega only with the video were Chaetodon humeralis and Epinephelus labriformis registered, both associated with the substrate (Robertson & Allen, 2015). Species of other components (Abudefduf troschelii y Kyphosus elegans) (Robertson & Allen, 2015), were only recorded through video and not through TC, this is the result of the time allocated by the observer to record the species and its abundance in the acrylic, which is consistent with what was reported by Tessier et al. (2013), who referred that with a lot of information to write at the same time (species and their abundance), the risk of losing information increases, therefore the use of audio recording was recommended instead of performing the annotations on acrylic (Bortone et al., 1991). According to this point, the value of the video recording is denoted, eliminating this problem (Langlois et al., 2010; Watson et al., 2005; Watson et al., 2010).
An aspect to highlight of the technique used here that would reveal its high significance is that it can be carried out by an observer who is not an expert in fish identification (Mallet & Pelletier, 2014; Pelletier et al., 2011; Wartenberg & Booth, 2015), which determines that this is a profitable technique, since it would allow simultaneous studies to be carried out in different places (Mallet & Pelletier, 2014; Tessier et al., 2013; Wilson et al., 2018). In this regard, volunteers have been posited as a significant source of help in collecting marine biodiversity information, as it is a cost-effective way to fill spatial and temporal gaps in traditional monitoring programs (Edgar et al., 2014; Lamine et al., 2018). Although this could be feasible, it is necessary to emphasize that the method must be easy to apply (Lamine et al., 2018) and that the volunteers must be given training on the characteristics of the sampling, behavior, performance, specifications on routes and sampling time (Aburto-Oropeza et al., 2015; Edgar et al., 2014; Lamine et al., 2018). Therefore, the technique implemented here could be feasible in these terms, since the equipment is inexpensive, the method is easy to apply, and the training would be minimal, However, it is emphasized that when carried out by free diving (snorkeling), its implementation is limited to shallow areas. Considering these points, the implementation of this technique in the study area could be functional for the establishment of long-term monitoring programs with the help of volunteers (Harvey et al., 2013; Wilson et al., 2018).
The development of biotic inventories and the quantification of biodiversity are essential for the to the development and application of relevant and successful management and conservation strategies (López-Pérez et al., 2013; Lubchenco & Grorud-Colvert, 2015; Perrings et al., 2011). Therefore, it is essential to explore and implement profitable methods and techniques that allow the fulfillment of such objectives in an adequate and representative manner. According to the above, the technique used in the present study can be considered under these characteristics, highlighting the two mentioned ways of use, the first being called as a complement and the second as being called equivalence that could be of high value. The technique, being economical and easy to execute, could be functional in those areas where the monitoring programs present problems for their operation resulting from limitations in their resources (material and human).
Ethical statement: the authors declare that they all agree with this publication and made significant contributions; that there is no conflict of interest of any kind; and that we followed all pertinent ethical and legal procedures and requirements. All financial sources are fully and clearly stated in the acknowledgements section. A signed document has been filed in the journal archives.

