


 English (pdf)
 Article in xml format
 Article references
 Send this article by e-mail
 Cited by SciELO
  Similars in
SciELO
Similars in
SciELO  uBio
uBio 
 Permalink
Given that biodiversity is currently threatened by human-mediated processes, multiple initiatives have been proposed to assess the conservation status of the different taxonomic groups across the globe (Thomas et al., 2004; International Union for Conservation of Nature [IUCN], 2016). Even though more than 86 313 mammal, bird, reptile, amphibian, fish, insect, mollusk, and plant species are now classified under a given threatened category by the IUCN, about 16 % of these are still indicated as Data Deficient (hereafter DD; 13 713 species). The currently unavailable information on population size, range area, and rate of population decline for these species classifies them under a category that does not diagnose their conservation status (Rodrigues, Pilgrim, Lamoreux, Hoffmann, & Brooks, 2006; IUCN, 2016; Collen et al., 2016). This trend is also more notorious in the Neotropical region, where the number and extent conservation plans of local governments significantly contrast with its outstanding diversity.
Recent efforts to classify the conservation status of amphibian species have been triggered by the rapid decline in populations’ sizes. Yet, a large amount of the extant diversity is still unassessed (Kiesecker, Blaustein, & Belden, 2001; Blaustein & Kiesecker, 2002; Stuart et al., 2004; Meredith, Van Buren, & Antwis, 2016). For instance, among the assessed amphibian species, 41 % are currently classified under a threatened category, and ca. 20 % are indicated as Data Deficient (Parsons, 2016). Given these circumstances, efforts made in describing the natural history, ecology, and spatial context of DD species represent a priority for increasing efficiency of the ongoing and future conservation plans (Vie et al., 2008; Morais et al., 2013; Parsons, 2016).
Here we analyze amphibian species that are currently classified as DD and occur in Colombia (IUCN, 2016). Colombia is a ‘mega-diverse’ country that harbors nearly 10 % of the global amphibian richness (ca. 813 species) (Acosta-Galvis & Cuentas, 2017). A lack of protective measures to minimize the impact of human-mediated process on the natural populations has led to ~32 % of the amphibian species being classified as under threat (i.e., 256 species). Furthermore, 16 % of total amphibian species in the country are, for now, classified under a DD category (129 species) (UICN, 2016).
To address a lack of information available for DD category, we compiled the largest dataset of geographical occurrences for the DD amphibian species distributed in Colombia. Based on this dataset, the realized and potential geographic distribution for 99 % of the Colombian DD amphibians were analyzed. Realized distribution (or range size) was analyzed using the R package letsR (Vilela & Villalobos, 2015) and potential distribution was inferred using MaxEnt (Phillips, Dudík, & Schapire, 2006). Based on the inferred geographical distribution for each species, we analyzed the estimated anthropogenic impact on the DD populations.
The primary aim of this study is to characterize the geographical context of the DD species occurring in Colombia. This involves the description of their geographical ranges and the quantification of the anthropogenic pressures that each species experiences throughout its distribution. We specifically used this information to address whether the DD category describes accurately the current conservation status of the same amphibian taxa. We demonstrate that, in general, this category hides the potential threats that are experienced by most of these amphibian species.
Materials and methods
Data collection: Our analyses are based on the geographical records for 128 amphibian species present in Colombia and listed as DD by the IUCN. We searched for DD amphibian species in Colombia using the IUCN database (by June 2017). Next, we used scientific articles, books, and museum databases to compile an occurrence database for every DD species in Colombia. Each of the analyzed occurrences, supported by at least a single reference, is provided in Table S1. We did not include Leptodactylus hallowelli since the taxonomic limits are problematic and can cause the inclusion of erroneous registries into the database (de Sá et al., 2014). When coordinates were not available from the authors, we used the exact locality name retrieved from the publication to obtain longitude and latitude estimates (i.e., geocoding). The latter analyses were performed using the ggmap v.2.6.1 R package (Kahle & Wickham, 2013; Table S2). Furthermore, even when this approach was used for most records from the 20th century, we visually evaluated the accuracy of these estimates (Table S1).
Species distribution: For every analyzed species, geographical distribution was described using two approaches. We first estimated the extension of the 80 % higher average probability of occurrence using MaxEnt (hereafter referred as 80 % HPO) (Phillips et al., 2006). This estimate is based on the set of cells having a presence probability larger than the 80 % of the maximum presence probability for a given species. Importantly, species with less than three geographical occurrences were excluded from analyses (Hernández, Graham, Master, & Albert, 2006; Elith et al., 2011; Rinnhofer et al., 2012; Wisz et al., 2008). We also highlight that recent analyses have shown that for non-widespread species (as most DD species; Table S1 and Table S2), three observations are enough for yielding reliable results (van Proosdij, Sosef, Wieringa, & Raes, 2016).
For MaxEnt analyses we first constructed in R a projected spatial points object using all the geographical records per species. Then, all 19 BIOCLIM raster layers (1 km resolution) (Booth, Nix, Busby, & Hutchinson, 2014) were cropped to an extent corresponding to the species’ geographical maximums plus 5º in each direction (i.e. North, South, West, and East). We removed collinearity between predictors using remove Collinearity function implemented in the Virtualspecies package version 1.1 (Leroy, Meynard, Bellard, & Courchamp, 2016). We ran MaxEnt from R using dismo package version 1.1-1 (Hijmans, Phillips, Leathwick, & Elith, 2011). The following parameters were used for the same analyses: ‘randomtestpoints = 30’, ‘betamultiplier = 1’, ‘linear = true’, ‘quadratic = true’, ‘product = true’, ‘threshold = true’, ‘hinge = true’, ‘threads = 2’, ‘responsecurves = true’, ‘jackknife = true’. For species having less than five registries, we did not include the ‘randomtestpoints’ parameter. By last, Raster files construction for the MaxEnt output was made using predict function in R, over the subset of cropped climatic raster layers.
We also estimated the geographical range using the R package lestR (Vilela & Villalobos, 2015). These estimations are based on a presence/absence that is constructed through the rangesize function implemented in the same package. Grid cell resolution was set to 0.5º (~100 Km2) for both analyses.
Human footprint: We quantified the human footprint for each DD species using The Global Human Footprint Dataset Version 2 ( Wildlife Conservation Society [WCS] & the Columbia University Center for International Earth Science Information Network [CIESIN], 2005). Importantly, this dataset is a proxy for human-mediated disturbance of natural systems, and therefore, is expected to be positively correlated to the anthropogenic effects on amphibian populations (Sanderson et al., 2002). Human footprint ranges from 0 % to 100 %, with higher values indicating stronger anthropogenic disturbances. This dataset is based on nine global layers that summarizes anthropogenic pressures within the following major categories: (1) population density, (2) built-up areas, (3) nighttime lights, (4) land use/land cover, and (5) human access (coastlines, roads, railroads, navigable rivers). Here we specifically analyzed the average human footprint for each species based on the estimated values across populations.
We then used linear regressions to test the relationship between human footprint, description year and the between-species distance for the DD amphibian species. We first asked whether species described a long time ago have the smallest geographic ranges. Secondly, we tested the relationship between the age of species description and average human footprint across species. We were mostly interested in testing whether recently described species were less affected by anthropogenic activities. Then, we addressed if non-widespread species were more affected by human-mediated processes (i.e., higher human footprint). Lastly, we tested for local patterns in the geographic distribution of the three variables that were evaluated (geographic range, description year and human footprint) using spatial autocorrelation analyses (Moran’s Index).
Results
We compiled a total of 478 occurrences for 128 of the 129 DD species of amphibians distributed in Colombia, with most records corresponding to only three species: Pristimantis lynchi (5 %), Bolitoglossa lozanoi (3 %), and Vitreorana ritae (3 %) (Table S1, Table S2 and Table S3).
Distribution of the DD amphibians: Colombian DD amphibian species are also known from Costa Rica, Ecuador, Panamá, Perú, and Venezuela. Within Colombia, 60 % of the locality data were documented from Antioquia (77 records), Boyacá (38 records), Caquetá (38 records), Cauca (25 records), Magdalena (25 records), and Valle del Cauca (24 records). Sucre and Quindío departments had the lowest number of occurrences (one record each). Slopes of the Colombian Andes contained most of the occurrences for DD amphibians (Figure 1). Other areas with a high number of DD species were the inter-Andean valleys, the Sierra Nevada de Santa Marta and the Amazonian lowlands (Figure 1). We also found that most recently described (year as a continuous variable) are primarily distributed in the highland Andes (Figure 2).
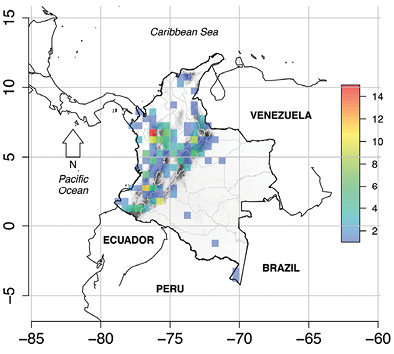
Figure 1 Distribution of the Colombian Deficient Data (DD) amphibian species. Cell size was set to 0.5º × 0.5º. (made by CRP)
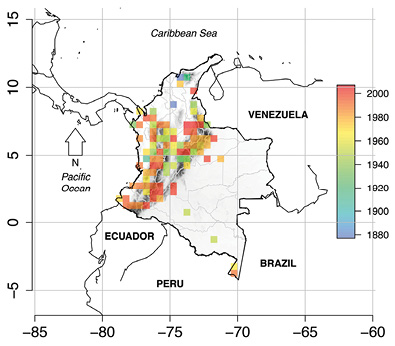
Figure 2 Summary of mean description year for the Colombian Deficient Data (DD) amphibian species. Cell size was set to 0.5º × 0.5º. (made by CRP)
Species distribution and geographic ranges: The 80 % HPO (MaxEnt) was estimated for 58 species that had at least three occurrences. MaxEnt results revealed that 14 species have 80 % HPO ranges smaller than 50 km2(Pristimantis carmelitae, P. cristinae, Caecilia occidentalis, Colostethus imbricolus, Rhinella ruizi, P. scopaeus, Allobates cepedai, Anomaloglossus lacrimosus, Centrolene medemi, P. corniger, P. epacrus, P. apiculatus, P. leucopus, and P. laticlavius; Table S3. However, species as Bolitoglossa phalarosoma, Epicrionops colombianus, Hyloxalus chocoensis, Rhaebo colomai, and Callimedusa perinesos showed estimated range sizes larger than 20 000 km2. The average range size using letsR was 6 000 km2 (Figure 3). We found an exponential relationship between both measurements of range size (MaxEnt vs. letsR; log (80 % HPO) ~ range size: r 2 = 0.9616, P < 0.0001), but no general geographic pattern in the distribution of range size was found by none of the two approaches (MaxEnt or letsR).
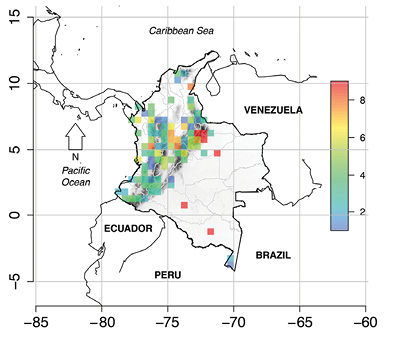
Figure 3 Estimated average range size (degrees) of the Colombian Deficient Data (DD) amphibian species. Cell size was set to 0.5º × 0.5º. (made by CRP)
Human footprint: The estimated values of mean human footprint across populations of the same species ranged from 6.5 % for Caecilia bokermanni to 71 % for Pristimantis apiculatus and Pristimantis ocellatus. The average human footprint across all the analyzed species was 37 %. As expected, the human footprint on DD species showed greater values near the major cities (e.g., Colombian Andes; Figure 4).
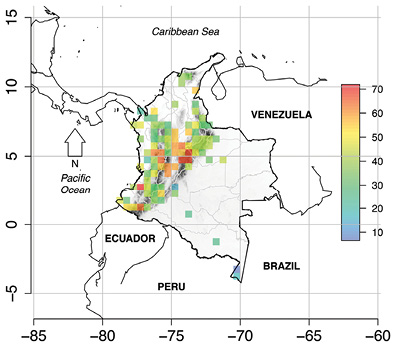
Figure 4 Estimated average footprint percentage on the Colombian Deficient Data (DD) amphibian species. Cell size was set to 0.5º × 0.5º. (made by CRP)
We did not find a significant relationship between the 80 % HPO area and the number of observations (r 2 = 0.0449, P = 0.1133). However, we found a negative relationship between the geographical range size and description year (slope = -11.6133; r 2 = 0.2132, P = 0.0044). The latter suggest that recently described DD species have usually smaller geographical ranges. Human footprint did not show any significant relationship with description year (r 2 = 0.0321, P = 0.074). We also found that both range size and human footprint explained almost 15 % of the variance in description year (r 2 = 0.1419, P = 0.0002).
Lastly, we found a high spatial autocorrelation for all descriptors that were analyzed (description year, range size and human footprint; Figure 5). A significant positive autocorrelation with distance was found in description year (P = 0.0482, Distance = 77.8284 cells; Figure 5A) and range size (P = 0.0001, Distance = 77.8243 cells). This suggest that species occurring more closely in space are expected to have been described in similar years and have similar range sizes. The local pattern in range size is stable up to 120 cells (P = 0.0069, Distance = 120.7643 cells; Figure 5B). Human footprint is significantly similar in closely distributed species within 74 cells (P < 0.05), but this tendency is inverted at distances greater than 174 cells (P = 0.0011, Distance = 174.7679 cells; Figure 5C).
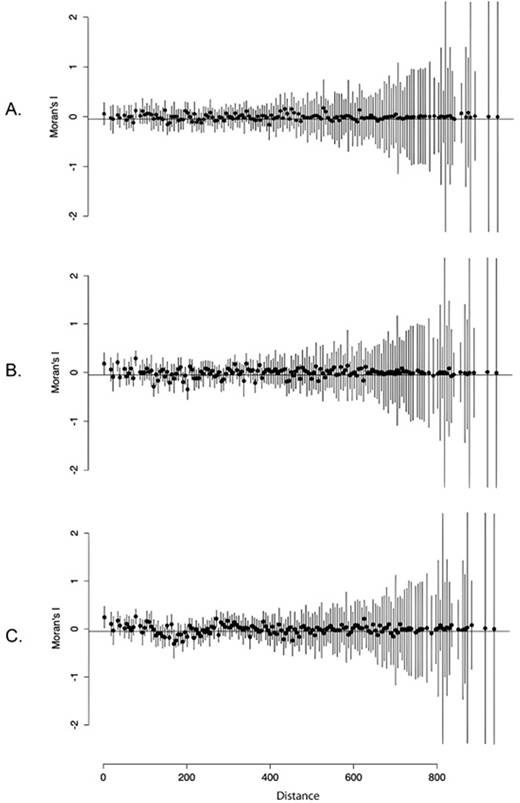
Figure 5 Standardized Moran’s I spatial correlograms for the Data Deficient species of Amphibians distributed in Colombia. Moran’s I range from +1 (perfect positive spatial correlation) to - 1 (perfect negative spatial correlation); where 0 indicates no spatial correlation. A. Year. B. Range. C. Human footprint.
Discussion
Here, we compiled the largest dataset for DD amphibians and explored the relationship between range size, description year, and human footprint. Given that about 16 % of the amphibians in Colombia are currently categorized as DD (128 out of ~813 species) (Acosta-Galvis & Cuentas, 2017), studies that describe the conservation status of DD amphibian species in the country are particularly important. To date, only a few studies have focused on this aspect. First, the red book of amphibians from Colombia reclassifies three DD species as vulnerable to extinction (Bolitoglossa lozanoi, Oophaga occultator and Pristimantis carranguerorum) (Rueda-Almonacid, Lynch, & Amézquita, 2004). Secondly, the regional assessment for Valle del Cauca department suggested reclassifying two DD species to critically endangered and vulnerable categories (Anomaloglossus atopoglossus and A. lacrimosus, respectively) (Castro & Bolívar, 2010). In general, this panorama suggests two things. First, DD amphibians are also easily classified under a different category after further information is analyzed. Second, the conservation status of about 96 % of the Colombian DD amphibians remains to be analyzed.
Our results suggest that most DD species occur in the Andes slopes, with these species also being the most recently described, experiencing the highest human impact, and having the smallest geographical ranges. The approach used here does not weight the human footprint across species based on geographical range sizes. Instead, the estimated values of anthropogenic impact are based on the mean footprint across populations of the same species (Vilela & Villalobos, 2015). A widespread species can occur in multiple cells with low human impact, and conversely, a very geographically restricted taxon can be only present in highly-impacted areas.
Several explanations can be given about why species are classified under a DD category. We highlight that most of the records compiled here for DD species fall within the Colombian political limits (80 % of the analyzed species are only found in Colombia; 102 species). Importantly, the lack of information for most of these DD species prevents the reclassification into extinction risk categories. For instance, multiple DD species have not been registered since its description year, their biology is largely unknown, and are classified in groups with remarkable taxonomic problems. Specifically, most DD species were described between 1950 and 2000, with no additional observations made since the same year (Table S1 and Table S3). In other cases, DD species as Ctenophryne minor and Strabomantis cadenai, were described based on a few individuals from a single locality. We also point out that most of the remaining DD species belong to cryptic species complexes (e.g., Pristimantis, Colostethus, Hyloxalus, caecilians) that usually require some advanced degree of expertise to yield accurate identifications (Butchart & Bird, 2010). Misidentifications of DD species as other taxa can therefore contribute to the apparent rareness of the DD species.
We found that the distribution of DD amphibian richness in Colombia follows also the general distribution of amphibian richness in the country. We suggest that the high frequency of DD species in the Andes probably responds to the elevated frog endemism in the same area. The role of endemism in driving the number of DD species is still to be addressed (Isik, 2011), but is very likely to be strong in the same region. Along the same lines, previous studies have also suggested that most DD species are found within highly diverse regions (Brito, 2010), and this is something that is worth exploring in more depths.
The Colombian Andes are settled on a highly-transformed area where more than 60 % of the natural coverage has been already lost, and where exploitation of natural resources (e.g., copper, gold, nickel, natural gas, petroleum) still threatens the temporal and spatial continuity of the different natural populations (Armenteras, Rodríguez, Retana, & Morales, 2011). Given that amphibians account for 95 % of the endemic species in Colombia, and that the same species are accurate proxies of the impact of human activities on natural populations (Duellman, 1999), we estimated the anthropogenic impact on their populations using the human footprint database. Our results indicated the highest human footprint in populations from the Andean region (mean = 37 %; range = 6.5-71 %). This suggest that human-mediated processes are one of the major the drivers of their rareness in the Andes. However, we do not discard that species’ rareness is actually being driven by other ecological and evolutionary processes that are not evaluated here but explored elsewhere (e.g. niche conservatism).
In summary, most DD amphibian studied here are only known to occur in very restricted localities from the Colombian Andes. The same places were found to have experienced high levels of anthropogenic impact. Based on our results, we highlight that urgent conservation actions must be taken for species that occur in a few localities with elevated environmental degradation. The establishment of wildlife refuges (or “Refugios de Vida Silvestre”), or specific local conservation strategies, might be an optimal solution to minimize the human footprint on these very restricted species. However, we are not aware of specific plans for the ex-situ conservation of any of these species, but we think this is something that is worth considering.
Examples of endangered DD species are Ameerega andina, Centrolene scirtites, Niceroforina colombiana, Pristimantis xestus, and P. susagae. The conservation category for another species such as Cochranella litoralis, Nymphargus chami, Pristimantis ocellatus, P. tubernasus, and P. apiculatus, is also worth reconsidering. Furthermore, species that are restricted to the Sierra Nevada de Santa Marta (Pristimantis carmelitae and P. cristinae) and Chocoan lowlands (Anomaloglossus lacrimosus) are currently classified as DD but might also be classified as endangered. In addition to these species, 14 other DD species were inferred to have very restricted geographical ranges (< 50 km2) (Table S3).
Most of the analyzed Colombian DD species can be considered to be critically endangered based on the criteria listed by the IUCN (2012) and Vie et al. (2008). Again, we highlight that DD species can be easily reclassified under a threat category after a short examination. These conclusions have been reached before by other studies, which have also suggested the DD category masks the real threatened status of many species (Howards & Bickford, 2014; Parsons, 2016). Studies like ours have previously been conducted in other countries to study the conservation status of DD species (e.g., Brazil) (Brito, 2010; Morais et al., 2013; Parsons, 2016). However, we highlight that the problems identified by these kind of studies (i.e., focused on a single country or political region) can be specifically targeted and approached in short periods of time. These studies are also expected to elevate interest and focus the attention of the local communities, governments, and scientists, on these largely “forgotten” species. We encourage researchers, not only from Colombia but from anywhere, to conduct similar or complementary analyses on the DD fauna.

