


 Inglês (pdf)
 Artigo em XML
 Referências do artigo
 Enviar este artigo por email
 Citado por SciELO
  Similares em
SciELO
Similares em
SciELO 
 Permalink
INTRODUCTION
Myxomycetes (plasmodial slime molds or myxogastrids) are amoeboid microorganisms recorded from most ecosystems and under most ecological conditions on the planet (Rollins & Stephenson, 2011). Although they have been documented since the 17th Century (Stephenson, 2011), a large percentage of the available ecological information was not obtained until relatively recently. In most cases, distributional (e.g., Alexopoulos & Sáenz, 1975; Stephenson et al., 1993) and taxonomic (e.g., Farr, 1976; Stephenson, 2003) studies were designed and successfully carried out, but only indirect ecological data were generated as a byproduct of the original investigations. More recently, despite a similar approach, important contributions using molecular techniques for detection have increased the resolution of the analyses (i.e., Shchepin et al., 2019).
Consequently, the ecology associated with the formation of reproductive structures, an important aspect of the myxomycete life cycle in nature, has been moderately, but not completely documented. Fruiting bodies are essential for long-distance dispersal and due to inter-phyla interactions, they can provide information on coevolutionary processes. Fruiting bodies are the most conspicuous structures in the life cycle of myxomycetes and a fundamental expression of evolutionary pressures that have generated changes at the molecular level and expressed them at the reproductive one. In this sense, basic studies generating data to understand the dynamics of myxomycetes at higher levels of organization are essential for a more complete interpretation of their biology.
In most ecological studies of myxomycetes, the idea of ecosystem partitioning is applied at few levels (i.e., mostly just substrates), and it is assumed that the distribution of fruiting bodies is probabilistically equivalent for different subsections of the entire ecosystem. In this manner, an ecosystem is conceptualized, at least for experimental designs, as a continuum of homogeneously distributed myxomycete niches, where fruiting bodies may occur at a given time due to the existence of favorable conditions. However, available data do not support such an idea. For example, in a temperate forest, Rollins & Stephenson (2012) separated the leaf litter microhabitat on the forest floor into four categories and found differences in species richness among these. Stephenson & Landolt (1996) carried out a similar study in two different temperate forests and concluded that nutrient availability and soil conditions influenced the myxomycetes recorded in the different litter layers. In the tropics, Rojas & Doss (2014) recorded different myxomycete species in the first 100 m from the forest edge and concluded that habitat heterogeneity was responsible for the results they obtained.
Given these premises and the interesting ecological influence of ecotones and forest edges on macroorganisms (see Kark, 2013), the idea of studying their effect on myxomycetes is relevant to understanding the ecology of their reproductive stage. Since the existence of ecotones is independent of geographical location but not the level of their effect on organisms, it is also relevant to include such factors in the design of studies. Based on previous studies (e.g., Stephenson, 2011), the contrast of myxomycete assemblages between temperate and tropical forests has been documented but not necessarily with a common experimental design. In the case of these organisms, the occurrence of fruiting bodies is likely affected by environmental conditions, which are different between ecotones or forest edges and the forest core, but the influence of the ecotone on biodiversity parameters has been poorly documented, particularly within the scope of considering different geographical areas.
For those reasons, the main objective of this study was to evaluate, using an experimental approach within the ecotones produced by sharp forest edges, three ecological indicators associated with the myxomycetes present in the leaf litter layer for different geographical locations representing both temperate and tropical forests. This strategy was designed to provide data at different levels of ecological structure such as ecosystem and community, but all within the framework of generating information on the relationships between microorganisms and ecotones for monitoring purposes. According to Smith et al., (1997) and Senft (2009), ecotones are dynamic areas of biological importance, given the underlying mechanisms providing balance in them and thus could be interesting monitoring units for climate change in long-term studies.
METHODOLOGY
The present study was carried out between 2012 and 2016 in six countries, two characterized by temperate forests and four containing tropical ones. In each country, a series of localities was selected based on geographical position and forest type. Based on Rojas & Stephenson (2007), all localities in tropical countries were situated on mountains, to maximize the probability of recording similar myxomycetes to the selected areas in temperate regions. In all cases, sampled forests were dominated by trees in the oak family (i.e., Quercus and Castanopsis) and/or conifers (i.e., Pinus, Abies and Cupressus), which despite being present in different densities, maximized the probability of recording “temperate” myxomycetes. In this manner, all selected locations were considered temperate-like in terms of forest type.
In each locality, a clearly defined edge separating a forested patch from a non-forested area was used as the main criterion for selection. Based on the calculated magnitude of the edge effect by Zhen & Chen (2000) and previous results obtained by Rojas & Doss (2014), the edge effect on myxomycetes was determined to take place in the first 50 m into the forest. In this manner, the ecotone concept, as applied in this study, occurred within this zone. The experimental approach for sampling leaf litter on the forest ground, the only substrate considered in this study, took place accordingly, but habitat partitioning was applied to the study in order to test the hypothesis of homogeneity in results within the ecotone independent of geographical locality or spatial placement (a type of null model) versus the idea of heterogeneity (mechanistic model), as explained earlier, supported by empirical data.
Habitat partitioning took place at both the horizontal and vertical levels of sampling. For the first one of these, three conceptual spaces within the ecotone at each location were predetermined and corresponded with the most external zone (abbreviated as EXT hereafter, depicting the most external ~10 m), an internal zone (INT, between ~11-21 m ) and a parallel one to the forest edge (PAR, exactly at 21 m). The latter was included to test homogeneity at the same distance from the forest edge. For the vertical sampling, two types of leaf litter were predetermined and corresponded with top leaf litter (in direct contact with the atmosphere, abbreviated as top) and bottom leaf litter (in contact with soil, abbreviated as bottom). In each locality, one sample of each type of leaf litter was collected at the forest edge, and following a perpendicular path into the forest, seven more double samples (upper and lower litter) were collected every 3 m (see Fig. 1, top). In this manner, the innermost samples were collected at 21 m from the forest edge. At this point, a 90° turn to either right or left, determined randomly, established the direction of a parallel path to the forest edge, where seven more double samples were collected at the same spatial intervals. The complete collecting path resembled the letter L. The external zone of the ecotone was represented by the first four double samples, and the internal zone by the second four. The parallel zone was divided into two subzones, the first one was represented by the first four double samples from the turning point, including the corner (abbreviated as PAR) and the second one by the last four double samples (CON). The latter positions were included in the design, for normalization of posterior analyses. All temperate forests were visited during the spring (March to June), whereas tropical ones were sampled in the summer (June to August).
Localities
A total of 26 individual localities were surveyed for this study (Figure 1, bottom). The 13 tropical localities were selected in Costa Rica, El Salvador, Honduras, and Thailand, whereas the 13 temperate ones were in Switzerland and the United States. Localities in tropical mountains included: (1) Costa Rica, Talamanca, Las Tablas #1 (LT1), a lower montane oak forest, 8.9237 N 82.7228 W, 1550 m, (2) Costa Rica, Talamanca, Las Tablas #2 (LT2), a lower montane oak forest, 8.9298 N 82.7612 W, 1780 m, (3) Costa Rica, Miravalles Volcano (MV), a premontane wet oak forest, 10.7172 N 85.1502 W, 1063 m, (4) Costa Rica, Salitral de Bagaces (SB), a low elevation dry oak forest, 10.6013 N, 85.2509 N, 161 m, (5) Costa Rica, Barba Volcano, Porrosatí (BP), a lower montane conifer forest, 10.0852 N 84.1084 W, 1920 m, (6) Costa Rica, Barba Volcano, Paso Llano (BL), a lower montane oak forest, 10.0920 N, 84.1077 W, 1980 m, (7) Costa Rica, Jardín de Dota (JD), a lower montane oak forest, 9.7123 N 83.9764 W, 2120 m, (8) El Salvador, Montecristo #1 (ES1), a lower montane pine/oak forest, 14.3866 N 89.3911 W, 1463 m, (9) El Salvador, Montecristo #2 (ES2), a lower montane pine/oak forest, 14.3935 N 89.3857 W, 1615 m, (10) Honduras, La Tigra #1 (HN1), a lower montane pine forest, 14.1755 N 87.1334 W, 1490 m, (11) Honduras, La Tigra #2 (HN2), a lower montane pine forest, 14.1736 N 87.1330 W, 1442 m, (12) Thailand, Doi Suthep (DS), a premontane Castanopsis forest, 18.8066 N 98.9103 E, 1136 m and (13) Thailand, New Waterfall (NW), a premontane Castanopsis forest, 19.1548 N 98.6918 E, 780 m.
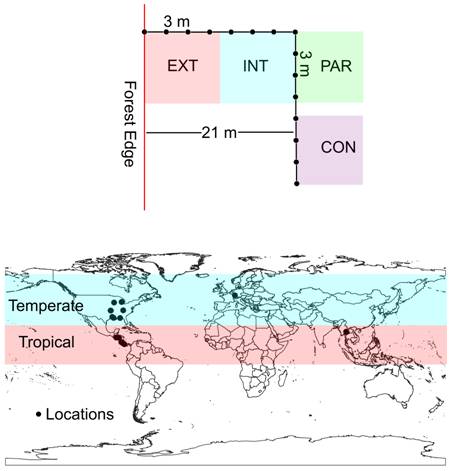
Figure 1 Sampling scheme used in the present investigation (top) in relation in relation to the forest edge showing relative distances between sampling points and zones within the ecotone and general map of locations studied (bottom) showing the tropical and temperate areas. Source: own data.
Temperate localities included: (1) Switzerland, Zäziwil (SW), a premontane temperate fir forest, 48.8951 N 7.6729 E, 714 m, (2) The USA, Michigan, Edmore (ED), a low elevation temperate oak/pine forest, 43.3943 N 84.9973 W, 308 m, (3) USA, Michigan, Winn (WI), a low elevation temperate pine forest, 43.5267 N 84.8980 W, 258 m, (4) USA, Wisconsin, Prairie du Chien #1, (PC1), a low elevation temperate mixed forest, 42.9906 N 91.1176 W, 370 m. 5) USA, Wisconsin, Prairie du Chien #2 (PC2), a low elevation temperate mixed forest, 42.9864 N 91.1293 W, 350 m, (6) USA, Tennessee, Cumberland Gap #1 (CG1), a low elevation temperate mixed forest, 36.6081 N, 83.6740 W, 570 m, (7) USA, Tennessee, Cumberland Gap #1 (CG2), Tennessee, a premontane temperate mixed forest, 36.6065 N, 83.6687 W, 710 m, (8) USA, Arkansas, Eureka Springs (EU), a low elevation temperate oak forest, 36.3926 N 93.7487 W, 390 m, (9) USA, Arkansas, Pea Ridge (PR), a low elevation temperate oak forest, 36.4527 N 94.0009 W, 450 m, (10) USA, Florida, Grayton Beach #1 (GB1), a low elevation temperate pine forest, 30.3534 N 86.1887 W, 10 m, (11) USA, Florida, Grayton Beach #2 (GB2), a low elevation temperate pine forest, 30.3523 N 86.1794 W, 12 m, (12) USA, Louisiana, Maringouin (MA), a low elevation temperate mixed forest, 30.4211 N 91.5308 W, 5 m and (13) USA, Louisiana, Alexandria (AL), a low elevation temperate mixed forest, 31.2602 N 92.6325 W, 80 m.
Data collection and analyses
A total of 780 samples of leaf litter, corresponding to 390 from temperate and 390 from tropical localities, were collected during this study. For each sampling point, the leaf litter layer depth was measured with a ruler and the canopy cover was determined on a 20-100% scale, where 20% corresponded with an open space and 100% with a fully covered one in a similar manner to Rojas & Stephenson (2007). All samples were placed in paper bags and transported to the Engineering Research Institute of the University of Costa Rica where they were used to prepare moist chamber cultures according to the method described by Stephenson & Stempen (1994). The measurement of pH values took place at this point. Climate conditions in the designated laboratory area for the myxomycete fruiting bodies to develop in the moist chambers were measured. These were determined for future studies to have a parameter of comparison of conditions within the laboratory and corresponded with an average temperature of 23.6 °C ± 2.1, air humidity of 73.7% ± 5.4, barometric pressure of 879 ± 1.5 hPa and light intensity of 162 ± 231 lux. Cultures were maintained for up to 12 weeks, checked regularly for myxomycetes and water was added to them when necessary to maintain a moist internal environment. When myxomycetes were found in the cultures, fruiting bodies were extracted and glued to pasteboard boxes, identified to morphospecies and deposited in the Myxogastrid Biorepository of the Engineering Research Institute at the University of Costa Rica. Nomenclature followed Lado (2005-2020).
For analyses, four basic approaches were taken using the number of records, species richness and diversity as response variables. First, a geographical approach was used to test for differences in response variables between temperate and tropical regions. With the results from the United States, a second set of geographical analyses considering latitude and longitude were carried out. The localities surveyed in this case outlined two latitudinal north-south transects in the eastern portion of that country. The second approach was based on the vertical partitioning of the leaf litter microhabitat. In this case, differences in response variables were tested between the two types of litter considered herein. The third approach studied the relative position of sampling points within the ecotone using the zones explained earlier. The fourth approach evaluated differences relative to the sample’s position within the ecotone, and only EXT, INT and PAR were used. The records associated with CON were included later in several post-hoc analyses to test mathematical models of accumulation of response variables based on effort and normalized deviation within ecotone zones. Models were selected based on high correlation values (>0.98) and intended for linear or exponential relationships and deviation was evaluated using averages for each dataset.
For all analyses, statistical tests were carried out on JMP v.10 (SAS Institute, 2007). The number of records and species richness were obtained directly from the results after generating summary tables and the Simpson Diversity Index (reported as 1-D in this case) was calculated according to Magurran (2004). This diversity index was selected over the more common Shannon-Wiener Index because it is much less sensitive to species richness and it is based on dominance over evenness, providing a more appropriate interpretation for data obtained with the technique used herein (moist chamber cultures). Normality was evaluated for all variables included in the analyses using the Shapiro Wilk test, and statistical tests were selected as appropriate. Two sample t-student or Mann-Whitney tests were carried out to evaluate differences between temperate and tropical datasets as well as between leaf litter layers, while analyses of variance were conducted to evaluate differences among results according to the relative position within the ecotone. Two and three-way analyses of variance were used to test the interaction among region, ecotone zone and litter position for each ecological estimator. For all analyses of variance, posterior Tukey tests were carried out to analyze the differences that existed between two factors. In all cases, the cutoff value for the rejection of the null hypothesis was 0.05.
ANALYSIS AND RESULTS
The three main external variables determined during this study were the depth of the leaf litter layer, an estimation of canopy cover, and pH. Differences were found for these three variables when temperate and tropical regions were compared, but differences were not found among positions within the ecotone or litter types within an area. Leaf litter depth had an average of 4.9 cm for temperate forests and 3.7 cm for tropical ones (t=-4.5, d.f.=623, P˂0.0001) and canopy cover values were 47% and 51% (U=1.34, P=0.17). The value of pH was higher in tropical than in temperate forests with averages of 5.9 and 5.8, respectively (t=2.3, d.f.= 623, P=0.01).
A total of 519 samples yielded myxomycetes in the laboratory. Out of the 780 initially collected, that value represented about 66% of all samples. A higher percentage of positive samples was found for temperate regions, with an average of 72% (53-93%) in comparison with the average of 61% (40-80%) for those from tropical regions. In those positive cultures, a total of 625 records of myxomycetes were made, out of which 393 (63%) appeared in material from temperate areas and 232 (37%) from tropical ones. Similarly, of the 71 species recorded in the complete study (see supplementary data), 53 of them (74%) were recorded in temperate localities and only 40 (56%) in tropical ones. Of those, 31 species were only recorded in temperate areas, 18 in tropical ones and 22 were shared among the two.
With an average of 30 records per locality surveyed, the material from temperate regions yielded more myxomycetes than the material from tropical ones (18 records per locality, t=3.57, d.f.=25, P=0.001). This result was evident in the significant differences found when the analysis was performed by litter layer and area, due to the lower number of records associated with the bottom layer in tropical regions (F3,48=15.1, P=0.0003). In these regions, some commonly recorded species such as Didymium squamulosum and Perichaena depressa, were only found in the top litter layer. Similarly, when the results were analyzed by their relative position within the ecotone and area, differences were found in association with a lower number of records in the external zone of temperate localities and the internal zone of tropical ones (F5,67=3.48, P=0.02). For example, species such as Diachaea subsessilis, Oligonema schweinitzii and Physarum globuliferum were recorded only in the internal parts of the temperate forests. When only the set from the United States was analyzed, no differences in the number of records at any level were apparent.
The average number of morphospecies recorded per sample was significantly different between groups (t=4.6, d.f.=59, P˂0.0001) with 8.6 records per sample for temperate localities and 5.3 records per sample for tropical localities. For temperate areas, lower species richness was found in the EXT positions within the ecotone only for the bottom litter samples (F2,9=7.1, P=0.01). For tropical localities, no differences were found in species richness within the ecotone, but some differences were found between litter types (t=3.7, d.f.=29, P˂0.0008), with more morphospecies in the top (6.8 spp. in average) than in the bottom layer (average of 3.8). These differences were not observed across regions, ecotone zones and litter position (F3,3=0.66, P=0.66). For the set from the United States, some differences were found according to litter type (t=2.3, d.f.=29, P˂0.02), with an average of 3.7 morphospecies recorded per sample from the top layer and 4.9 from the bottom one. In this case, species such as Didymium squamulosum and Comatricha pulchella were appreciably more common in the bottom layer.
Table 1 Average values of the three external variables used in the present study and some of the ecological indicators evaluated arranged by region and zone within the ecotone.
| Variable | Regions and sampling positions | |||||
|---|---|---|---|---|---|---|
| Tropical | Temperate | |||||
| EXT | INT | PAR | EXT | INT | PAR | |
| Leaf litter depth, cm | 3.25 | 3.38 | 4.47 | 5.25 | 4.74 | 4.76 |
| Canopy cover, % | 52.2 | 50.3 | 49.1 | 49.7 | 43.3 | 47.1 |
| Substrate pH | 5.9 | 6.1 | 5.8 | 5.8 | 5.8 | 5.8 |
| Number of species (top/bottom) | 17.2/10.2 | 25.2/20.2 | 9.7/4.5 | 10.2/14.5 | 23.5/28.5 | 17.7/18.7 |
| Number of records (top/bottom) | 32.2/13.7 | 72.2/38.5 | 32.4/21.8 | 25.7/34.7 | 74.5/94.7 | 31.5/37.7 |
| Simpson Index of Diversity (top/bottom) | 0.91/0.86 | 0.93/0.92 | 0.86/0.66 | 0.76/0.83 | 0.86/0.90 | 0.91/0.90 |
Note: derived from research.
When the Simpson Index of Diversity was used to evaluate differences a higher average value of 0.81 was recorded in temperate localities versus a value of 0.70 for tropical ones (t=2.7, d.f.= 29, P˂0.008). Similar to the other response variables, some differences were found in the value of the diversity index associated with samples from the bottom litter layer in tropical forests (average of 0.59 vs. 0.88 for all others; F3,56=8.1, P= 0.0001). In relation to their position within the ecotone, the diversity index was lower (average of 0.71) in the upper layer of the EXT zone for temperate forests (F2,9=12.89, P=0.0009). Diversity values also showed overall differences in models considering region and ecotone zone (F3,3=19.5, P=0.0001). No differences were found at any level for tropical forests, for the set from the United States or for the combined model of region, ecotone zone and litter position.
Based on the cumulative models of response variables determined with the data (Table 2), sampling effort in temperate areas could yield 1.7 more records of myxomycetes using field-based methods and morphospecies than the same effort produced in tropical forests. In the case of records, such a value represented the relationship between slope values of the two equations determined in the present study from averages of the two paths from the forest edge (Figure 2), but also matched the relationship between records per geographical region. Interestingly, the same pattern was maintained when either species richness or diversity were analyzed. In these cases, the rate of function growth, explained by the value multiplying the independent variable (x), was always higher for temperate regions and the values for the temperate/tropical relationships were 1.4 and 1.2 for species richness and diversity, respectively. For the United States dataset, results showed that the western transect (WY-AR-LA) accumulated records 1.2 times more rapidly than the eastern transect (MI-TN-FL).
Using the two significant combinations in the diversity analysis, the model constructed with the diversity values associated with the bottom litter layer in tropical regions showed a function growth value of 1.33, which was 0.74 times that of tropical forests and 0.60 times that of temperate forests. Similarly, the function growth value associated with the upper litter layer in the EXT zone of temperate forests (1.35) was 0.61 times the value calculated for temperate forests, 0.70 times the value obtained for the EXT position (1.88) and 0.64 times the value of the PAR position in temperate regions (2.05).
Table 2 Fit models explaining the average accumulation of response variables using effort as an independent variable, by geographical area, calculated using the data from the present investigation.
| Response Variable | Geographical Area | Model Type | Cumulative Fit Model | Pearson´s r 2 |
|---|---|---|---|---|
| Number of records | Temperate | Linear | y=25.19x+5.3929 | 0.99 |
| Number of records | Tropical | Linear | y=13.869x-6.0357 | 0.98 |
| Species richness | Temperate | Exponential | y=37.36(1-e-0.21x) | 0.99 |
| Species richness | Tropical | Exponential | y=33.31(1-e-0.15x) | 0.99 |
| Diversity | Temperate | Exponential | y=89.19(1-e-2.19x) | 0.99 |
| Diversity | Tropical | Exponential | y=87.94(1-e-1.79x) | 0.99 |
Note: derived from research.
When the deviation of response variables in each ecotone zone was evaluated, results showed similar patterns for species richness and diversity. Both indicators displayed an increasing trend from the EXT zone (first 10 m from the forest edge) to the PAR zone (at 21 m from the forest edge) for tropical forests (Figure 3). Data for temperate forests showed the opposite trend, with decreasing trends towards the internal zones (INT and PAR) of the forest for both indicators. These results suggested that in tropical forests, there were more species and higher diversity than average in the internal zones and that for temperate forests, species richness and diversity were higher in the outer zones of the forest. For the dataset from the United States, no differences were found between the patterns of each transect and the general trends for temperate forests.
DISCUSSION AND CONCLUSIONS
The results from the research described herein showed that ecotones in temperate and tropical forests differed not only in terms of myxomycete species present but also in the intensity at which they affect the ecology of these organisms. Even though this research was limited to one substrate type and the identification of taxa was morphological, there seems to be a clear opposite effect pattern from the forest edge on the assemblages of myxomycetes present in temperate and tropical forests. Such effect was also observed at the litter layer, demonstrating that ecological partitioning, as a basis for ecological project design, has the potential of pointing out some undocumented patterns for myxomycetes.
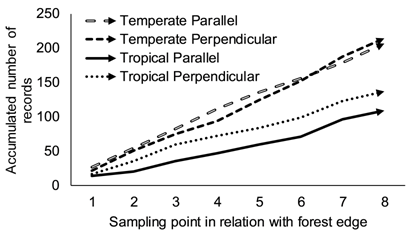
Figure 2 Patterns of record accumulation for the perpendicular and parallel sampling points in both temperate and tropical areas found in this study. Source: own data.
Even though the three ecological variables determined in this study (species richness, diversity and number of records as a proxy for abundance) were different between geographical regions, which could explain some of the differences in myxomycete assemblages, they seemed insufficient to explain the differences between litter types or within ecotone zones. Differences between temperate and tropical regions could be the product of the biogeographical and macroecological patterns of myxomycetes (Stephenson et al.,1993; Dagamac et al., 2017). However, at the substrate and ecotone level, it seems more likely that other abiotic factors such as soil and litter chemistry, topographic or hydrological features and even climate (see Senft, 2009) could explain some of the results found in the present study. Also, the intrinsic limitations of the sampling methodology, where phenology could also have an effect on recorded patterns, should be considered. However, since there are few studies (at least that we are aware of) formally and robustly addressing such topic on myxomycetes; at this point, the potential confounding effect between sampling time in each forest type may actually be unsubstantiated by empirical evidence.
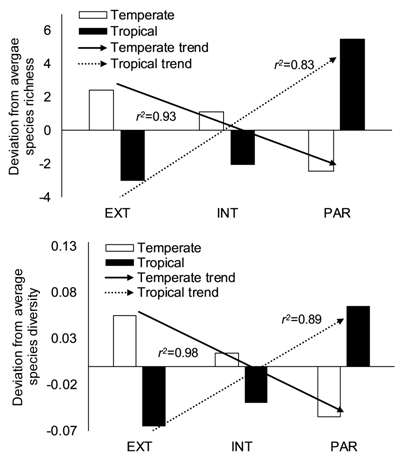
Figure 3 Pattern of species richness (top) and species diversity (bottom) deviation from the average for the EXT-INT-PAR sequence of zones in temperate and tropical areas. The correlation values for the trends are shown. Source: own data.
Despite the latter, any type of biotic interactions among species of myxomycetes and between myxomycetes and other organisms are valuable and should be considered as well for the determination of ecological patterns in ecotones. For instance, competitive interactions between plasmodia of different species, specific vectors of reproductive propagule dispersion and suitability of plants for the formation of fruiting bodies, could be relevant. All these three examples have the ability to modify the intensity of spatial mass effects (distribution of reproductive mass for a species within a determined landscape), commonly occurring in ecotones (see Walker et al., 2003). Such an effect could be a factor linked to the results of myxomycete projects using the methodology of the present study.
The results from this research seem to indicate that data accumulation did not differ from a basic probabilistic model (since there was a steady accumulation of records in all cases), which at the same time provided evidence that the studied forest ecotones, as part of the forests in which they occurred, were suitable habitats for myxomycetes. However, these results were limited in providing support for hypothetical additive blending or a potential ecotonal assemblage of myxomycetes in the localities where the present study was carried out. Even though this is a partial result of the limited experimental design applied to the present investigation, it provides an idea for future research. Previous studies may contain data in such a direction (e.g., Rollins & Stephenson, 2012; Rojas & Doss, 2014), but they are limited in the level of biosystem variability included in the original design, with one common sampling methodology. One aspect to carefully consider in these analyses, is that the linear or exponential relationships observed are only valid at low sampling effort levels (i.e., in the growing part of a species accumulation curve), when curves have not flattened yet.
The observed deviations of both species richness and diversity by ecotone zone clearly demonstrated that, on the basis of the hypotheses being tested in this study, a mechanistic explanation of biological patterns was more appropriate. Within each forest type, differences in the three response variables used in the analyses, as well as in the species assemblages, were recorded for the litter layers considered herein, and some differences were found for the ecotone zones as well. Forest edges have been documented to affect microorganisms in tropical forests by means of increased desiccation and altered nutrient cycling in the soil (Benitez-Malvido & Arroyo-Rodríguez, 2008), a model compatible with the results from the tropical regions in the present study. However, for temperate forests, a different system of mechanisms seems more suitable, perhaps related to some functional advantage at the vegetative stage in outer zones of the forest. In any case, temperate forests represent excellent candidates for testing the idea of enhanced ecotone diversity by means of ecotonal assemblages.
In a similar manner to the results from Dagamac et al., (2017), where the moderate endemicity model of protist biogeography was found to explain large-scale biogeographical differences, a similar mechanism may be shaping myxomycete assemblages at smaller scales. Rollins & Stephenson (2012) had already pointed out that the scale of analysis for myxomycete studies should be revisited methodologically, and empirical (albeit unpublished) data have been collected recently showing support for the same idea. The present investigation has provided more data showing that ecological studies on myxomycetes are particularly useful to provide information on the group and on the interactions between these organisms and their context. For monitoring purposes in a rapidly changing world, these types of basic studies are still imperative.
AUTHOR CONTRIBUTION STATEMENT
The total contribution percentage for the conceptualization, preparation, and correction of this paper was as follows: C.R.A. 30%, R.V.G. 20%, S.S.Z. 20%, A.W.R. 15%, S.L.S. 15%.
DATA AVAILABILITY STATEMENT
The data supporting the results of this study is available as “supplementary files” on the Uniciencia website.

