




 Inglés (pdf)
 Articulo en XML
 Referencias del artículo

 Traducción automática
 Enviar articulo por email
 Citado por SciELO
 Similares en
SciELO

 Permalink


Introduction
Mesenchymal stem cells (MSCs) are undifferentiated cells, capable of self-renewal and associated with high plasticity to produce specialized cells. In general, these cells have shown osteogenic, adipogenic, and chondrogenic differentiation potential (1). Among the populations, the stem cells of the dental pulp (DPSCs) and the stem cells of the periodontal ligament (PLSCs) stand out. These cells are multipotent with broad cell plasticity, immunomodulatory and immunosuppressive capacity, high proliferation, and cell viability, which come from noninvasive and easily accessible sources (1, 2). These attributes give DPSCs and PLSCs the potential to be used as models for studying cell differentiation, such as adipogenesis. Adipogenic differentiation is a process of interest due to its association with insulin sensitivity, endocrine action, and metabolic homeostasis. During adipogenesis, an undifferentiated cell becomes an adipocyte, which is important for maintaining energy balance and storing calories in lipid form (3, 4). During adipogenic induction, several transcriptional factors participate, including peroxisome proliferator-activated receptor gamma (PPARγ) and CCAAT enhancer- binding proteins (C/EBPs) (5). Their activation allows the transcription of genes like as adiponectin and lipoprotein lipase associated with the adipogenic phenotype (5).
On the other hand, several studies suggest that proteins, as ultimate executors of genetic information, could be associated with regulating the adipogenic process, which has increased interest in studying adipogenic differentiation from a proteomic perspective (6). Proteomic tools have been valuable in studying and generate information about protein expression in adipogenesis using various cellular models, such as stem cells derived from adipose tissue (7, 8) and MSCs (4, 9,10,11). However, research is still needed on other stem cell models, such as those of dental origin, which could be attractive candidates for autologous cell therapy. This work aimed to assess the differences between DPSCs and PLSCs from a single donor in their morphology, pluripotency, adipogenic differentiation markers, and protein profile using two-dimensional gel electrophore- sis analysis (2D-E). To accomplish this, DPSC and PLSC cell cultures were established. Both cultures displayed expressions of markers associated with their active self-renewal and plasticity. Comparative 2D-E analysis between DPSCs and PLSCs before and after differentiation shows protein spots that could be the signature of the dental stem cells during their cellular differentiation. Understanding the molecular events inherent in adipocyte differentiation will facilitate the development of therapeutic agents for metabolic diseases, including obesity and diabetes.
Materials and methods
The ethics research committee approved the use of the teeth in the present study of Dr. Hideyo Noguchi, Regional Research Center, Universidad Autónoma de Yucatán (Approval number CIE-06- 2017).
Tissue harvest and culture of dpcs and pdlcs
Sample and cell culture of human third molar teeth were obtained from the Clinics of the Master in Pediatric Dentistry and Oral Surgery, Faculty of Dentistry, Autonomous University of Yucatan (UADY), with previously signed informed consent letters. The periodontal ligament (PL) and the dental pulp (DP) were collected from normal non-impacted third molars from an 18-year-old patient (Figure 1.A). The adhered tissue of the tooth root was separated to with a scalpel to obtain the PL (Figure 1.B), whereas DP tissue was obtained by exposing the pulp chamber with a micromotor (Figure 1.C-D) according to Guerrero-Jiménez et al. (2019) (12). Then, the PD was retrieved using fine-tipped curved dissection forceps to separate the tissue from the pulp chamber (Figure E). Once obtained, each tissue was minced into small pieces (1-2 mm) (Figure 1.F) and placed in 35mm culture dishes containing alpha-modified Eagle’s medium (α-MEM, Gibco, Grand Island, NY, USA) supplemented with 15% fetal bovine serum (FBS, Gibco, USA) and 1% antibiotic (penicillin/streptomycin, Gibco, Grand Island, NY, USA) and subcultured in a T-25 flask. Morphological characterization of dental cell lines was performed using an inverted phase contrast microscope (Labomed, TCM 400 Model).
Cell growth and colony-forming assays
Discovering the growth features of the cultures derived from DP and PL was aimed to identify the dynamics of cell populations under in vitro conditions. To obtain the proliferation curve of the cells derived from DP and PL, 1×10⁴ cells/mL from cell passages 2 and 4 (P2 and P4) were seeded in 35mm petri dishes (two technical replicas per tissue) with 1mL of α-MEM medium supplemented with 10% FBS and 1% of the antibiotic/ antimycotic solution, changing the medium every two days. The growth of the in vitro cultures was monitored on days 2, 4, 6, 8, 10, and 12. The cell number and viability were assessed after 14 days by trypsinization (three replicates for each time point), stained with trypan blue (0.4% in PBS 1X) (PBS 1X: 138 mM of NaCl, 3 mM of KCl, 8.1 mM of Na2HPO4, and 1.5 mM of KH2PO4, pH=7.4), and counted using a hemocytometer under a light microscope. The growing assay was made by the Colony Forming Unit (CFU) assays, plating at a density of 300 cells/dish (35mm diameter) and cultured in basal medium (α-MEM medium supplemented with 10% FBS) for 14 days under standard culture conditions. All cell cultures were fixed for 10 min with 5 mL of 4% paraformalde- hyde (PFA, Sigma-Aldrich, St. Louis, MO, USA) and stained with 0.05% crystal violet (Sigma-Aldrich, St. Louis, MO, USA). The cells were washed twice with distilled water, and the number of colonies was registered. Fifty or more clustered cells were considered colonies.
In vitro stem cell differentiation
To induce adipogenic differentiation, DPSCs and PLSCs at a density of 2x10⁴ cell/well at passage 4 (P4) were seeded into a six-well plate until 80% confluence was reached and cultured in the adipogenic medium (growth medium containing insulin (1.7 µM), dexamethasone (1 µM), 3-isobu- tyl-1methylxanthine (500 µM), and indomethacin (60 µM)) for 21 days. The medium was refreshed every two days. Morphological changes were evaluated in both cell populations at 7, 14, and 21 days of induction, keeping a photographic record. Subsequently, cells were fixed in 4% PFA, rinsed twice with 1X PBS, and stained with 0.1% oil red O (Sigma-Aldrich, St. Louis, MO, USA) in propanol for 5 min, and the intracellular lipid droplets were evaluated using an inverted phase contrast microscope. The stained area of the cell cultures after Oil Red O staining was quantified in terms of percentage using ImageJ software (National Institute of Health). For osteogenic differentiation, 2x10⁴ cells/well were seeded plate and cultured in proliferation medium (α-MEM medium + 10% FBS) supplemented with 50 µM of ascorbic acid, 10mM of β-glycerophosphate, and 10nM of dexamethasone (all purchased from Sigma-Aldrich, USA) for two weeks, as described by Gopinathan et al. (2013). After osteogenic induction, cells were fixed with 4% PFA for 15 min at RT, and mineral formation under differentiation was identified by staining with 2% alizarin red S (Sigma-Aldrich, St. Louis, MO, USA). An inverted microscope (Labomed, TCM 400 Model) was used to capture digital images.
Reverse transcription PCR (RT-PCR)
RT-PCR was performed to measure the levels of mesenchymal stem cell markers (CD73, CD90, and CD105), pluripotency-associated gene expression (NANOG, OCT4, KLF4), and adipogenic markers (PPARγ and ADIPOQ). Total RNA was isolated from dental stem cells (passages 2 and 4) using a Direct-zol RNA kit (Zymo Research) according to the manufacturer’s instructions. For cDNA synthesis, reverse transcription reactions were performed with 1 µg of RNA using the SuperScript First Strand Synthesis System (Invitrogen, Carlsbad, CA, USA) following the manufacturer’s instructions. MyTaq™ DNA Polymerase (Bioline, UK), 1 µM of each primer, and 50 ng/µL of cDNA in a 25 µL volume were used during PCR with the C1000 Touch Thermal cycler (BIO-RAD, Foster City, CA, USA). The PCR products were electrophoresed in a 1.5% agarose gel and stained with ethidium bromide (Sigma-Aldrich, St. Louis, MO, USA). Images were acquired using the Gel Doc Xr+ System (BIO-RAD). β-Actin was used as loading control.
Protein extraction and 2D-E gel electrophoresis.
For analysis of proteome profiles, DPSC and PLSC at passage 4 were seeded into six-well plate and cultured in standard conditions with α-MEM (Life Tech. Inc., USA) supplemented with 10% fetal bovine serum (USA), 37°C, 5% CO2. When the cells reached 80% confluency, the medium was changed to adipogenic medium. After 21 days of induced adipogenic differentiation, control and differentiated cells were lysed with Mammalian Protein Extraction Reagent (MPEB) (GE Healthcare) supplemented with 1X protease cocktail inhibitor (Thermo Fisher Scientific). The lysates were sonicated three times for 20s with 40% amplitude using U200S sonicator (IKA Labortechnik, Germany) and then centrifuged at 20,000 x for 30 min at 4ºC. Proteins were cleaned by acetone precipitation (EM grade; EMS, Hatfield, PA, USA) and were resuspended in 150µl rehydration buffer without ampholytes (7 M Urea, 0.2 M thiourea, 4% CHAPS, 40 mM DTT). Protein concentration was determined by the Peterson modification of the Lowry assay (13). To ensure an optimal focusing of the proteins, an ampholyte solution of pH 3-10 was added in a concentration of 0.2%, and the samples were loaded into Zoom Runner system (Ready strip IPG, 7cm, Bio-Rad) by rehydration for 60 min at RT. The strips were rehydrated and focused with the following parameters: 250 V for 20 min, 4000 V for 2 h, and finally 20000 V for 1h. After IEF, the strips were equilibrated with 2% DTT and 2.5% iodoacetamide for 15 min in equilibration buffer containing 6M urea, 20% glycerol, 10% SDS, and 0.375 M Tris-HCl (pH 8.8). Gels were run in Laemmli electrophoresis running buffer 1X (25mM Tris base, 1.92 M glycine, and 0.1% SDS). Protein spots were separated in 12% SDS- polyacrylamide gels (8x8 cm) for 90 V at 2.5 h. Then, proteins were visualized using Coomassie brilliant blue G-250 staining. The images of the electrophoresis gels in second dimension (2D) were obtained from a photodocumenter (BIO-RAD) and the PDQuest software package (BIO-RAD) to visualize the protein stains on polyacrylamide gels (SDS-PAGE stains). SDS-PAGE spots were analyzed with SameSpots 5.1.012 software and Malenie 9 software. The spots were then matched with their homologs in the protein isoelectric point database (PIP-DB: http://www. pip-db.org/), and the candidate human proteins were determined.
Statistical analysis
The data were analyzed and expressed as the mean ± standard deviation. Student’s t-test was used to calculate significant differences in relative abundances of protein spot features in DPSCs compared with PLSCs. Statistical significance was evaluated by independent samples t-test using Sigma Statistics software. Statistical significance was set at P<0.05.
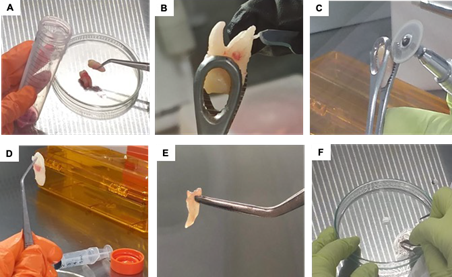
Figure 1 Processing of the dental organ for dental tissue dissociation. (A) Extracted third molars were washed and disinfected with a PBS solution supplemented with antibiotic and antimycotic. (B) Harvesting of the periodontal ligament using a scalpel. (C) Mechanical processing of the third molar using a micromotor equipped with a rotating disk; (D) Dental pulp found in the exposed pulp cavity. (E) Harvesting of the dental pulp using dissecting forceps. (F) Mechanical tissue dissociation of the dental pulp and the periodontal ligament into 1-2mm fragments for subsequent cultivation with α-MEM medium supplemented with 10% FBS and 1% antibiotic-antimycotic solution.
Results
Comparison of the proliferative capacity of cells derived from the dental pulp and the periodontal ligament
Primary cultures of DPSCs and PLSCs were successfully established following the outgrowth tissue method. The first plastic-adherent cells were detected from both cultures between 6 and 10 days. Morphological analysis of DPSCs and PLSCs indicated the presence of cells with a large, flattened, or fibroblast-like shape (Figure 2.A). No notable changes in morphology and growth characteristics were observed throughout the passages. Cell proliferation was examined by counting cells at P2 and P4. The growth curve showed a maximum cell concentration for both passages on the 12 days of culture (Figure 2.B). The PLSCs demonstrated high potential replication compared with DPSCs (Figure 2.C). This suggests that DPSCs and PLSCs are stable over time under in vitro conditions.
The CFU assay is the most widely used test to analyze the clonogenic potential of isolated MSCs. Therefore, we performed a CFU on both cultures, which showed that both cultures form clonogenic colonies (Figure 2.C).
Expression of surface and stem cell- related markers in dental cells
To gain insights into the stem cell properties of PLSCs and DPSCs, we surveyed the expression of surface (CD105, CD90, and CD73) and stem cell-related markers (NANOG, OCT4, and KLF4) at P4 cultures in control conditions. RT-PCR showed the expression of CD90 in both dental lines, while CD105 displayed significantly higher levels of mRNAs in PLSCs compared with DPSC (Figure 2.D). In the case of CD73, a dental stem cells-specific marker showed a lower expression in PLSCs compared with DPSCs. Regarding OCT4, NANOG, and KLF4 expression, PLSCs showed higher expression of these markers than DPSCs (Figure 2.E).
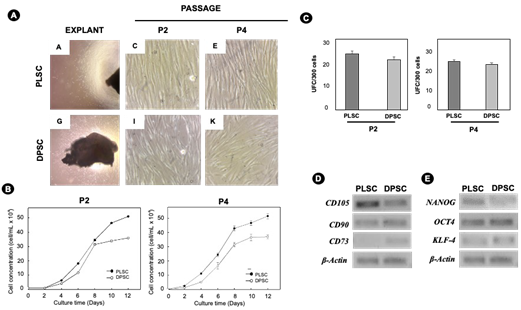
Figure 2 Isolation, proliferation, and gene expression of markers of PLSCs and DPSCs. (A) Isolation of PLSCs and DPSCs using the outgrowth from tissue explants derived from the third molar of a single donor (original magnification 4x). During cell expansion, PLSCs and DPSCs showed a typical fibroblast-like morphology. (B) The unit-forming colony assay of PLSCs and DPSCs was done after 12 days of culture. (C) Growth kinetics of PLSC and DPSCs cultures in α-MEM + 10% FBS for 12 days at a 1 × 10⁴ cells/well density during passages 2 and 4 (P2 and P4). Error bars represent the standard deviation of the mean (p < 0.05). (D) Mesenchymal stem cell markers, including CDC105, CD90, and CD73, and (E) pluripotent markers, including NANOG, OCT4, and KFL-4, were detected at P4 in PLSCs and DPSCs. β-actin were used as a loading control.
Differentiation assays
To evaluate the multipotential characteristics of DPSCs and PLSCs, osteogenic and adipogenic differentiations were performed (Figure 3). Osteo- genic differentiation of DPSCs and PLSCs was confirmed with alizarin red staining. DPSCs produced a dense layer of uniform mineralization, while PLSCs created nodules with areas of high density but surrounded by areas without staining (Figure 3.C and Figure 3.D), which indicates that there are different biological fingerprints between both populations. DPSCs and PDLSCs were also capable of under- going adipogenic differentiation in response to treatment with adipogenic-inductive supplements for 14 days (Figure 3.E and Figure 3.F).
On the other hand, to monitor the progress of adipogenic differentiation, a schematic diagram of the experimental was developed, as shown in Figure 4.A. The morphological results showed that the PLSCs formed cellular aggregates with irregular/spherical morphology from day 7 for PLSCs of induction while in the DPSCs until day 14 (Figure 4.B). After 21 days of culture with an adipogenic medium, PLSCs developed more oil red O positive lipid-laden fat cells than DPSCs (Figure 4.Bc-Figure 4.Bg). The morphological observation was confirmed by a quantitative analysis of the area stained with oil red O, which confirmed a higher adipogenic potential in PLSC (2.5%) than in DPSC (1%) (p<0.05) (Figure 4.C).
Adipogenic markers expression
Adipogenesis in MSCs involves different transcriptional factors that regulate the expression of genes associated with the adipogenic phenotype. PPARγ and ADIPOQ are used as adipogenic differentiation marker genes. PPARγ is considered a master regulator of adipogenesis, while ADIPOQ is a protein secreted by mature adipocytes (14) and involved in lipid accumulations. Hence, the expression levels of PPARγ and ADIPOQ in DPSCs and PLSCs were profiled by RT-PCR. The expression of PPARγ in PLSCs gradually increased at days 14 and 21, while in DPSCs, it occurred up to 21 days. Interestingly, with adiponectin, an increase in gene expression could be observed 14 days after adipogenic induction in both cell populations (Figure 4.D). These findings are consistent with the strong capacity of PLSCs compared to DPSCs to synthesize lipids, as demonstrated by multilocular droplets staining with Oil Red (Figure 4.B).
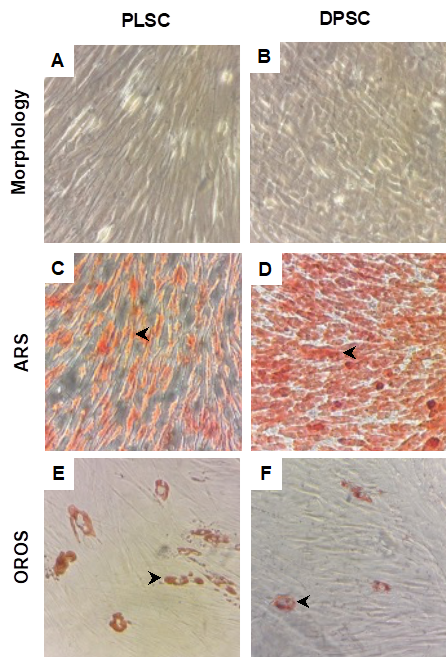
Figure 3 Proliferation and differentiation capacity in PLSCs and DPSCs. The differentiation capacity of DPSCs and PLSCs was determined by osteogenic and adipogenic differentiation using induction media and specific staining. (A, B) PLSCs and DPSCs control cultured in basal medium for 14 days and 21 days. (C, D) Osteogenic differentiation was determined by Alizarin Red Staining (ARS) of calcified mineralized matrix (black arrowheads) after 14 days of osteogenic induction. (E, F) Adipogenic differentiation was determined by Oil Red O Staining (OROS) of lipid droplets (black arrowheads) 21 days after adipogenic induction. These experiments were done in duplicate two times during P2 (n=4).
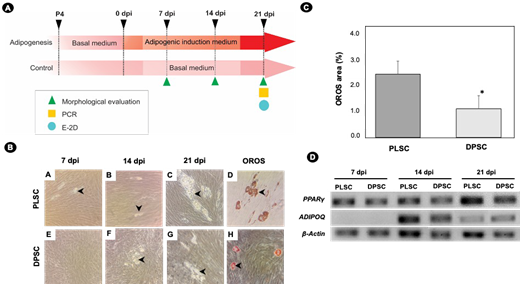
Figure 4 Adipogenic differentiation of PLSCs and DPSCs. (A) The schematic diagram of the experimental setup. PLSCs and DPSCs were induced to differentiate using an adipogenic induction medium for 21 days. Morphological evaluation by OROS, endpoint PCR, and two-dimensional electrophoresis (2D-E) was done 21 days post-induction (dpi). (B) Lipid droplet generation during adipogenic induction of PLSC and DPSC; black arrowheads indicate the presence of lipid droplets in dental stem cells at 7,14, and 21 dpi. Adipocyte cells with lipid droplets were exhibited using OROS at 21 dpi (black arrowheads). (C) Quantification of OROS in PLSCs and DPSCs; quantification was done by estimating the percentage of surface covered with OROS at 21 dpi. Error bars represent the standard deviation for mean from two independent experiments by duplicate; significant differences were detected between the groups (*) (p<0.05). (D) Gene expression profile by RT-PCR of adipogenic markers at the indicated time.
Profiling of proteins in response to adipogenesis using two-dimensional gel electrophoresis analysis
To compare the proteins expressed in PDSC and PLSCs from the same donor, 2D-GE analysis was performed. Multiple 2D-GE SDS-PAGE gels were made to represent two biological repeats with two technical replicates. The reference map contained 39 protein spots in both DPSCs and PLSCs and was populated between pI from 4 to 8 and from 16 to 150 kDa molecular masses (Figure 5.A). Ten differential spots were identified with at least a 1.25-fold change and with P<0.05 at the one-way ANOVA test (Table 1), and the functions of the matched proteins of both lines were revealed using the UniProt database. A total of 39 proteins were identified in the DPSCs; however, only three spots differed in their expression from the undifferentiated stage (D0) and the differentiation stage (D21). Spot #37 was up-accumulated, while spots #20 and #21 were down-accumulated, being the identity of the proteins Isoform 4 of Histone-binding protein RBBP4, Protocadherin Fat1, and SRCA_HUMAN Sarcalumenin, respectively (Figure 5.B and Figure 5.C and Table 1). These proteins are associated with biological processes, among which are chromatin remodeling factor and cellular migration (15). In the case of PLSC, four protein spots were identified. Two spots were differentially up-accumulated (#17 and #18), and two spots were down-accumulated (#31 and #15). These proteins are involved in mitochondrial oxidative metabolism, which is important within MSC differentiation (16). The partial overlapping of stain patterns and their accumulation suggest that differentiating DPSCs and PLSCs might have different and specific molecular pathways toward their commitment to adipogenesis in dental tissue stem cells.
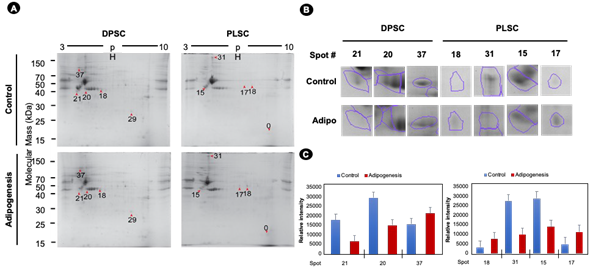
Figure 5 Two-dimensional gel electrophoresis profiles of DPSCs and PDLSCs after 21 dpi. (A) After adipogenic differentiation, the red arrowheads indicate differential protein spots in dental stem cells. 2D-E was conducted using 7 cm pH 3-10 IPG strips. The two-dimensional gel electrophoresis (2D-GE) analysis was done with Melanie 9 software, using protein spots that do not change their intensity between the gels for normalization. (B) Close-up of protein spots. Each protein spot was compared to the undifferentiated DPSCs or PLSCs. (C) The relative intensity of differential protein spots. Bars show the standard deviation.
Table 1 Differential spots in dental tissue stem cells undergoing adipogenesis.
| Cells type | Spot | Ratio Control/ Adipoge- nesis | Anova (p) | Experi- mental Mr ⁄pI | Proteome- pI Mr ⁄pI* | UniProt entry | UniProt annotation |
|---|---|---|---|---|---|---|---|
| DPSCs | 21 | 2.3 | 0.0066 | 40/4.1 | 40/4.2 | H0Y9H4 | HUMAN Isoform of Q14517 Protocadherin Fat 1 |
| - | 20 | 4.5 | 0.0241 | 43/4.8 | 43/4.7 | P54727 | RD23B_HUMAN UV excision repair protein RAD23 homolog B |
| - | - | - | - | - | 43/4.8 | A2RRC6 | HUMAN Isoform of Q9C0A1 ZFHX2 protein |
| - | - | - | - | - | 43/4.8 | Q09028-4 | RBBP4_HUMAN Isoform of Q09028 Isoform 4 of Histone- binding protein RBBP4 |
| - | 37 | 1.8 | 0.0350 | 101/4.3 | 101/4.3 | P54727 | SRCA_HUMAN Sarcalumenin |
| - | 29 | 1.2 | 0.0411 | 26/7.7 | 260/7.7 | C9JKR8 | HUMAN Isoform of Q8N5Y2 Male-specific lethal 3 homolog |
| - | - | - | - | - | 26/7.6 | O75391 | SPAG7_HUMAN Sperm-associated antigen 7 |
| - | - | - | - | - | 26/7.6 | Q8TD07-2 | N2DL4_HUMAN Isoform of Q8TD07 Isoform 2 of NKG2D ligand 4 |
| PLSC | 18 | 1.2 | 0.0526 | 42/5.7 | 42/5.7 | H0YBG8 | HUMAN Isoform of Q9UKQ2 Disintegrin and metalloprotei- nase domain-containing protein 28 |
| - | - | - | - | - | 42/5.8 | A0A0A0MQX7 | HUMAN Isoform of Q08629 Testican-1 |
| - | - | - | - | - | 42/5.8 | Q9H0C1 | ZMY12_HUMAN Zinc finger MYND domain-containing protein 12 |
| - | 31 | 4.4 | 0.0195 | 273/4.8 | - | - | - |
| - | 15 | 2.3 | 0.0240 | 46/4.4 | 46/4.5 | Q96JB5-2 | CK5P3_HUMAN Isoform of Q96JB5 Isoform 2 of CDK5 regulatory subunit-associated protein 3 |
| - | 17 | 2.6 | 0.0409 | 52/7.3 | 52/7.2 | O75306 | NDUS2_HUMAN NADH dehydrogenase (ubiquinone) iron- sulfur protein 2 mitochondrial |
| - | 0 | 1.7 | 0.0444 | 17/8.7 | 17/8.7 | Q9Y281-3 | COF2_HUMAN Isoform of Q9Y281 Isoform 3 of Cofilin-2 |
| - | - | - | - | - | 17/8.7 | - | H3BR94 |
* A database of pI database (Kozlowski LP 2006 Nucleic Acids Res. 2016. doi: 10.1093/nar/gkw978
Discussion
Recent findings have suggested that DPSCs and PDLSCs are valuable sources of cells for the development of regenerative therapies due to their multilineage capacity (17,18). The present study performed a comparison of the multipotent characteristics and proteomic profile between two types of dental MSCs isolated from a single donor tooth. MSCs isolated from pulp and periodontal ligament tissues were compared based on their proliferation rate, expression of pluripotency markers, adipogenic differentiation capacity, and protein profile using 2DE. MSCs are characterized by a high proliferative capacity, however, there are variations in features associated with the origin of these stem cells (19), so it is considered necessary to evaluate this property in vitro cultures of PDLSCs and DPSCs from a single donor. Our results revealed that these cells had similar morphology (elongated fibroblast-like cells) but showed a different rate of proliferation (Figure 2.B), which is consistent with previous reports (20,21,22). PLSCs showed a better adaptation to in vitro proliferation conditions compared to DPSCs in the same cell passages (Figure 2.B). This behavior is correlated with a better adaptive response of PLSCs to mechanical stress in vitro (23). For example, PL is a tissue that is part of the periodontium, and that there- fore is subject to constant mechanical stress due to the movements generated during the chewing process (24,25), while DPSCs generate odontoblasts and can be found in a more quiescent state, (26) with respect to PLSCs. Likewise, DPSCs and PLSCs showed typical MSC properties, such as self-renewal, clonogenic capacity, and expression profile of mesenchymal markers, supporting the presence of stem cell populations (Figure 2) (27). Recently, the cell surface markers STRO-1, CD73, CD90, CD105, and CD146 have been reported to be suitable for identifying putative MSCs (28). Of these markers, we examined CD105, CD90, and CD73 expression in this study. In previous works, the positive expression of CD73, CD90, and CD105 in PLSCs and PDSCs has been reported (29,30,31). However, it is important to highlight the increased expression levels of CD105 in PLSC, which could be attributed to the biological characteristics of LP and PD. CD105 plays an important role in angiogenesis (32). This is relevant because LP has a higher capacity for blood vessel sprouting (a process linked to angiogenesis), compared to PD (33), which could partly explain this finding. Self-renewal and pluripotency are the central characteristics of stem cells, in which pluripotency genes such as OCT4 (Octamer-binding transcription factor 4) and Nanog maintain self-renewal and suppress differentiation-associated genes, thus maintaining cell pluripotency (34). The detection of OCT4 and NANOG expression in human MSCs from oral cavity is consistent with earlier reported data by our group and other authors (20,35). In our study, NANOG had a higher expression in PLSCs compared to DPSCs. This contrasts with a previous observation (36) where a low expression of NANOG was noted in PDLSCs. Several authors have reported that the expression of ESC markers in MSCs can vary depending on the source from which they are obtained under in vitro culture conditions (34,37). Although both cell lines show a similar phenotype, this difference in expression in NANOG could be due to a heterogeneous mixture of stem cells in DPSCs that present differences in their self-renewal capacity and potentiality (38,39).
Like MSCs from other sources, cells of dental origin can differentiate into multiple cell lineages under appropriate in vitro conditions. Our results showed that both populations PLSCs and DPSCs had the capacity to form mineralized material in vitro under osteoblast-inductive conditions; however, they presented different patterns of mineral deposition. For example, DPSCs produced a dense layer of uniform mineralization compared to PLSCs. These different “fingerprints” of mineralization that they generate in vitro are the result of the differentiation mechanism that they develop (40). For example, DPSCs are responsible for the formation of dentine tissues (18,41) and the biomineralization of the tooth (26,42), while PLSCs generate cementoblasts that provide an anchorage of the ligament to the tooth (18).
To analyze the response to adipogenic differentiation between DPSCS and PDLScs, an adipogenic assay was performed to monitor cell morphology and expression of adipogenic markers (PPARγ and ADIPOQ) (Figure 4). Concerning morphology during induction, PLSCs showed an earlier shift from fibroblastic/spindle shape to a spherical cell shape during differentiation, representing a clear sign of adipogenic differentiation (43). While staining with oil red O revealed low adipogenic potential in DPSC (small lipid droplets), according to recent reports (44-49). In support of these findings, we observed that the expression of PPARγ mRNA was higher in PLSCs at days 14 and 21 but not in DPSCs. This interpretation is consistent with the fact that PPARγ expression levels determine the adipogenic potential (45) and that the levels of ADIPOQ are closely related to the expression levels of the PPARγ gene. For example, Xu et al. (2019) reported that PLSCs expressed higher expression levels of genes associated with adipogenic differentiation compared to DPSCs. This has been explained because DPSCs in human models express genes that inhibit adipogenic differentiation, such as the WNT10B gene (47). Likewise, another factor that our group has reported to explain these differences is the high expression levels of DNA methylation-related enzymes such as DNA methyltransferases (DNMT1, -3A) and ten-eleven translocation (TET1 and TET2) proteins, which could be interrupting the transition of DPSCs, but not PLSCs, toward adipocytes (50). Our previous results demonstrate that DPSCs and PLSCs differ in their adipogenic potential, although they share some mesenchymal characteristics. Therefore, we wondered if there were differences in the protein profile of DPSC and PDLSC during adipogenic differentiation. In total, 39 proteins were identified in both lines.
When comparing the DPSCs with PDLSCs protein profile, we observed no similar proteins in each line. The differentiating DPSC showed changes in its expression in only three proteins (RBBP4, Protocadherin Fat 1, and Sarcalumenin) compared with the control (undifferentiated). RBBP4 is a chromatin remodeling factor, and its activity is correlated with the activation of the Wnt/β-catenin pathway (51). The Wnt/β-catenin pathway is a molecular switch that, when activated, inhibits adipogenesis by repressing PPARγ induction and CEBPA (52,53). In this sense, an increase in the expression of RBBP4 could be generating an effect on the activation of the Wnt/β-catenin signaling pathway and, consequently, a reduction in the levels of expression of PPARγ in DPSCs, as seen in this work. Recent work from several groups has elucidated the importance of the canonical Wnt/β-catenin signaling pathway and adipogenesis in stem cells (53,54). All results collectively allow us to hypothesize that the RBBP4 protein is an important component in regulating gene trans- cription in terminal differentiation to mature adipocytes in DPSCs. For this reason, the role of RBBP4 in the adipogenic differentiation of DPSCs should be explored in depth.
Interestingly, we identified an increase in the expression of spots #17 and #18 in PDLSCs, which could correspond to a calcium-binding mitochondrial carrier protein (SCaMC) and NADH dehydrogenase (ubiquinone) iron-sulfur protein 2 (Table 1). Intracellular calcium and mitochondrial oxidative metabolism status has been reported as a modulator of adipogenesis (55,56,57). For example, it has been observed that changes in cytosolic Ca²2+can increase or decrease the response toward differentiation depending on the stage of adipogenesis in the murine model (55). SCaMC has not previously been identified in the PLSC proteome, although it has previously been associated with other MSCs (55). This finding could infer that SCaMC-3 is a molecular component in the adipogenesis mechanism in PLSCS.
In the literature, there are no reports of the proteome during adipogenesis in this type of cell, so we had the limitation of contrasting our results. However, our findings could infer that the differences in the proteome in this type of cells would explain the differential response toward adipogenic compromise in vitro in the same donor.
Conclusion
In summary, this study is the first to compare the cellular and protein characteristics of two types of dental stem cells derived from an individual donor. The differences in the expression of the proteins detected during adipogenesis in DPSCs and PLSCs suggest that they could contribute to the commitment toward generating adipose lines. However, the differences reported here should be confirmed in future studies.
Author contribution statement
Conceptualization: B.A.R.J.
Writing-original draft preparation: T.H.S., J.A.M.U.,
V.A.H. and G.N.C.
Methodology: J.A.M.U. and L.B.A.
Data curation: J.A.M.U. and V.A.H.
Writing-review and editing: B.A.R.J. and T.H.S.
All authors have read and agreed to the published version of the manuscript.

