




 Inglês (pdf)
 Artigo em XML
 Referências do artigo

 Tradução automática
 Enviar este artigo por email
 Citado por SciELO
 Similares em
SciELO

 Permalink


Introduction
Soybean (Glycine max (L.) Merr.) is an important legume crop ranked as the third most important food crop in Indonesia, after rice and maize (Tasma et al., 2018). Soybean seeds contain approximately 40 % protein and 20 % oil, making them a valuable source of nutrients for foods, feeds, and industrial applications (Kumar & Pandey, 2020). In addition to their high protein and oil contents, soybean seeds contain several bioactive compounds such as omega-3 fatty acids, peptides, saponins, phytosterols, and isoflavonoids, which provide significant health benefits to humans (Li & Qi, 2022). Due to their suitability for food processing, particularly in products such as tofu, tempeh, and soy milk, yellow-seeded soybean varieties are widely preferred by farmers and consumers (Abadi et al., 2022; Gebregziabher et al., 2023).
Improving soybean productivity and quality is a major objective in breeding programs, particularly through the development of superior genotypes with desirable agronomic traits, including high yield and favorable yield components. Genetic diversity plays a crucial role in achieving this objective because it provides the foundation for selecting parents with complementary traits and for broadening the genetic base of breeding populations (Wibisono et al., 2025). Therefore, available soybean genetic materials should be characterized at both the morphological and molecular levels to obtain a more comprehensive assessment of the genetic diversity present within the targeted genotypes.
Morphological traits represent observable and measurable characteristics that can be used to identify and map genotypic relationships. However, genetic performances analyzed based solely on morphological traits have an important limitation, namely the influence of environmental conditions that affect the stability of these morphological traits (Shrestha et al., 2023). This limitation can be overcome through the use of molecular markers for genetic analysis of different soybean genotypes, including the ones that are genetically related (Tasma et al., 2001; Tasma & Shoemaker, 2003).
Molecular characterization is a method that can be used to broadly determine the variation and relationships among uncharacterized soybean genotypes (Malek et al., 2014). Characterization of soybean genotypes using molecular markers is faster and more accurate than that obtained from morphological characters, as molecular markers are not influenced by environmental factors (Kumawat et al., 2015). Consequently, the genetic diversity resulting from molecular marker characterization can be used as supporting data to complement information obtained from morphological characterization (Terryana et al., 2018)
Molecular markers are specific DNA sequences that exhibit polymorphism among plant genotypes identified molecularly and are often associated with particular traits or genes (Tasma et al., 2001; Tasma & Shoemaker, 2003). Molecular markers are used as genetic markers that facilitate the identification of regions associated with desirable characteristics such as disease resistance, increased yield potential, and adaptation to environmental stresses (Meena et al., 2023). Based on their detection methods, molecular markers can be classified into three major categories: polymerase chain reaction (PCR), hybridization and DNA sequencing (Guler & Imamoglu, 2023). Among the PCR-based markers, simple sequence repeat markers are among the most widely used (Tasma et al., 2001; Wibisono et al., 2025). Therefore, the present study aims to analyze the genetic diversity of Indonesian soybean genotypes using morphological characteristics and simple sequence repeat (SSR) markers.
Materials and methods
Genetic materials, procedure, and SSR markers
A total of 63 yellow-seeded soybean genotypes collected from the BB-Biogen National Gene Bank (Table 1) were used in this study. The genetic materials were planted at the Cikeumeuh Experimental Station, Bogor, West Java, from March to June 2023. The experiment was conducted under field conditions to evaluate the morphological characteristics, including the yield component traits, of the genotypes.
Table 1 List of the 63 yellow-seeded soybean (Glycine max) genotypes evaluated in this study. Cibinong, Indonesia. 2024.
| No | Register number | Accession name | Genetic background | No | Register number | Accession name | Genetic background |
| 1 | B1351 | 15949 | Not known | 33 | B4368 | Kawi | Taiwan |
| 2 | B1459 | Samarinda | Samarinda | 34 | B4298 | No.8421 | USA |
| 3 | B1593 | Kedele Bali | Bali | 35 | B3866 | Slamet | Dempo x Wilis |
| 4 | B1634 | Kucir | Lampung | 36 | B4340 | GM 216 Si | Not known |
| 5 | B1636 | Kedele Empyek | East Java | 37 | B4351 | GM 2637 | Subang |
| 6 | B1658 | Sopeng | Ende | 38 | B4368 | Kawi | Taiwan |
| 7 | B3036 | 1343/1339-85-7 | Not known | 39 | B4392 | GM 378 Si | Subang |
| 8 | B3187 | Kepet | Subang | 40 | B4399 | GM 3796 Si | Subang |
| 9 | B3193 | Kedele Godek | Subang | 41 | B4403 | GM 3987 Si | Not known |
| 10 | B3194 | Kedele Minyak | Subang | 42 | B4406 | MLG. 3070 | Malang |
| 11 | B3207 | Kedele Susu | Subang | 43 | B4414 | Lokal Cikapak 94 | Cikapak |
| 12 | B3246 | Lokal Brebes | Brebes | 44 | B4426 | Sinabung | Double crosses of 16 parents |
| 13 | B3367 | Cinang | Langkat | 45 | B4427 | Ratai | Wilis x No. 3465 |
| 14 | B3564 | GM 917 Si | Not known | 46 | B4441 | Lokal Pringgarata | Pringgarata |
| 15 | B3565 | GM 2591 Si | Not known | 47 | B4469 | Lokal Kalijati | Kalijati |
| 16 | B3573 | 1248/1682 | Not known | 48 | B1248 | Davros | Garut |
| 17 | B3582 | No.29 ex Bogor | Not known | 49 | B1291 | Tk No.5 | Taiwan |
| 18 | B3610 | Lokal Kediri | Kediri | 50 | B1638 | NTV.KS No.5 | Taiwan |
| 19 | B3625 | Lokal Bangkalan | Bangkalan | 51 | B1658b | Lokal Sopeng | Sopeng |
| 20 | B3650 | Lokal Jember | Jember | 52 | B2812 | C.7301-1113-4-C-pop | Subang |
| 21 | B3681 | Lokal Karangasem | Karangasem | 53 | B2830 | GM 1461 Si | Not known |
| 22 | B3702 | MLG 2830 | Malang | 54 | B3072 | 11/BR 79-22754 | Brazil |
| 23 | B3712 | Lokal Lombok Barat | West Lombok | 55 | B3218 | Kedele Hijau | Subang |
| 24 | B3739 | Nona | Bojonegoro | 56 | B3613 | Lokal Pasuruan | Pasuruan |
| 25 | B4417 | Panderman | Taiwan | 57 | B3683 | Lokal Klungkung | Klungkung |
| 26 | B3840 | M.2976 | Malang | 58 | B3693 | Lokal Tabanan | Tabanan |
| 27 | B3881 | AGS 218 | Taiwan | 59 | B4120 | PW 1 | Central Java |
| 28 | B3885 | AGS 244 | Taiwan | 60 | B4374 | Lawit | B-3034 x Lampung |
| 29 | B3984 | C.3702-156-Pop | USA | 61 | B4401 | GM 4703 Si | Not known |
| 30 | B4042 | GM 4476 Si | Not known | 62 | B4408 | Seulawah | Willis x No.3898 |
| 31 | B4133 | CRB 8 | Cirebon | 63 | B4384 | Dempo | Colombia |
| 32 | B4194 | Lokal Ongko 2 | West Nusa Tenggara |
Field evaluation was conducted using a randomized complete block design with three replications. The genotypes were grown following standard soybean cultivation practices (Asadi et al., 2020). Each genotype was planted in a 2 m × 3 m plot with a spacing of 40 cm × 15 cm, with two seeds per hill. Prior to planting, the field was thoroughly prepared, and organic manure was applied at a rate of 1 t ha-¹ to improve soil fertility. Inorganic fertilizers consisting of 50 kg ha-¹ urea, 150 kg ha-¹ SP36, and 100 kg ha-¹ KCl were applied at planting. Irrigation, weed control, pest management, and disease control were carried out according to recommended soybean cultivation practices to ensure optimal plant growth.
Molecular marker analysis was conducted at the Genomic Laboratory, BRIN, Cibinong, West Java, from January to March 2024. The SSR markers used were selected based on their broad distribution across the soybean genome and their proven effectiveness in genetic diversity studies (Table 2). These markers were selected to provide representative genome-wide coverage across soybean chromosomes (Tasma et al., 2018).
Table 2 Characteristics of SSR markers used in this study (Cregan et al., 1999; United States Department of Agriculture, 2006), evaluated at the Genomic Laboratory, BRIN, Cibinong, Indonesia, from January to March 2024.
| No | SSR marker | Chr | Repeated type | Primer sequence ((5′ → 3′) | PCR product size (bp) | |
| 1 | Satt009 | 3 | (ATT)14 | F. | CCAACTTGAAATTACTAGAGAAA | 162 |
| R. | CTTACTAGCGTATTAACCCTT | |||||
| 2 | Satt038 | 18 | (ATT)17 | F. | GGGAATCTTTTTTTCTTTCTATTAAGTT | 176 |
| R. | GGGCATTGAAATGGTTTTAGTCA | |||||
| 3 | Satt114 | 13 | (AAT)17 | F. | GGGTTATCCTCCCCAATA | 108 |
| R. | ATATGGGATGATAAGGTGAA | |||||
| 4 | Satt147 | 1 | (ATA)15 | F. | CCATCCCTTCCTCCAAATAGAT | 172 |
| R. | CTTCCACACCCTAGTTTAGTGACAA | |||||
| 5 | Satt191 | 18 | (TAT)19 | F. | CGCGATCATGTCTCTG | 226 |
| R. | GGGAGTTGGTGTTTTCTTGTG | |||||
| 6 | Satt294 | 4 | (TAT)23 | F. | GCGGGTCAAATGCAAATTATTTTT | 287 |
| R. | GCGCTCAGTGTGAAATTGTTTCTAT | |||||
| 7 | Satt431 | 16 | (AAT)21 | F. | GCGTGGCACCCTTGATAAATAA | 230 |
| R. | GCGCACGAAAGTTTTTCTGTAACA | |||||
| 8 | Satt308 | 7 | (TTA)22 | F. | GCGTTAAGGTTGGCAGGGTGGAAGT | 170 |
| R. | GCGCAGCTTTATACAAAAATCAACAA | |||||
| 9 | Satt030 | 13 | (ATA)21 | F. | AAAAAGTGAACCAAGCC | 164 |
| R. | TCTTAAATCTTATGTTGATGC | |||||
| 10 | Satt002 | 17 | (TA)5 tgtacgatttaaaaataaaaata (AT)5 | F. | TGTGGGTAAAATAGATAAAAAT | 126 |
| R. | TCATTTTGAATCGTTGAA | |||||
| 11 | Satt045 | 15 | (AAT)18 | F. | TGGTTTCTACTTTCTATAATTATTT | 139 |
| R. | ATGCCTCTCCCTCCT | |||||
| 12 | Satt063 | 14 | (TAA)20 | F. | AAATGATTAACAATGTTTATGAT | 144 |
| R. | ACTTGCATCAGTTAATAACAA | |||||
| 13 | Satt197 | 11 | (ATT)20 | F. | CACTGCTTTTTCCCCTCTCT | 173 |
| R. | AAGATACCCCCAACATTATTTGTAA | |||||
| 14 | Satt463 | 7 | (AAT)13 (GAT)17 (AAT)19 | F. | TTGGATCTATATTCAAACTTTCAAG | 221 |
| R. | CTGCAAATTTGATGCACATGTGTCTA |
bp: Base pair. SSR: Simple sequence repeats. Chr: Chromosome. PCR: Polymerase chain reaction. / bp: Par de bases. SSR: Repeticiones de secuencia simple. Chr: Cromosoma. PCR: Reacción en cadena de la polimerasa.
Genomic DNA isolation, qualitative and quantitative analysis
Genomic DNA was isolated from young leaves following the method described by Doyle and Doyle (1990) with a minor modification consisting of the addition of 2 % (w/v) polyvinylpyrrolidone (PVP). The dried DNA pellets were subsequently dissolved in 100 µL 1× TE buffer (10 mM Tris (pH 8.0), 1 mM EDTA), supplemented with 2 µL of 10 mg/mL RNase, and incubated at 37 °C for one hour. DNA quality was assessed by running genomic DNA on a 1 % agarose gel, whereas genomic DNA concentration was determined using a NanoDrop 2000 spectrophotometer.
PCR and electrophoresis
PCR amplification of the 63 soybean genotypes was performed using 14 SSR markers (Table 2). Each PCR reaction was carried out in a total volume of 10 µL, consisting of 40 ng template DNA, 5 µL PCR master mix, 0.5 µL each of 10 µM forward and reverse primers, and 2 µL sterile ddH2O to a final volume of 10 µL.
The PCR program consisted of an initial DNA denaturation step at 94 °C for 30 s, followed by primer annealing at 55 °C for 1 min, DNA extension at 72 °C for 1 min, and final extension at 60 °C for 15 min, and the reaction was completed by incubating the PCR products at 10 °C for 4 min.
PCR products were separated by electrophoresis on 8 % polyacrylamide gels for 120 min at 90 V using 1 × TBE (Tris Borate EDTA) buffer. DNA fragments were stained with ethidium bromide and visualized using a Gel Doc Transilluminator system. The resulting DNA banding patterns were subsequently scored by using appropriate gel analysis software.
Morphological and yield component data analysis
The morphological traits analyzed included hilum color, flowering time, maturity time, plant height, number of branches per plant, number of pods per plant, 100-seed weight, and seed yield per plant. The qualitative trait hilum color was converted to numerical data according to the Union for the Protection of New Varieties of Plants (UPOV, 1998) classification system as follows: 1 = gray, 2 = yellow, 3 = light brown, 4 = dark brown, 5 = dull black, 6 = black, and 7 = brown. All morphological and yield component data were subjected to principal component analysis (PCA) and principal coordinate analysis (PCoA) using R software, version 3.6.3.
Molecular data analysis
Molecular data analysis was based on the scoring of DNA banding patterns obtained from electrophoresis of the SSR marker PCR products on 8 % polyacrylamide gels. Band scoring was performed using GelAnalyzer Software v.2010a (Lazer & Horvath-Lazar, 2010). DNA fragments exhibiting identical migration patterns and the same amplicon sizes (bp) were considered to represent homologous loci. The presence of a DNA band was scored as 1, whereas its absence was scored as 0, generating a binary data matrix for subsequent analysis.
The scored data were analyzed using the sequential agglomerative hierarchical and nested (SAHN) clustering procedure of the unweighted pair group method with arithmetic mean (UPGMA) implemented in NTSYS-pc software version 2.1 (Rohlf, 2000) to generate a dendrogram of the soybean genotypes. PowerMarker V3.25 (Liu & Muse, 2005) was also used to analyze the marker statistics, such as polymorphism information content (PIC) values, main allele frequency, gene diversity, and heterozygosity level of the SSR markers.
Results
Morphological characteristic analysis
A total of eight morphological traits were evaluated in 63 yellow-seeded soybean genotypes included in this study. The traits assessed were hilum color, flowering time, maturity time, plant height, number of branches per plant, number of pods per plant, 100-seed weight, and seed yield per plant. The descriptive statistics for these traits are presented in Table 3.
Table 3 Morphological traits of 63 soybean (Glycine max) genotypes evaluated at Cikeumeuh Experimental Station, Bogor, Indonesia, during the rainy season, 2023.
| No | Register Number | HC | FT | MT | PH | BNP | PNP | 100W | SYP | No | Register Number | HC | FT | MT | PH | BNP | PNP | 100W | SYP |
| 1 | B1351 | LB | 40 | 87 | 82.0 | 4 | 107 | 8.80 | 18.80 | 33 | B4368 | DB | 36 | 88 | 86.0 | 4 | 67 | 10.20 | 10.64 |
| 2 | B1459 | DB | 39 | 88 | 83.5 | 4 | 88 | 15.70 | 17.16 | 34 | B4298 | LB | 43 | 87 | 94.5 | 2 | 70 | 12.60 | 15.10 |
| 3 | B1593 | LB | 37 | 87 | 114.5 | 4 | 95 | 11.80 | 12.94 | 35 | B3866 | LB | 40 | 86 | 97.0 | 4 | 73 | 10.00 | 9.38 |
| 4 | B1634 | LB | 40 | 88 | 83.0 | 5 | 66 | 10.80 | 12.80 | 36 | B4340 | BL | 42 | 86 | 128.5 | 6 | 121 | 9.20 | 16.02 |
| 5 | B1636 | DB | 40 | 88 | 107.5 | 5 | 80 | 10.60 | 18.92 | 37 | B4351 | DB | 42 | 88 | 90.0 | 6 | 131 | 7.60 | 23.48 |
| 6 | B1658 | LB | 40 | 89 | 88.5 | 5 | 102 | 12.80 | 25.12 | 38 | B4368 | LB | 37 | 86 | 113.5 | 4 | 74 | 10.40 | 18.52 |
| 7 | B3036 | BL | 37 | 86 | 98.5 | 5 | 66 | 8.80 | 13.16 | 39 | B4392 | DB | 40 | 88 | 107.5 | 5 | 91 | 11.90 | 13.52 |
| 8 | B3187 | BL | 40 | 88 | 84.5 | 3 | 76 | 7.40 | 20.46 | 40 | B4399 | LB | 37 | 87 | 71.0 | 4 | 75 | 10.20 | 13.06 |
| 9 | B3193 | DB | 40 | 89 | 72.0 | 3 | 87 | 13.60 | 19.08 | 41 | B4403 | LB | 37 | 87 | 69.0 | 3 | 78 | 6.00 | 10.36 |
| 10 | B3194 | DB | 40 | 88 | 84.5 | 4 | 77 | 10.00 | 16.76 | 42 | B4406 | LB | 39 | 87 | 81.0 | 5 | 83 | 14.60 | 17.84 |
| 11 | B3207 | DB | 37 | 86 | 88.5 | 4 | 85 | 11.20 | 19.44 | 43 | B4414 | LB | 36 | 87 | 75.0 | 3 | 65 | 10.00 | 9.72 |
| 12 | B3246 | DB | 37 | 86 | 113.0 | 3 | 71 | 11.40 | 16.34 | 44 | B4426 | DB | 37 | 89 | 79.5 | 4 | 124 | 13.00 | 30.48 |
| 13 | B3367 | DB | 40 | 88 | 135.0 | 5 | 133 | 9.90 | 18.22 | 45 | B4427 | DB | 40 | 86 | 80.5 | 5 | 99 | 10.00 | 17.44 |
| 14 | B3564 | BR | 40 | 88 | 88.5 | 5 | 90 | 10.40 | 20.12 | 46 | B4441 | BR | 39 | 87 | 77.5 | 5 | 86 | 8.20 | 18.60 |
| 15 | B3565 | BR | 43 | 88 | 98.0 | 4 | 60 | 11.00 | 12.66 | 47 | B4469 | LB | 40 | 88 | 125.5 | 3 | 68 | 10.40 | 13.03 |
| 16 | B3573 | LB | 40 | 86 | 91.0 | 4 | 64 | 12.00 | 17.80 | 48 | B1248 | LB | 37 | 88 | 64.0 | 4 | 87 | 11.20 | 25.24 |
| 17 | B3582 | DB | 37 | 87 | 99.0 | 4 | 69 | 13.40 | 15.04 | 49 | B1291 | DB | 43 | 87 | 110.5 | 4 | 67 | 8.60 | 15.54 |
| 18 | B3610 | DB | 40 | 88 | 114.5 | 3 | 72 | 11.60 | 13.10 | 50 | B1638 | LB | 37 | 86 | 100.0 | 3 | 75 | 9.80 | 12.10 |
| 19 | B3625 | LB | 40 | 88 | 100.5 | 4 | 64 | 9.00 | 21.02 | 51 | B1658b | LB | 39 | 86 | 88.0 | 5 | 63 | 10.60 | 13.50 |
| 20 | B3650 | DB | 40 | 89 | 121.0 | 5 | 111 | 9.40 | 24.92 | 52 | B2812 | DB | 43 | 86 | 123.5 | 5 | 63 | 11.40 | 15.10 |
| 21 | B3681 | DB | 40 | 88 | 113.0 | 4 | 77 | 10.80 | 14.72 | 53 | B2830 | DB | 40 | 87 | 140.0 | 5 | 103 | 8.80 | 18.16 |
| 22 | B3702 | DB | 40 | 87 | 101.5 | 6 | 106 | 9.40 | 18.06 | 54 | B3072 | BL | 40 | 87 | 109.0 | 6 | 115 | 9.40 | 14.40 |
| 23 | B3712 | DB | 40 | 87 | 94.5 | 4 | 90 | 9.20 | 17.84 | 55 | B3218 | DB | 43 | 86 | 113.5 | 4 | 70 | 8.60 | 11.90 |
| 24 | B3739 | LB | 40 | 88 | 154.0 | 6 | 76 | 8.60 | 14.80 | 56 | B3613 | DB | 37 | 85 | 84.0 | 4 | 91 | 13.20 | 20.32 |
| 25 | B4417 | DB | 40 | 87 | 81.5 | 3 | 69 | 19.40 | 15.66 | 57 | B3683 | LB | 40 | 87 | 90.5 | 5 | 91 | 9.00 | 13.54 |
| 26 | B3840 | DB | 43 | 87 | 76.0 | 6 | 114 | 10.00 | 18.40 | 58 | B3693 | DB | 40 | 89 | 85.0 | 4 | 63 | 10.60 | 12.38 |
| 27 | B3881 | LB | 43 | 87 | 113.0 | 6 | 137 | 11.20 | 25.48 | 59 | B4120 | BL | 40 | 88 | 95.0 | 3 | 56 | 12.20 | 11.26 |
| 28 | B3885 | DB | 37 | 86 | 79.5 | 4 | 91 | 11.20 | 22.78 | 60 | B4374 | DB | 37 | 86 | 87.0 | 5 | 79 | 9.00 | 14.20 |
| 29 | B3984 | LB | 40 | 87 | 95.0 | 4 | 96 | 14.00 | 23.12 | 61 | B4401 | DB | 43 | 89 | 110.0 | 5 | 106 | 8.40 | 15.80 |
| 30 | B4042 | DB | 39 | 88 | 92.5 | 5 | 92 | 9.40 | 17.32 | 62 | B4408 | DB | 39 | 88 | 94.0 | 4 | 90 | 11.60 | 15.80 |
| 31 | B4133 | LB | 37 | 86 | 98.5 | 4 | 97 | 14.60 | 19.78 | 63 | B4384 | DB | 39 | 87 | 84.0 | 4 | 66 | 10.40 | 17.50 |
| 32 | B4194 | LB | 42 | 86 | 107.5 | 4 | 94 | 9.00 | 16.22 |
HC: Hilum color. FT: Flowering time (dap). MT: Maturity time (dap). PH: Plant height (cm). BNP: Number of branches per plant. PNP: Pod number/plant. 100W: 100-seed weight (g). SYP: Seed yield/plant (g). LB: Light brown. DB: Dark brown. BL: Black. BR: Brown. / HC: Color del hilio. FT: Tiempo de floración (dap). MT: Tiempo de maduración (dap). PH: Altura de la planta (cm). BNP: Número de ramas por planta. PNP: Número de vainas/planta. 100W: Peso de 100 semillas (g). SYP: Rendimiento de semillas/planta (g). LB: Marrón claro. DB: Marrón oscuro. BL: Negro. BR: Marrón.
The hilum color observed among the soybean genotypes was classified into four categories: light brown (23 genotypes), dark brown (32 genotypes), brown (3 genotypes), and black (5 genotypes). Flowering time ranged from 36 to 43 days after planting (DAP) with a mean value of 39 DAP. Maturity time varied from 86 to 89 DAP, averaging 87 DAP. Plant height ranged from 64 to 154 cm with a mean of 97 cm. The number of branches per plant varied from 2 to 6 with an average of 4 branches per plant. The number of pods per plant ranged from 56 to 137 with a mean of 85 pods per plant. The 100-seed weight varied from 6.00 to 19.40 g, averaging 10.69 g. Seed yield per plant ranged from 9.38 to 30.48 g with an average of 16.86 g per plant.
PCA reduced the morphological traits in the 63 soybean genotypes into four principal components with eigenvalues greater than 1 which together explained 72.63 % of the total phenotypic variation (Table 4). The first principal component (PC1) was primarily associated with flowering time, number of branches per plant, and number of pods per plant, along with other contributing traits, and accounted for 26.26 % of the total phenotypic variation. The second principal component (PC2) was mainly associated with 100-seed weight and seed yield per plant, along with other contributing traits, explaining 19.72 % of the total phenotypic variation. The third principal component (PC3) was predominantly influenced by plant height and associated traits, accounting for 13.99 % of the total phenotypic variation. The fourth principal component (PC4) was primarily associated with maturity time and related traits, explaining 12.77 % of the total phenotypic variation.
Table 4 Principal component analysis of morphological traits in 63 yellow-seeded soybean (Glycine max) genotypes evaluated at Cikeumeuh Experimental Station, Bogor, Indonesia, from March to June 2023.
| Variable | Principal component 1 | Principal component 2 | Principal component 3 | Principal component 4 |
| Hylum color | 0.37 | −0.33 | −0.58 | 0.32 |
| Flowering time | 0.54 | −0.31 | 0.42 | 0.35 |
| Maturity time | 0.36 | 0.23 | −0.01 | 0.74 |
| Plant height | 0.34 | −0.47 | 0.63 | −0.07 |
| Branch number/plant | 0.72 | −0.14 | −0.38 | −0.20 |
| Pod number/plant | 0.71 | 0.42 | 0.17 | −0.29 |
| 100-seed weight | −0.39 | 0.57 | 0.18 | 0.34 |
| Seed yield/plant | 0.52 | 0.74 | 0.00 | −0.12 |
| Eigen value | 2.09 | 1.58 | 1.12 | 1.02 |
| Variance (%) | 26.16 | 19.72 | 13.99 | 12.77 |
| Variance cummulative (%) | 26.16 | 45.88 | 59.86 | 72.63 |
Bold numbers within the principal component data indicated that the morphological characters observed contributed to the genetic variances. / Los números en negrita dentro de los datos de los componentes principales indican que los caracteres morfológicos observados contribuyeron a las variaciones genéticas.
Figure 1A presents the PCA biplot of morphological traits evaluated in the 63 soybean genotypes. The first principal component (PC1) and the second principal component (PC2) accounted for 26.2 % and 19.7 % of the total phenotypic variation, respectively, consistent with the values shown in Table 4. Based on Figure 1A, PC1 was characterized by the number of branches per plant (0.72), number of pods per plant (0.71), and flowering time (0.54), indicating that these traits contributed most strongly to the variation explained by this component. This pattern is clearly reflected in the biplot, where these variables are represented by relatively long vectors oriented in similar directions.
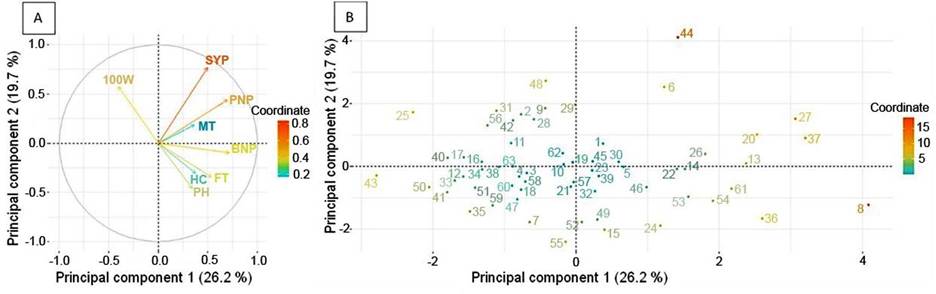
Figure 1 Principal component analysis of morphological traits in 63 yellow-seeded soybean (Glycine max) genotypes evaluated at Cikeumeuh Experimental Station, Bogor, Indonesia, from March to June 2023. A) Distribution pattern of morphological trait diversity based on the first and second principal components. B) Relative position of soybean genotypes based on morphological traits.
The length of the vectors reflects the magnitude of trait contribution to the principal components, with longer vectors indicating stronger contributions, while shorter vectors indicate weaker contributions. Furthermore, the small angles (<90°) formed among these vectors suggest strong positive correlations among the traits. Similarly, PC2 was characterized by seed yield per plant (0.74) and 100-seed weight (0.57), as shown in Table 4. In the biplot, these traits were also represented by long vectors with similar orientations, indicating their substantial contribution to PC2 and their positive association.
The PCoA illustrating the relative position of the 63 soybean genotypes based on morphological traits can be used to select plant genotypes based on a two-dimensional space (Figure 1B). The genotypes were distributed across the four quadrants, with several groups of genotypes clustering closely together. Genotypes located in close proximity exhibit greater similarity in morphological characteristics.
For example, genotype 21 (Lokal Karangasem) and genotype 57 (Lokal Klungkung) were positioned within the same quadrant and clustered closely together (Figure 1B). The two genotypes originated from the same island, Bali (Table 1), and exhibited similar morphological characteristics, particularly hilum color, flowering time, and maturity time (Table 3).
Soybean genotypes located in close proximity within the same quadrant are less suitable as parental candidates because they are more likely to share similar morphological traits and possess a similar genetic background, which may result in inferior progenies. Based on this study, genotype 8 (Kepet) and genotype 44 (Sinabung) appear to be promising parental candidates. These genotypes were positioned far apart in the ordination plot and were located in different quadrants (Figure 1B). Furthermore, the two genotypes differed in multiple morphological traits, including hilum color (Table 3). Therefore, these genotypes can be considered morphologically divergent and potentially valuable parental materials for soybean breeding programs because their genetic divergence may contribute to the development of superior progenies.
Molecular marker analysis
Molecular marker analysis using 14 SSR markers revealed high levels of polymorphism among the 63 soybean genotypes, with amplified fragment sizes ranging from 89-240 bp (Figure 2; Table 5). The polymorphism information content (PIC) values ranged from 0.88 (Satt063) to 0.98 (Satt191) with a mean of 0.95. A total of 553 SSR alleles were detected across all SSR loci with an average of 40 alleles per locus and a range of 26 to 57 alleles per locus.
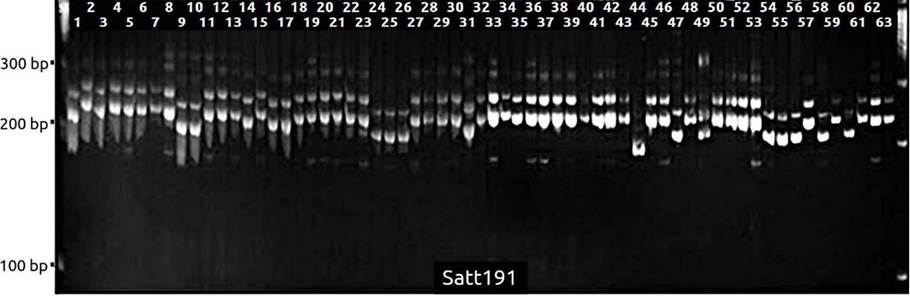
Figure 2 Representative SSR banding profile generated by marker Satt191 in 63 yellow-seeded soybean (Glycine max) genotypes, at the Genomic Laboratory, BRIN, Cibinong, Indonesia, from January to March 2024.
Table 5 Genetic diversity parameters of 14 SSR markers evaluated in 63 yellow-seeded soybean (Glycine max) genotypes, at the Genomic Laboratory, BRIN, Cibinong, Indonesia, from January to March 2024.
| SSR marker | Allele number | Allele size ranges (bp) | Main allele frequency | Gene diversity | Heterozygosity | PIC |
| Satt002 | 44 | 174-233 | 0.06 | 0.97 | 0.62 | 0.97 |
| Satt009 | 49 | 156-225 | 0.10 | 0.97 | 0.81 | 0.97 |
| Satt030 | 22 | 144-164 | 0.17 | 0.91 | 0.14 | 0.90 |
| Satt038 | 30 | 168-208 | 0.07 | 0.96 | 0.33 | 0.95 |
| Satt045 | 36 | 140-187 | 0.06 | 0.97 | 1.00 | 0.96 |
| Satt063 | 16 | 114-189 | 0.25 | 0.89 | 0.00 | 0.88 |
| Satt114 | 26 | 89-130 | 0.16 | 0.91 | 0.29 | 0.90 |
| Satt147 | 44 | 252-316 | 0.10 | 0.96 | 0.44 | 0.96 |
| Satt191 | 57 | 169-195 | 0.06 | 0.98 | 1.00 | 0.98 |
| Satt197 | 50 | 130-146 | 0.06 | 0.97 | 0.95 | 0.97 |
| Satt294 | 41 | 181-235 | 0.06 | 0.97 | 0.90 | 0.97 |
| Satt308 | 52 | 128-197 | 0.06 | 0.97 | 0.86 | 0.97 |
| Satt431 | 44 | 186-240 | 0.09 | 0.97 | 0.83 | 0.96 |
| Satt463 | 42 | 114-192 | 0.10 | 0.96 | 0.92 | 0.95 |
| Total | 553 | |||||
| Range | 16-57 | 89-240 | 0.06-0.25 | 0.89-0.98 | 0.00-1.00 | 0.88-0.98 |
| Average | 40 | 0.10 | 0.95 | 0.65 | 0.95 |
PIC: Polymorphism information content. bp: Base pair. / PIC: Contenido de información polimórfica. bp: Par de bases.
The major allele frequencies ranged from 0.06 for markers Satt002, Satt045, Satt191, Satt197, Satt294, and Satt308 to 0.25 for marker Satt063, with an average value of 0.10. Gene diversity values ranged from 0.89 (Satt063) to 0.98 (Satt191), with a mean of 0.95. Observed heterozygosity ranged from 0 (Satt030) to 1.00 (Satt045 and Satt191), with an average value of 0.65 (Table 5).
Phylogenetic analysis
The analysis of genetic relationships among the 63 soybean genotypes based on 14 SSR markers revealed an overall genetic similarity of 76 % (Figure 3). Using this similarity threshold, the soybean genotypes were classified into two major clusters, namely Cluster I, comprising 39 genotypes, and Cluster II, comprising 24 genotypes.
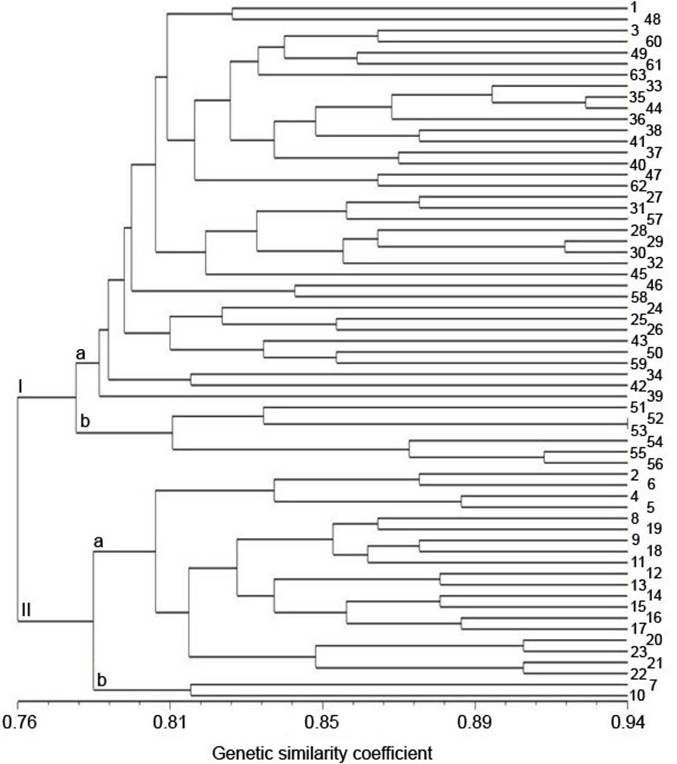
Figure 3 Dendrogram of 63 yellow-seeded soybean (Glycine max) genotypes based on the results of analysis using 14 SSR markers, generated at the Genomic Laboratory, BRIN, Cibinong, Indonesia, from January to March 2024.
As shown in Figure 3, soybean genotypes originating from the same geographic region and exhibiting similar hilum color tended to cluster together. For example, three accessions originating from Bali, namely Balinese soybean, Lokal Klungkung, and Lokal Tabanan, were grouped together in Cluster I. Similarly, four local accessions from Subang (Kepet, Kedelai Godek, Kedelai Minyak, and Kedelai Susu) were grouped in Cluster II.
In several cases, clustering patterns were also associated with hilum color. For example, genotypes C.7301-1113-4-C-pop and GM 1461 Si, both characterized by brown hilum color, were grouped together in Cluster I-b. Likewise, four accessions with dark brown hilum color and a flowering time of 40 days (Lokal Jember, Lokal Karangasem, MLG 2830, and Lokal West Lombok) were grouped together in Cluster II-a (Figure 3).
Discussion
The hilum color categories recognized by UPOV (1998) include gray, yellow, light brown, dark brown, dull black, and black. Hilum color in soybeans is controlled by multiple allelomorphic forms of specific genes. However, several studies reported that variation in soybean hilum color and pattern does not always correspond to the overall genetic variation observed among soybean genotypes (Fattah et al., 2024).
Principal component analysis (PCA) is a multivariate statistical method used to summarize information from multiple correlated variables observed on the same subjects into a smaller number of variables known as principal components. These components are derived from the total variance of the original variables and optimally account for most of that variance (Greenacre et al., 2022).
The results obtained from this study indicated that four principal components were sufficient to explain the diversity of 63 yellow-seeded soybean accessions. The selection of these four main components is based on eigenvalues. These eigenvalues are used to reduce the dimensions of the multivariate data that represent the main component variables.
Principal components with eigenvalues greater than 1 are considered informative and contribute to the explanation of the genetic diversity; conversely, if the eigenvalue is less than 1, then the principal component cannot explain genetic diversity (Singh et al., 2020). Based on research conducted by Singh et al. (2020), only two of the five principal components produced had an eigenvalue greater than 1, accounting for 76.6 % of the total variation. Similarly, Upadhyay et al. (2022) reported that five out of ten principal components had eigenvalues greater than 1 and together explained 83.49 % of the total variation.
Principal coordinate analysis (PCoA) is a multivariate analytical method used to visualize patterns of similarity among genotypes based on measured traits. This method has been widely applied in studies of soybean genetic diversity, including those conducted by Rani et al. (2023) and Zatybekov et al. (2023). These studies demonstrated that PCoA effectively reveals patterns of genetic relationships among soybean accessions and facilitates the identification of genetically related groups originating from different geographic regions.
The PCoA results reported by these authors showed that accessions originating from the same region generally tended to exhibit close genetic relationships. In contrast, accessions from different regions showed more distant relationships. A similar pattern was observed in the present study, where the relative positions of the 63 yellow-seeded soybean accessions reflected differences in their genetic relationships.
Genetic diversity analysis using molecular markers is generally considered more reliable and informative, making it a primary supporting tool in genetic diversity studies based on morphological data (Guler & Imamoglu, 2023). The SSR markers applied in this study are widely recognized for their high level of polymorphism. This study employed 14 SSR markers on 63 yellow-seeded soybean accessions, yielding a high level of polymorphism, as indicated by high average PIC value of 0.95 for all SSR markers used in this study.
The PIC value is commonly used to evaluate the discriminatory power of SSR markers to differentiate between accessions. PIC values can be classified as highly informative (PIC > 0.5), moderately informative (PIC = 0.25-0.5), and non-informative (PIC < 0.25) (Pasaribu et al., 2017). The results of this study showed that the SSR markers used were generally informative and effective in distinguishing between the tested accessions. Similar results were reported by Tasma et al. (2024), who obtained an average PIC value of 0.81 using 17 SSR markers. These findings further support the effectiveness of the SSR markers used.
Additional genetic diversity parameters evaluated using molecular markers include the number of alleles, major allele frequency, gene diversity, and observed heterozygosity. A total of 553 SSR alleles were detected, exceeding the 316 alleles reported by Tasma et al. (2018) in an analysis of 29 soybean genotypes using 27 SSR markers. In contrast, the average major allele frequency observed in the present study (0.10) was lower than the value of 0.30 reported by Nugroho et al. (2020) in a study of 20 soybean genotypes using 10 SSR markers.
Gene diversity represents the probability that two randomly selected alleles from a population are different (Babu et al., 2018). There is a positive correlation between gene diversity, allele number, and PIC value. Dyah et al. (2024) reported that higher gene diversity leads to higher allele numbers and PIC values, whereas lower gene diversity results in lower allele numbers and PIC values.
In this study, marker Satt191 exhibited the highest gene diversity value (0.98), together with 57 detected alleles and a PIC value of 0.98. In contrast, marker Satt063 showed the lowest gene diversity value (0.89), with 22 alleles and a PIC value of 0.88. Observed heterozygosity is another key parameter for assessing genetic diversity among soybean genotypes. Markers with higher heterozygosity values generally possess greater discriminatory power and are therefore more effective in distinguishing among accessions within a population (Nurdianawati et al., 2016). In the present study, the SSR marker Satt191 exhibited the highest heterozygosity value (1.00), further confirming its high level of informativeness. Consequently, this marker may be particularly useful for future studies assessing genetic diversity in various soybean genotypes for genetic analysis and breeding purposes.
Phylogenetic analysis is widely used to classify genotypes within a population according to their shared relationships and can be performed using morphological traits, molecular markers, or a combination of both approaches (Rani et al., 2023). In this study, the phylogeny based on 14 SSR markers showed a genetic similarity value of 76 % among the 63 yellow-seeded soybean accessions and separated them into two major clusters.
Comparable results have been reported in previous studies. Nugroho et al. (2020) found that 30 soybean genotypes were divided into two major clusters at a genetic similarity level of 71 %. Likewise, Tasma et al. (2024) reported that eight soybean genotypes were grouped into two major clusters at a genetic similarity level of 81 %.
These findings suggest that soybean accessions with relatively high genetic similarity tend to cluster together, whereas genetically divergent genotypes are distributed among different clusters (Rani et al., 2023). Therefore, phylogenetic analysis provides valuable information not only for assessing genetic diversity within soybean genotypes but also for identifying genetically diverse parental materials that can be used in soybean breeding programs (Nugroho et al., 2019).
Conclusions
Morphological and SSR marker characterizations revealed substantial genetic diversity among the 63 Indonesian soybean genotypes. The clustering patterns obtained from the SSR-based dendrogram showed a clear correspondence with several morphological traits, as genotypes grouped together at the molecular level frequently exhibited similar phenotypic characteristics. These findings indicate that morphological data complement SSR marker analysis by providing phenotypic context for the interpretation of genetic relationships.
Therefore, the integration of molecular and morphological analyses provides a more comprehensive assessment of genetic diversity and facilitates the identification of genetically divergent and phenotypically desirable parental genotypes, which are valuable resources for soybean breeding programs.

