


 Inglés (pdf)
 Articulo en XML
 Referencias del artículo
 Enviar articulo por email
 Citado por SciELO
  Similares en
SciELO
Similares en
SciELO 
 Permalink
Introduction
Migration, as a selective process, is related among other determining factors to levels of education (Bernard, Belly and Charles, 2014). The theory suggests that individuals with a higher level of education are more likely to emigrate than those with lower levels. Given their level of education, the redistribution of such workers could affect the relative human capital endowment of both the sending and receiving states (Greenwood, 1985). In this sense, migration represents a form human capital transfer between places of origin and destination, so it is of interest to investigate its characteristics and patterns in recent years.
The transformation of production processes at the regional level results in a permanent modification on the patterns of private investment (both national and foreign), of international trade activity, labor, and other factors related to production (Jordan and Rodríguez-Oreggia, 2012; Díaz-Bautista, 2006; Flores, Medellín and Villareal, 2018). These changes in regional economic geography can, in turn, generate dynamics in local labor markets by modifying the relative composition of demand for skilled and unskilled human capital and, therefore, in their relative wages (Hanson, 2003; Sobrino, 2016). The analysis of the mobility of labor within the country is in turn relevant to a given endowment of skilled and unskilled labor, and where both positive and negative net balances necessarily imply changes in the magnitude of migratory flows between states.
The extent to which the volumes of flows coming into a region differ in their degree of concentration from the volumes of flows leaving the region is of particular interest, because net migration is one component of population change. A region that draws its migrants from a set of origin regions different from the destination regions to which it sends out-migrants may have a zero overall net migration (total gross in-migration equals total gross out-migration), but it nonetheless may play a significant role as a redistributor of the population in the migration system. Studying people mobility is relevant in the case of Mexico which has experienced changes in its internal industrial economic structure as a result of the economic liberalization that arose at the beginning of the '90s. Industries oriented to foreign markets emerged in some states, a situation that, in turn, generated a greater demand for specialized human capital. This pattern may have had implications for the internal mobility within the country.
This paper assesses the changes in internal mobility patterns by estimating the origin-destination migration flows in Mexican states for the years 2000, 2010 and 2015. The main contribution of this study is twofold. First, it aims assessing recent in internal mobility patterns by estimating the origin- destination migration flows, for the skilled and unskilled labor in Mexican states for the years 2000, 2010 and 2015. Second, once characterized these flows, the analysis goes a step further by means of estimating a migratory Gini index from which it is possible to analyze inequalities in the interstate migration flows of the skilled and the unskilled1.
The rest of the paper is organized as follows. In the next section we briefly review relevant literature on the subject, as well as some applied work for the case of Mexico. Section three describes the methodology used for the estimation migration flows and the migratory Gini index both. While the results from the present analysis are discussed in section four, a final discussion and some insights for future research are considered in section five.
Literature Review
According to the neoclassical theory of human capital, the decision to migrate conveys a rational process from which a decision is viewed as an investment in human capital. This is because migration experience adds skills, knowledge and experiences of the new occupation to stock of previously existing human capital (Haug, 2008). Hence, a rational individual decides to migrate after a cost- benefit analysis taking into account the differences wages, expected salary, transportation costs, accommodation and adaptation to the environment, time transfer, infrastructure, climate, security, among others (Galvis, 2002; Pizzolitto, 2006).
Specifically, Todaro (1980), one of the seminal articles on the subject, describes the following theoretical arguments that are involved in the migratory process:
The decision to migrate is mainly due to rational economic considerations that translate into a cost-benefit analysis, which also includes psychological aspects;
The decision to migrate depends mainly on the expectations of the returns to be received before that in the current differences between the income received in the regions of origin and destination; the expectation or probability of obtaining a job in the destination regions is directly proportional to the occupancy rate therein;
When migration rates exceed the capacity of destination regions to generate employment creates serious imbalances that generate unemployment;
From a regional economy perspective, there exists a relationship between migration and economic development. It is argued that those who embark migration exhibits some sort of selection, that is, the people who self-selected to migrate generally present a series of positive characteristics and desirable for your destination regions. Among these characteristics we can highlight the dynamism, its minor risk aversion, their propensity to undertake and greater adaptability (Pizzolitto, 2006). Also referred as positive selection, these migrants tend to be more educated and endowed with specific skills required in the workplace.
As argued by Ottaviano and Peri (2006), migrant skill level has also become a key consideration in studies focused on the impact of migration on labour market conditions, particularly in the case of immigration. One the one hand, inmigration of workers with a specific set of skills (e.g., low-skilled workers, high skilled workers) increases the regional supply of these workers, depressing within group wages and increasing the wages of the other worker groups (known as the 'negative skill endowment effect').
Second, regional productivity of workers in a given skill group is positively affected by the in- migration of workers from the same skill group. Since workers are imperfect substitutes, inmigration is assumed to increase the range of available skills (known as the 'positive skill externality effect') (Behrens and Sato, 2011, pp.7). In that sense, attracting labor is not only important to fill vacancies in a growing industry. The influx of highly skilled labor in the regions and industries located in these regions, particularly if these new workers bring along new but relevant skills, will serve to further boost the receiving industry (Galvan, 2008). On the other hand, among the negative effects of outmigration flows (either shilled or unskilled) can be argued reductions of the workforce in the regions of origin, important variations in the level of education, demographic changes and may involve increases in unemployment rates (Galvis, 2002). In this sense, internal migration can be studied as a dynamic phenomenon that may be associated to regional economic, demographic and social transformations.
Several studies have considered the case of Mexico given its effects related to the economic liberalization process on internal migration, particularly at the regional level (Arendys-Kuenning, Baylis and Garduño-Rivera, 2018; Aroca and Maloney, 2005; Flores, Zey and Hoque, 2013). Other studies have approached the internal migratory phenomen from a demographic perspective. For example, Sobrino (2016) analyzes socio-demographic characteristics and territorial flows of internal migration in Mexico between 1995 and 2015 using models of transition from mobility to different territorial scales. Amidst the findings, on the one hand, it stands out that the migratory intensity has decreased and is currently more common among men and women of 40 years of age and older, with fewer years of formal education, and who do not insert themselves into the job market. On the other hand, the greatest migratory intensity was observed at the end of professional education, which can be a sign of territorial redistribution of human capital. Similarly, it also found a significant change of pattern in Mexico City towards 2015, which went from being a net expeller to a state with greater net attraction.
Based on census data for Mexico for the years 2000 and 2010, Pérez and Santos (2013) confirm that both urban-urban internal migration and migration between metropolitan areas have emerged as the most important modalities. Likewise, Caudillo and Tapia (2014) use internal migration flows along with network analysis techniques to seek migration patterns for the skilled population in Mexico for the period 2005-2010. The authors find low geographic mobility among the population holding a bachelor's degree or higher. In a related study, looking at the northern border region of Mexico and at the municipal level, Lomelí and Ybáñez (2017) point to a greater concentration of migration in the northeastern municipalities, but not necessarily in municipalities bordering the United States of America.
Almejo and Hernández (2016) consider migration flows of those between 18 and 64 years of age who have higher education for the period 2010-2015, based on the Intercensal Survey 2015 by the Instituto Nacional de Estadística y Geografía (INEGI), and identify cities that gain or lose this type of population. The largest attraction occurs in metropolitan areas, tourist cities, and some capitals. It is worth mentioning that Varela, Ocegueda and Castillo (2017), based on the 2014 National Survey of Occupation and Employment conducted by INEGI, utilizing a multilevel econometric model, found that the number of hours worked per week and the weeks of job search are statistically significant to explain the determinants of Internal migration in Mexico, both at the interstate and intrastate levels. Despite past work on the subject, there is still a need to considered explicitly the distinction between skilled and unskilled internal migration, a contribution that the present work aims to make.
Methodologically, it must be noted that dealing with flow matrices has routinely confronted the issue of how these complex flows can be best summarized. In the area of migration, a growing literature has sought to derive meaningful groupings of areal units based upon underlying similarities in their structure of migration (Pandit, 1994). However, depending upon the theoretical and methodological approach taken, two distinct types of migration regions have been defined: (1) migration regions as groups of states which are highly connected to one another (termed here as migration subsystems); and (2) migration regions as groups of states which have similar patterns of interchange with other states (termed here as migration typologies). A basic understanding of the underlying age and spatial structures found in past patterns of interregional migration flows is important for accurately projecting future patterns of interregional migration (Pandit,1994).
Hence, the flows coming into a region may differ in their degree of concentration from the volumes of flows leaving the region. For example, a region that draws its migrants from a set of origin regions different from the destination regions to which it sends out-migrants may have a zero overall net migration (total gross in-migration equals total gross out-migration), but it nonetheless may play a significant role as a redistributor of the population in the migration system (Plane and Mulligan, 1997). The specific streams of in- and out-movement may differ in their degrees of spatial concentration. A measure of the spatial concentration of in-migration fields and out-migration fields such as the migratory Gini index can aid our understanding of the spatial linkages that exist among population changes in any single region and those taking place in all other regions of the system. An interesting question to explore is whether some regions have persistently focused (highly concentrated) in- or out-migration fields while others have persistently broad (unconcentrated) fields. The next section provides the methodological aspects of the estimation of migration flows as well as the measure of its spatial concentration patterns.
Methodology and Data
This study uses microdata from three official and publicly available sources of information: the General Census of Population and Housing (2000), the Census of Population and Housing Units (2010), and the Intercensal Survey (EIC) 2015, all conducted by the National Institute of Statistics and Geography of Mexico (Instituto Nacional de Estadística y Geografía (INEGI), 2000, 2010, 2015). Microdata make it possible to estimate the socio-demographic characteristics of internal migrants based on their residence status five years ago by the time of the interview and education level.
Internal migration is modeled via the estimation of origin-destination migratory flows at the state level for the periods 1995-2000, 2005-2010, and 2010-20152. Skilled migrants are considered those who changed their state of residence and hold a bachelor degree or higher education, while unskilled migrants are those with less than a secondary school level of education. Finally, the analysis considers internal migrants between the ages of 18 and 64, given that this group exhibits the highest probability of migrating.
According to Ybáñez, Muñoz, Cruz and Pérez (2015) the interstate internal migration in Mexico can be represented by a 32x32 origin-destination flow matrix as follows
where every 𝑀𝑐,𝑆 represents the migration of state i towards j in the period of time t, of skilled and unskilled labor (c or nc respectively). This representation allows estimating both, total immigration and emigration flows. The upper triangle of 𝑀𝑐,𝑆 is the emigrations of state i towards j and its lower triangle is immigration that arrives from i to j.
From 𝑀𝑐,𝑆 it is possible to obtain, among other indicators, the net migratory balance which is defined as the difference between total immigration and emigration flows. For example, for male in state 1, this is denoted as follows:

Thus, a positive SNM reveals that the total flows of migrants to a state exceeded the total flows out of that state. Conversely, a negative SNM would assume that the number of people who left is greater than the number of people who entered a given state. This indicator is relevant since it will allow us to know about changes at the state or regional level in the stock of skilled or unskilled migrants as a result of migratory flows.
It should be noticed that dealing with flow matrices has routinely confronted the issue of how these flows can be best summarized in a useful way. The extent to which the volumes of flows coming into a region differ in their degree of concentration from the volumes of flows leaving the region is of particular interest, because net migration is one component of population change. The specific streams of in and out-movement may differ in their degrees of spatial concentration. A measure of the spatial concentration of in-migration fields and out-migration fields can increase our understanding of the spatial linkages that exist between population changes in any single region and those taking place in all other regions of the system.
The specific streams of in- and out-movement may differ in their degrees of spatial concentration. A measure of the spatial concentration of in-migration fields and out-migration fields, in conjunction with other measures of migration, can aid our understanding of the spatial linkages that exist among population changes in any single region and those taking place in all other regions of the system. An interesting question that we ourselves to explore is whether some regions have persistently focused (highly concentrated) in- or out-migration fields while others have persistently broad (unconcentrated) fields.
In this sense, Plane and Mulligan (1997) have proposed using the Gini index to estimate the degree of geographical concentration exhibited by the migration flows; this is, considering the spatial structure of the set of origin-destination-specific streams that results from specification (1).
According to Plane and Mulligan (1997), each migratory flow 𝑀𝑖𝑗 is compared with each and every one of the other flows 𝑀𝑘𝑙, ignoring the elements of the diagonal that corresponds to non-migrants.
A value of 0 indicates that there is no spatial concentration, given that each flow is about the same size; the value of 1 indicates the maximum concentration, given that the migration focuses on one flow, i.e. the flows are perfectly unequal, so that many immigrants are moving selectively to a few destinations, while many migrants are leaving only from a few origins.
The Gini index (Total) at time t is given by
where 𝐺𝑅⦁𝑇 is the Rows index (in-migrants); 𝐺⦁𝐶𝑇 is the Columns index (out-migrants) 𝐺𝑅𝐶,𝐶𝑅𝑇 is the Exchanges index and 𝐺𝑂𝑡ℎ𝑒𝑟𝑠𝑇 the remaining flows, where each term can be expressed in terms of the migration flows as follows:
where n is the total number of states, in this case 32, and T is the total flow of migrant population. The so-call in-migration and out-migration field Gini indexes are a decomposed version of the Columns and Rows Gini index respectively. They represent the contribution of each region's columns and rows to the total Gini index. Note that the value of the Gini index can vary between 0 and 1, where values close to 0 indicate less degree spatially focused flows while values close to one 1 means high degree spatially focused flows.
The use of the migratory Gini Index has come advantages, for example: a) useful to measure spatial inequalities and to compare results across different population segments; b) it provides an simple indicator easy for interpretation which ranges between 0 and 1; and c) it has important properties such as: anonymity, scale independence and population independence. Furthermore, given the standard values of the migratory Gini Index, it is possible to classify states according to the role playing in the system of in or out migrants flows. As showed in the next section, there are states that have played an important role as redistributors of migrants, either skilled or unskilled.
Results
Figure 1 shows that while the total number of interstate migrants decreased over time (from 2.5 million to 2.3 million people) and the total number of unskilled interstate migrants decreased by about 14% (from 986,000 migrants to approximately 846,000 migrants), the number of skilled migrants exhibits an increase of 3.1% (from 327,000 to 337,000).
Source: Own elaboration, 2019
Figure 1. Total skilled and unskilled internal migrants, 1995-2000, 2005-2010 and 2010-2015
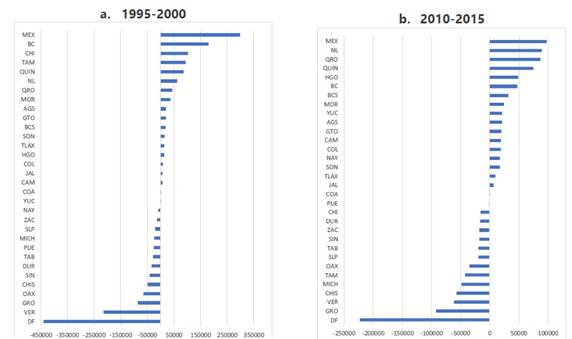
Figure 2 and Figure 3 exhibits the distribution of net migration of unskilled and skilled workers, respectively. As in Figure 2, the State of Mexico (MEX) dominated attraction of unskilled migrants for the period 1995- 2000, with approximately 163,000; Baja California (BC) ranked second, with 113,000; while Chihuahua (CHI) and Tamaulipas (TAM), with approximately 69,000 and 60,000, ranked third and fourth, respectively. Quintana Roo (QUIN) completes the group of the 5 states with the highest positive net balance.
For the period 2010-2015, there are important changes in the top 5 states with positive migratory net balance. The State of Mexico (MEX) continues to act as a net receiver of unskilled migrants, with an estimated 74,000 migrants; however, Nuevo Leon now ranks second, with 64,000 (see Figure 2). Likewise, Quintana Roo (QUIN) continues to be a main attractor of unskilled migrants, ranking third and recording a positive net balance of 52,000; while Querétaro (QRO), with an SNM of 38,000, is in the fourth place of this group of states. Finally, Baja California (BC) goes from second to fifth place (with 35,000).
Regarding interstate skilled migrants, Figure 3 indicates that among the states with the highest positive net balance for the period 1995-2000, the State of Mexico (MEX) ranks first, with an estimated net balance of approximately 34,000 migrants. In second and third place are Baja California (BC) and Quintana Roo (QUIN), with net balances of approximately 16,000 and 15,000 respectively. Queretaro (QRO), with 13,000 migrants, and Nuevo Leon (NL), with 12,000, complete the list.
The period 2010-2015 shows movement regarding to the first 5 states with a greater net migratory balance. Queretaro (QRO) becomes the state that exhibits a greater attraction of migrants, with approximately 27,000. Quintana Roo (QUIN) goes from third to second place, registering a net gain of 10,000 skilled migrants, while Nuevo Leon (NL) goes from fifth to third place, with an estimated net balance of close to 9,000 migrants. In addition, Jalisco (JAL) and Yucatan (YUC) experience the greatest changes in the rankings of skilled migrants. Specifically, Jalisco (JAL) exhibits a change of position from eighth to fourth place, while Yucatan (YUC) goes from thirteenth place to fifth place.
An interesting pattern emerges from the participation of the leading states as inflow receivers. Specifically, migration inflows of both unskilled and skilled migrants have become less concentrated as the 5 leading states for total inflows of unskilled migrants experienced a reduction in participation of 6 percentage points, from 41% to 35% total inflows, while a higher reduction of 12 percentage points in the participation of total inflows is observed for skilled migration, from 35% to 23% of total inflows.
Appendix A1 aids in the visualization of these patterns by means of circular graphs called chordDiagrams3 (Gu, Gu, Eils, Schlesner and Brors, 2014). In order to identify the flows of the states, a single color is used for each of them in the three figures, and their abbreviations are also used as shown in Appendix A2. It should be noted that each graph represents the origin-destination dynamics of the respective type of labor force, whereas the perimeter color coincides with the color of the flow that corresponds to the origin4.. The main findings are the following: a) Both the State of Mexico (MEX) and Mexico City (DF) are the main destinations and origins of internal migration over time, and have gradually lost the domain they had in 2000, which is also reflected in the evolution of the corresponding Gini indexes; b) it is notable how, over the years, for some states the flow of origin is less for unskilled labor vs. skilled labor, as is the case in the states of Nuevo León, Coahuila, and Tamaulipas (NL, COA and TAM); c) the opposite occurs - that is, the flow of unskilled labor is greater than that of skilled labor - in states such as Veracruz, Chiapas and Oaxaca (VER, CHIS and OAX).
Even though the above visualization aids to the understanding of the migration flows among states, there is a need to summarize the whole system of flows. As discussed earlier, one approach is to look at specific streams of in-and out-movements and the extent to which differ in their degrees of spatial concentration. A measure of the spatial concentration of in-migration fields and out-migration fields, such as the Gini index, helps to shed light on the spatial linkages that exist between population change in any single region and that taking place in all other regions of the system. Table 1 shows the estimated Gini index and its decomposition for total, unskilled and skilled migrants, for each of the periods considered. The results suggest that interstate flows became less spatially focused, or, in other words, less spatially concentrated, as the Gini index (G T ) show a decreasing pattern5, changing from 0.78 in 2000 to 0.72 in 2015 which represents a reduction of approximately 7% along the period.
Table 1 Migratory Gini index and its Decomposition
| - | - | - | Period | - | - | - | - | - | - |
|---|---|---|---|---|---|---|---|---|---|
| - | 2000 | 2010 | 2015 | 2000 | 2010 | 2015 | 2000 | 2010 | 2015 |
| Flows | - | Total | - | - | Skilled | - | - | Unskilled | - |
| 𝐺𝑇 𝑅⦁ | 0.022 | 0.021 | 0.021 | 0.021 | 0.021 | 0.020 | 0.023 | 0.022 | 0.021 |
| 𝐺𝑇 ⦁𝐶 | 0.021 | 0.020 | 0.020 | 0.020 | 0.020 | 0.020 | 0.022 | 0.021 | 0.020 |
| 𝐺𝑇 𝑅𝐶,𝐶𝑅 | 0.000 | 0.000 | 0.000 | 0.000 | 0.000 | 0.000 | 0.000 | 0.000 | 0.000 |
| 𝐺𝑇 𝑂𝑡ℎ𝑒𝑟𝑠 | 0.735 | 0.697 | 0.683 | 0.716 | 0.698 | 0.690 | 0.752 | 0.711 | 0.699 |
| 𝐺𝑇 | 0.779 | 0.739 | 0.724 | 0.758 | 0.739 | 0.730 | 0.797 | 0.754 | 0.741 |
Source: Own elaboration, 2019
Even though total internal migration is still characterized by unequal stream flows, some interesting patterns emerge when comparing the type of human capital. Figure 4 shows a that the unskilled tend show higher migration inequality as compared to the skilled, although such gap tends to diminish and almost converge by 2015. Hence, the largest reduction in the inequality indicator is exhibited by the unskilled as compared to the skilled6. This suggest that some states, as destination of migrants, began to emerge as an option for both skilled and unskilled populations, with a higher effect on the latter group. This result may not be surprising as unskilled migrants might not be as selective as the skilled migrants in terms of selecting a state to migrate. For the skilled migrants, they tend to concentrate in states that offer well paid job opportunities which tend to occur in fewer states.
In order to investigate what states may have played a role on attracting or sending out migrants relative to the whole system of flows, the next step consists on analyzing the outflow and inflow field Gini indices for each state. One way to do it is through standardizing the Gini index values in a form of z-score. Following Lee and Hewings (2015), a positive z-score suggests that a state's migration flows are more spatially focused than average, indicating in turn its strong role in the interstate migration system. Negative z-scores indicate state's fields broader, or less focused. Negative z-scores for inflows indicate that migrants are sent from diverse origin states, whereas negative z-scores for the outflow field Gini index suggest that migrants are sent to widely dispersed destinations. When a 45◦ line is drawn on the scatter plots the relative magnitudes of the standardized outflows and inflows field indices can be compared and located states are plotted above the 45◦ line, for example, those with larger z-score of inflow field index than that of outflow are the ones where outflow is relatively uniform across all destinations, whereas inflow is more highly focused and comes from selective origins. States plotted below the 45◦ line represent to have a larger outflow field index values than inflow field index values. The state that falls into the latter category is one where inflow is relatively uniform across all origins while outflow goes to selective destinations wherever they might be.
An state with a z-score of the row field index value greater than 1 implies that the state has spatially focused destinations for its outflows, whereas the state whose z-score of the column field index is greater than 1 means that the source states of its inflows are spatially focused. Furthermore, each states's z-score can be located in a graph divided by four quadrants from which the appropriate interpretation is as follows (Plane and Mulligan, 1997):
Quadrant I: Focused (upper right), it refers to the states that send and receive migrants from relatively few states.
Quadrant II: Pure Inward (upper left), it refers to the states that have strongly focused destinations for inmigration but moderately broad outmigration.
Quadrant III: Redistributors (bottom left), it refers to the states showing a relatively broad interaction within the migration system.
Quadrant IV: Pure Outward (bottom right), it refers to states that have strongly focused destinations for outmigration but moderately broad inmigration.
Figure 5 shows the results of the migratory Gini Index z-scores for the skilled and unskilled in the period 2010-2015, Appendix A4 and A5 shows the complete set of results for the rest of the periods7. Furthermore, Table 2 describes state's typology according to the distribution of the z- score in each period and by type of human capital. The number of states in each quadrant and period is recorded and those that repeat in the three periods are identified in bold. The results are especially relevant for quadrant III as to identify states playing as redistributors of human capital. These are states showing a relatively broad interaction within the migration system. For the skilled, comparing the initial and final period, the number of states serving as redistributed increased from 11 to 12 states. While Coahuila (COAH) and Queretaro (QRO) entered as redistributors states, Michoacan (MICH) and Tabasco (TAB) left the group. In the case of the unskilled, the number of states in quadrant III increased from 11 to 14 states. The states that entered into these group are Coahuila (COAH), Jalisco (JAL), Sonora (SON), and Querétaro (QRO) where only the state of Nuevo Leon (NL) left the group.
The association level was measured by means a simple linear regression model (SLRM) among the Gini indexes, where the dependent and independent variables are in-migration and out-migration, respectively. The highest determination coefficient R2 both for skilled and unskilled labor was found for 2015, in other words the relationship is increasing. It can be also observed that the regression model has best explanatory capacity for the skilled flows for all years. See Appendix 2 and 3 for all the Gini indexes at state level and the Migration Field Diagrams respectively.
Source: Own elaboration, 2019
Figure 5 Skilled (upper) and unskilled (lower) migrants by states, 2010-2015
Table 2 Typology of focusing interstate inflow and outflow fields for 1995-2000, 2005-2010 and 2010-2015
Source: Own elaboration, 2019
Finally, the results associated to quadrant III concentrate states experiencing internal migration dynamism not only by attracting but also sending migrants to other states. These states also differentiate from the rest for having better economic growth performance along the period. For example, As showed in Figure 6, these states had in average an annual growth rate of GDP per capita of 1.8% which is higher than the other quadrants, see Figure 6. The particular cases of Queretaro (QRO) and Jalisco (JAL) stand out as they have become poles of economic development in central and central northern Mexico. On the contrary, quadrants II and IV have exhibited annual growth rates almost half of that corresponding to leading economic states.
Conclusion
The results presented in study show changes in the internal migration patterns of both skilled and unskilled labor in Mexico during the periods 1995-2000, 2005-2010, and 2010-2015. The relationship of domestic labor mobility with regional transformations as a result of new geographical patterns of location of investment, production and economic agglomeration is also made evident.
The analysis of the mobility of labor within the country is in turn relevant to a given endowment of skilled and unskilled labor, and where both positive and negative net balances necessarily imply changes in the magnitude of migratory flows between states. The migratory Gini index has been showed as a useful element to have a better understanding of migration to urban areas, depending on the type of labor. It also illustrates the links between states within the country in terms of migration over time.
Among the main findings are the following. While some states in the Northern region have experienced a net decrease in the number of migrants, both unskilled and skilled, states in the Central region, such as Queretaro, has been the one reporting the greatest gain of migrants with respect to other regions of the country, particularly in the period 2010-2015. These results also suggest the consolidation of the Central region as a potential new development pole of the country this is due to increasing role on redistributing human capital in Mexico.

