




 Inglês (pdf)
 Artigo em XML
 Referências do artigo

 Tradução automática
 Enviar este artigo por email
 Citado por SciELO
 Similares em
SciELO

 Permalink

Introduction
A seismic sequence is defined by several earthquakes that occur in a short period of time (from days to a few months), with little or no hypocentral distance between them. They can consist of different magnitudes and are associated with an easily recognizable main event. Some seismic sequences may comprise earthquakes with similar magnitudes between them, but when there is not a recognizable main event, these sequences are called swarms (i.e., Hill, 1977; USGS, 2004).
In central Costa Rica, several seismic sequences occur during a year. When seismic sequences are registered at the National Seismological Network of Costa Rica (RSN: UCR-ICE), each earthquake is manually located to update the national catalog. The analysis and characterization of the sequence and its source is regularly done with a manual relocation of each event only. However, this is not ideal because the event scattering in the clusters does not allow having a constrained source location.
In order to get a higher resolution of the hypocenter location of the events, in these article four seismic sequences were post processed with an initial manual location, and then a cross correlation to obtain an order of magnitude more precise than first motion picks as in Waldhauser and Ellsworth (2000) and relocated with the double difference relocation algorithm. The selected sequences had optimal station coverage, short distance to the stations and short hypocentral distance between events.
The first sequence occurred in Tobosi, in the province of Cartago, in December 2011. It was manually located and defined as a swarm in Araya et al. (2015). The other three sequences occurred in the first semester of 2015; one at San Isidro del General, and the other two at Llano Grande of Cartago (Fig. 1).
Tectonic Setting
On a regional scale, the four sequences took place at the Central Costa Rica Deformed Belt (CCRDB) or nearby, on the Caribbean Plate (Fig. 2). This belt is a ~100 km broad zone that connects the Middle American Trench on the Pacific side to the North Panama Deformed Belt on the Caribbean (Marshall et al., 2000), and represents the western boundary of the Caribbean Plate to the Panama Microplate (i.e., Marshall et al., 2000; Montero, 2001). The deformation in this zone is generated by the stress accumulated in the overriding plate from the subduction of the Cocos Plate in an oblique direction underneath the Caribbean plate, at a rate of 8 cm per year (i.e., McCaffrey, 1996; Barckhausen et al., 2001; DeMets, 2001; LaFemina et al., 2009).
Local tectonics
When a shallow (<20 km) earthquake occurs on the overriding plate, the RSN: UCR-ICE automatically categorizes its source as a local fault.

Fig. 1: Analyzed seismic sequences clusters. The black triangles are the stations used, the unfilled circles the initial epicenters of the events and the squares are the cluster areas.
Costa Rica has an active fault catalog, but as the sequences of earthquakes scatter several kilometers apart, it becomes difficult to relate the events to a specific fault.
The first earthquake sequence studied in this article is the Tobosi earthquake swarm. It was located at the Tobosi Fault, between two major left-lateral, strike-slip fault systems called the Aguacaliente fault and the Navarro fault (i.e., Montero, 2001; Fernández and Montero, 2002; Araya et al., 2015). The second sequence is the San Isidro sequence, that occurred near the N12W right-lateral strike slip of the Buenavista Fault, and was responsible for the 6.3 Mw Buenavista Earthquake in 1983 (i.e., Boschini et al., 1988; Ekström et al., 2012). The last two Llano Grande seismic sequences occurred in April and May 2015, at the south flank of the Irazú volcano, known to be an active landslide zone
Method
Several open-source programs are used in order to process earthquake sequences; some of them belong to the earthquake analysis software package called “SeisAn”, by Ottemöller et al. (2011). The SeisAn programs used for the research presented in this article were: “Hypocenter” for the manual localization, “corr” for the cross correlation between events, and “xclust” to separate the events into families with the same source. The program used for the double difference algorithm analysis was “HypoDD”, by Waldhauser and Ellsworth (2000), which uses the catalog data from the networks and the crosscorrelation of the events.
All sequences were post-processed simultaneously to treat them with the same conditions. To guarantee the good quality of each earthquake location, the selection of the events was based on Husen and Hardebeck (2010). The same analyst located each event manually, and picked the P and S wave arrival times on at least 8 stations, with a weight based on its certainty. The station coverage was of at least 180 degrees around each event. In the earthquake processing, the sea level was considered as zero depth and the station corrections were not taken into account.
The velocity model used for the relocation is the same seven-layer velocity model from RSN: UCR-ICE, which was modified by adding more layers, in order to smooth the velocity change with depth to an eleven layers one dimensional model, as suggested in Waldhauser (2001).
After the seismic events were manually located, they were cross-correlated to determine if they were close enough to be originated by the same source.
The cross-correlation configuration depended on the number of stations available for each sequence. This, since the RSN had fewer stations in 2011 than in 2015. The cross-correlated event pairs should correlate at least 70%, with a minimum of 5 correlated channels, a maximum distance of 10 km between events, and from the stations to the events a maximum distance of 63 km. After the cross correlation, the events were separated into “groups or families” to find out if they had to be processed as one or more sources in HypoDD. Next, the double difference relocation method was applied. Here, the cross-correlation delay-time data (CC) and the P and S wave travel time data from the RSN catalog (CT) are mixed. Table 1 shows the configuration of the HypoDD program for each analyzed earthquake sequence.
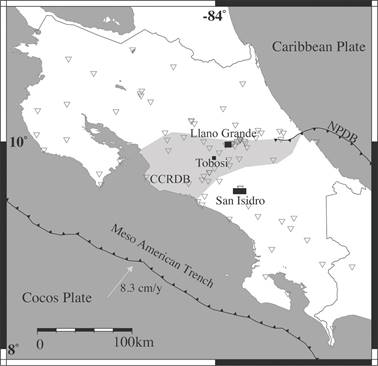
Fig. 2: Tectonic setting and location of the earthquake sequences and stations employed. The CCRDB is the Central Costa Rican Deformed Belt, and the NPDB is the North Panama Deformed Belt. The black squares are the sequence initial areas, and the grey lined triangles the seismic stations used.
Each seismic sequence was iterated twice with the configuration shown in Table 2, where the distances between events, and between clusters and stations are defined depending on whether the input data comes from the CT or the CC output, all the source relocations started from the network solution. Finally, the relocation made with HypoDD was compared with the CT data.
Input Data
Tobosi
This 21-earthquake sequence that occurred over 90 days between December 2011 and February 2012. The maximum distance between earthquakes was 12 km (with an average of 4.25 km), and their depths ranged between 0.1 km and 9.4 km. The events were registered in 27 stations, with 10.5 km being the closest event-station distance. The moment magnitudes (Mw) varied between 2.4 and 3, with no distinguishable main event.
Table 1 Catalog phase conversion to HypoDD configuration.
| Sequences | Maximum distance between event pairs and stations | Maximum hypo- central separation (km) | Maximum neighbors per event | Minimum links to define a neighbor | Minimum links per pairs saved |
|---|---|---|---|---|---|
| Tobosi | 50 | 15 | 12 | 4 | 4 |
| San Isidro | 60 | 10 | 10 | 4 | 4 |
| Llano Grande A | 50 | 6 | 12 | 8 | 8 |
| Llano Grande B | 50 | 10 | 12 | 4 | 4 |
San Isidro del General
This 38-earthquake sequence occurred over 35 days, between April and May 2015. Its initial depths ranged between 13.0 km to 18.7 km. The maximum distance between earthquakes was 9.2 km, with an average of 4.6 km. They were registered at 66 stations, with the closest event-station distance being 2.7 km. The moment magnitudes ranged between 2.1 and 5.1, and the main event was the second earthquake of the sequence.
Llano Grande A
The first Llano Grande sequence (A) consisted of 35 earthquakes that occurred in three days at the end of May 2015. The initial depths ranged between 0.1 km and 2.5 km. The maximum distance between events was 4 km. Forty stations registered the events, with 5.1 km being
the minimum event-station distance. The moment magnitudes were between 2.0 and 4.9, and the 4th earthquake of the sequence was the main event.
Table 2 Cross-Correlation and Catalog events weighing for HypoDD.
| Seismic squence | Distance from cluster centroid to station (km) | Minimum observed pairs CC & CT | Iteration | P&S weight CC | P&S weight CT | Distance between CC & CT linked pairs |
|---|---|---|---|---|---|---|
| Tobosi | 70 | 8/8 | 1 | 1/0.5 | 1/0.25 | 10 |
| - | - | - | 2 | 0.7/0.7 | 1/0.25 | 10 |
| San Isidro | 70 | 7/7 | 1 | 1/1 | 1/0.75 | 10 |
| - | - | - | 2 | 1/1 | 1/0.5 | 6 |
| Llano Grande A | 100 | 8/8 | 1 | 1/1 | 1/0.5 | 10 |
| - | - | - | 2 | 1/0.5 | 1/0.5 | 10 |
| Llano Grande B | 50 | 10/10 | 1 | 1/0.1 | 1/0.5 | 10 |
| - | - | - | 2 | 1/0.1 | 1/0.5 | 10 |
Llano Grande B
The second Llano Grande sequence (B) comprised 64 earthquakes that also occurred in three days, on mid July 2015. The depths varied between 0.1 km and 5.1 km. The maximum distance between events was 6.8 km, with an average of 5.9 km. The events were registered at 54 stations, with the closest event-station distance being 3.3 km. The moment magnitudes were between 2.3 and 4.3, and the main earthquake was the 5th event of the sequence, followed by 59 aftershocks.
Results
Seismic sequence processing
Tobosi swarm relocation
After the manual relocation of 21 earthquakes, 12 satisfied the minimum quality for the cross-correlation, from which 30 delay-time event pairs were obtained. The correlation of the event pairs was between 75% and 93%, which shows that they belong to a single group. Twelve earthquakes were taken into account for this double difference relocation, which used 705 P and 199 S wave arrival pairs were used, and had a mean CC RMS of 0.0402 s and CT of 0.0487 s. After the relocation, the earthquake sequence scattered in latitude between 9.8321 and 9.8387, in longitude between -84.0095 and -84.0048, and in depth between 3.13 km and 3.84 km. The mean error in the x-y-z axis, and time were 61.1 m, 38.2 m, 165.4 m and 0.0121 s. Lastly, the phase coherency was 93 % and the pick quality of 86 % (Fig. 3 A, Table 3).
The sequence demonstrated a stable behavior throughout the approximate 22 days (Fig.3 B, C, D) in latitude, longitude and in depth. The swarm varied slightly from east to west, while the latitude had a more evident change, beginning from north to south, and then north back again.
San Isidro del General seismic sequence processing
Past the manual relocation of 37 earthquakes, 32 events satisfied the minimum quality for the cross-correlation. Twenty-nine events were cross-correlated, and 113 delay-time event pairs were obtained from a single group. The cross-correlation of the event pairs was between 76 % and 93 %. Twenty-three earthquakes were relocated with HypoDD. The double difference relocation resulted from 1684 P and 873 S wave arrival pairs. The final CC RMS was 0.0324 s, and 0.0796 s for the CT. This earthquake sequence scattered in latitude between 9.5237 and 9.5353, in longitude from -83.7331 to -83.7282, and in depth between 15.10 km and 17.62 km (Fig. 4 A, Table 4). The mean error in the x-yz axis, and time were 158.9 m, 97.5 m, 175.4 m and 0.0224 s. The phase coherency was 93 % and the pick quality 86 %.
This sequence initiated with one premonitory event, followed by the main event, 10 minutes after. Through the sequence the longitude was very stable, but the latitude changed from north to south with few jumps back and forth, and the depth had a tendency of getting shallower through time (Fig. 4 B, C, D).
Llano Grande A seismic sequence processing
After manually relocating 35 earthquakes, 23 satisfied the minimum quality for the crosscorrelation. Twenty-three events were cross-correlated, with 91 delay-time event pairs that belonged to a single group. The cross-correlation of the event pairs was between 70 % and 91 %. Fifteen earthquakes were used for this double difference, which used 2245 P wave arrival pairs, 582 S wave arrival pairs, and had a CC RMS of 0.0597 s and a CT an RMS of 0.0889 s. The earthquake sequence scattered in latitude from 9.9507 to 9.9759, in longitude between -83.8875 and -83.8689, and in depth from 0.341 km to 1.949 km. The mean error in the x-y-z axis, and time were 13.81 m, 14.1 m, 135.4 m and 0.0887 s. The phase coherency was 92 % and the pick quality of 90 % (Fig. 5 A, Table 5).
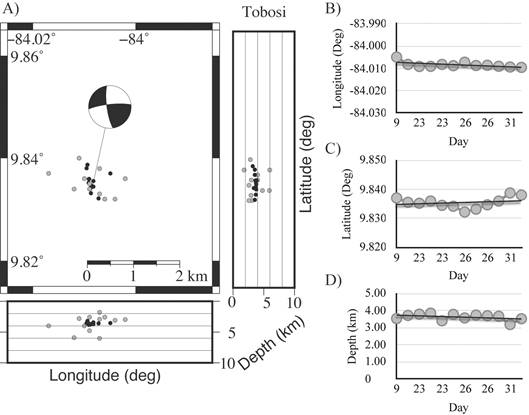
Fig. 3: This figure show in A) the relocation of the Tobosi swarm, and the focal mechanism of the December 26 2011 at 3:21. Grey dots represent the national catalog initial manual locations. Black dots are the events after HypoDD. The B - C - D) Are the longitude, latitude and depth through time, respectively. The black line represents a linear tendency of the events.
Table 3 HypoDD Tobosi relocation results.
| ID | Latitude | Longitude | Depth (km) | Year | Month | Day | Hour | Minute | Error CC | Error CT |
|---|---|---|---|---|---|---|---|---|---|---|
| 1 | 9.837 | -84.005 | 3.54 | 2011 | 12 | 9 | 11 | 50 | 0.021 | 0.050 |
| 2 | 9.836 | -84.008 | 3.72 | 2011 | 12 | 22 | 20 | 22 | 0.014 | 0.045 |
| 3 | 9.835 | -84.009 | 3.79 | 2011 | 12 | 23 | 5 | 0 | 0.035 | 0.043 |
| 4 | 9.836 | -84.009 | 3.85 | 2011 | 12 | 23 | 18 | 5 | 0.033 | 0.052 |
| 5 | 9.834 | -84.008 | 3.40 | 2011 | 12 | 23 | 20 | 44 | 0.036 | 0.034 |
| 6 | 9.834 | -84.009 | 3.78 | 2011 | 12 | 26 | 1 | 11 | 0.058 | 0.032 |
| 7 | 9.832 | -84.007 | 3.57 | 2011 | 12 | 26 | 2 | 17 | 0.074 | 0.066 |
| 8 | 9.833 | -84.009 | 3.74 | 2011 | 12 | 26 | 3 | 21 | 0.036 | 0.045 |
| 9 | 9.835 | -84.009 | 3.70 | 2011 | 12 | 26 | 3 | 37 | 0.032 | 0.055 |
| 10 | 9.836 | -84.009 | 3.67 | 2011 | 12 | 27 | 14 | 43 | 0.021 | 0.058 |
| 11 | 9.839 | -84.009 | 3.19 | 2011 | 12 | 31 | 7 | 46 | 0.030 | 0.042 |
| 12 | 9.838 | -84.010 | 3.53 | 2011 | 12 | 31 | 8 | 11 | 0.024 | 0.044 |
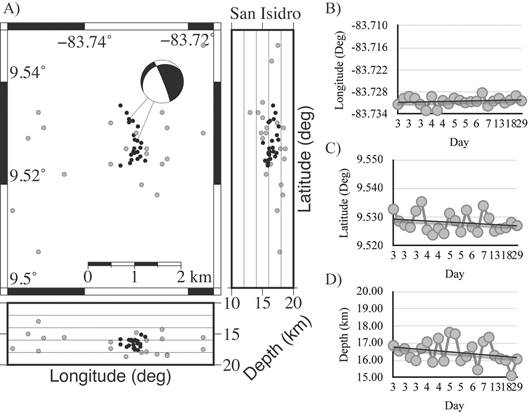
Fig. 4: This figure show in A) the relocation of the San Isidro seismic sequence. Grey dots represent the national catalog initial manual locations. Black dots are the events after HypoDD. The focal mechanisms correspond to the first sequence event on the 3rd of April 2015 at 18:32 and on the final event on April 20th 2015 at 00:50. The B - C - D) longitude, latitude and depth through time, respectively. The black line represents a linear tendency of the events.
This sequence lasted 27 h; the first 6 h, the latitude and longitude were very stable. Then, the source moved towards the northeast and back, and then northeast again, 22 h after the first event. The depth was more stable than the last mentioned dimensions, but skipped between 0 and 2 km (Fig. 5 B, C, D).
Llano Grande B seismic sequence processing
Subsequent to the manual relocation of 64 earthquakes, 58 were selected to satisfy the minimum quality for the cross-correlation. Forty-three cross-correlated events resulted in a single group of 94 delay-time event pairs. The cross-correlation was between 70 % and 96 % between event pairs. For the double difference relocation, for which 44 earthquakes were taken into consideration, it was used 7255 P wave arrival pairs, and 1936 S wave arrival pairs. The final CC RMS was 0.0486 s, and 0.0968 s for the CT. The earthquake sequence scattered in latitude from 9.9577 to 9.9817, in longitude from -83.8714º to -83.8632, and in depth from 0.280 km to 2.60 km. The mean error in the x-y-z axis, and time were 15.9 m, 21.6 m, 105.3 m and 0.0141 s. The phase coherency was 92 % and the pick quality of 93 % (Fig. 6 A, Table 6).
This Llano Grande sequence was stable in longitude only. The latitude jumped back and forth, with a tendency to move towards the north; while the depth had a tendency to increase through time (Fig. 6 B, C, D).
Table 4 HypoDD San Isidro relocation results.
| ID | Latitude | Longitude | Depth | Year | Month | Day | Hour | Minute | Error CC | Error CT |
|---|---|---|---|---|---|---|---|---|---|---|
| 1 | 9.533 | -83.731 | 16.85 | 2015 | 4 | 3 | 18 | 32 | - | 0.107 |
| 2 | 9.529 | -83.730 | 16.54 | 2015 | 4 | 3 | 18 | 42 | - | 0.063 |
| 3 | 9.527 | -83.729 | 16.67 | 2015 | 4 | 3 | 18 | 50 | 0.056 | 0.056 |
| 4 | 9.526 | -83.730 | 16.16 | 2015 | 4 | 3 | 19 | 0 | 0.027 | 0.055 |
| 5 | 9.532 | -83.731 | 15.98 | 2015 | 4 | 3 | 19 | 43 | - | 0.092 |
| 7 | 9.535 | -83.733 | 16.69 | 2015 | 4 | 3 | 20 | 33 | 0.046 | 0.085 |
| 8 | 9.525 | -83.729 | 17.06 | 2015 | 4 | 4 | 0 | 5 | 0.033 | 0.077 |
| 10 | 9.524 | -83.733 | 15.88 | 2015 | 4 | 4 | 3 | 1 | 0.036 | 0.077 |
| 12 | 9.526 | -83.730 | 17.27 | 2015 | 4 | 4 | 7 | 14 | 0.031 | 0.073 |
| 15 | 9.524 | -83.731 | 15.95 | 2015 | 4 | 4 | 20 | 48 | 0.020 | 0.078 |
| 16 | 9.531 | -83.730 | 17.62 | 2015 | 4 | 5 | 4 | 1 | 0.029 | 0.062 |
| 17 | 9.529 | -83.730 | 17.53 | 2015 | 4 | 5 | 4 | 24 | 0.039 | 0.066 |
| 18 | 9.525 | -83.731 | 15.97 | 2015 | 4 | 5 | 8 | 3 | 0.031 | 0.058 |
| 19 | 9.532 | -83.731 | 16.21 | 2015 | 4 | 6 | 0 | 43 | 0.069 | 0.099 |
| 20 | 9.526 | -83.731 | 16.78 | 2015 | 4 | 6 | 3 | 9 | - | 0.131 |
| 21 | 9.525 | -83.728 | 15.44 | 2015 | 4 | 6 | 20 | 42 | 0.032 | 0.102 |
| 22 | 9.534 | -83.732 | 17.08 | 2015 | 4 | 7 | 23 | 50 | 0.037 | 0.075 |
| 23 | 9.530 | -83.731 | 17.33 | 2015 | 4 | 8 | 0 | 24 | 0.038 | 0.071 |
| 25 | 9.525 | -83.730 | 16.28 | 2015 | 4 | 13 | 11 | 38 | 0.034 | 0.075 |
| 26 | 9.526 | -83.731 | 16.08 | 2015 | 4 | 13 | 14 | 0 | 0.029 | 0.064 |
| 27 | 9.526 | -83.730 | 15.99 | 2015 | 4 | 18 | 8 | 45 | 0.023 | 0.079 |
| 29 | 9.528 | -83.729 | 15.10 | 2015 | 4 | 20 | 0 | 50 | 0.035 | 0.071 |
| 30 | 9.527 | -83.730 | 16.06 | 2015 | 4 | 29 | 0 | 16 | 0.014 | 0.081 |
Discussion and Conclusions
All the sequences selected for the relocation with HypoDD had depths < 20 km, so their source wouldn’t be directly associated to the subduction between the Cocos and Caribbean plates. For the relocation software if the events are too shallow it can be a problem because the one dimensional velocity model used does not take into account the heterogeneities of the upper layers of the crust. So taking this into account any result obtained has an error induced by the differences between the velocity model and the actual heterogeneities of the layers of the crust.
The quality of the events registered provided well constrained initial locations for the relocation. As a result from the post-process of the four seismic sequences, between 57 % and 76 % percentage of earthquakes used from the manually located earthquakes were used to carry out the double difference relocation. This difference derives from the events that did not correlate (outlier earthquakes and airquakes (events above sea level), and were removed during the relocation.
The Tobosi swarm was associated to the Tobosi fault in Araya et al. (2015). Once the double difference relocation of the sequence was performed, the focal mechanism of the first event was re-calculated by fixing the depth, to test if the focal mechanism changed with the new location. The strike, dip and rake of the planes obtained were: 264, 80 and 12 first and then, 171, 78 and 170. These solutions match the previously published planes: N84E, 80º, left lateral, strike slip fault or N9W, 78º, right lateral, strike slip fault; therefore, in this article the swarm was still associated to the Tobosi fault. These results suggest that the focal mechanism may not change with the double difference relocation and that with only the manual location a good focal mechanism can be obtained, if the event is well registered.
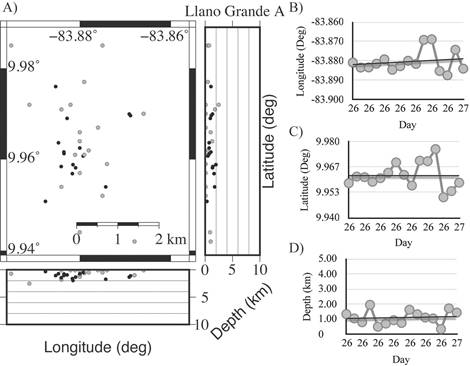
Fig. 5: This figure show in A) Relocation of the Llano Grande A seismic sequence. Grey dots represent the national catalog initial manual locations. Black dots are the events after HypoDD. The B - C - D) Longitude, latitude and depth through time, respectively. The black line represents a linear tendency of the events.
The swarm source was restricted from 4.8 km2 to an area of 0.9 km2, with the source centroid at latitude 9.8354º N, longitude 83.008º W, and 3.624 km deep (Fig. 3). Finally, during the time lapse of this sequence, the source triggering moved mainly toward the west.
After the relocation, the San Isidro sequence source area was restricted from 60 km2 to an area of 2.75 km2, with the source centroid at 9.5280º W latitude, 83.7305º N longitude and 16.456 km deep. During the time lapse of this sequence, the source triggering moved towards the south and became shallower.
Table 5 HypoDD Llano Grande (A) relocation results.
| ID | Latitude | Longitude | Depth | Year | Month | Day | Hour | Minute | Error CC | Error CT |
|---|---|---|---|---|---|---|---|---|---|---|
| 1 | 9.958 | -83.881 | 1.33 | 2015 | 5 | 26 | 2 | 19 | 0.077 | 0.093 |
| 3 | 9.962 | -83.883 | 1.05 | 2015 | 5 | 26 | 2 | 50 | 0.054 | 0.074 |
| 4 | 9.961 | -83.883 | 0.79 | 2015 | 5 | 26 | 3 | 25 | 0.055 | 0.080 |
| 6 | 9.959 | -83.881 | 1.95 | 2015 | 5 | 26 | 4 | 30 | 0.112 | 0.085 |
| 7 | 9.961 | -83.879 | 0.49 | 2015 | 5 | 26 | 4 | 56 | 0.029 | 0.090 |
| 9 | 9.964 | -83.885 | 0.71 | 2015 | 5 | 26 | 6 | 45 | 0.077 | 0.098 |
| 10 | 9.969 | -83.883 | 0.93 | 2015 | 5 | 26 | 7 | 12 | 0.007 | 0.098 |
| 11 | 9.963 | -83.880 | 0.75 | 2015 | 5 | 26 | 8 | 15 | 0.030 | 0.066 |
| 12 | 9.957 | -83.882 | 1.62 | 2015 | 5 | 26 | 8 | 37 | 0.092 | 0.084 |
| 13 | 9.970 | -83.869 | 1.33 | 2015 | 5 | 26 | 8 | 41 | 0.019 | 0.103 |
| 14 | 9.970 | -83.869 | 1.11 | 2015 | 5 | 26 | 10 | 2 | 0.019 | 0.125 |
| 16 | 9.976 | -83.885 | 1.04 | 2014 | 5 | 26 | 11 | 33 | - | 0.097 |
| 17 | 9.951 | -83.888 | 0.34 | 2015 | 5 | 26 | 13 | 9 | - | 0.081 |
| 20 | 9.954 | -83.874 | 1.72 | 2015 | 5 | 27 | 0 | 39 | - | 0.087 |
| 21 | 9.958 | -83.884 | 1.43 | 2015 | 5 | 27 | 5 | 16 | - | 0.071 |
The focal mechanisms calculated for the two mayor magnitude events had as plane solutions in strike, dip and rake: 239, 24, -11 first, and then, 339, 85, and -113. These planes are a normal, leftlateral oblique fault and a normal, right-lateral oblique fault, respectively (Fig. 4). Compared to the aftershocks analyzed in Boschini et al. (1988), this 2015 sequence is a very restricted in area. Former Boschini et al. (1988) sequences occurred in 400 km2, whereas this 2015 sequence happened in approximately 1 km2, two kilometers deeper and almost parallel to the Buenavista Fault possibly due to double difference the relocation and a better station coverage.
Because of the cluster distribution of the events and the focal mechanisms obtained, parallel to the Buenavista Fault, it is inferred that the Buenavista Fault is the source for this seismic sequence.
The two Llano Grande seismic sequences were really close from each other. The A sequence source area initially was 49 km2, but after the relocation, it was 18 km2, with the source centroid at 9.9621º N latitude, 83.8804º W longitude, and 1.105 km deep. This sequence source moved toward the northeast through time.
The manual location of the B sequence source resulted in 34 km2, and after the relocation, 7 km2, with the source centroid at lat. 9.9660º N, long. 83.8667º W, and 1.180 km deep. During the time lapse of this sequence, the source moved towards the north, and the depths increased through time. These sequences occurred at very shallow depths and were not associated to any known active landslide area in the south flank of the Irazú volcano or any known active fault so these sequences would need a more detailed analysis to define the source or its sources, like moment tensor inversion.
Table 5 HypoDD Llano Grande (A) relocation results.
| ID | Latitude | Longitude | Depth | Year | Month | Day | Hour | Minute | Error CC | Error CT |
|---|---|---|---|---|---|---|---|---|---|---|
| 4 | 9.970 | -83.868 | 1.14 | 2015 | 7 | 18 | 6 | 11 | 0.040 | 0.094 |
| 5 | 9.970 | -83.868 | 1.15 | 2015 | 7 | 18 | 6 | 14 | - | 0.084 |
| 6 | 9.966 | -83.865 | 1.08 | 2015 | 7 | 18 | 6 | 17 | - | 0.091 |
| 7 | 9.963 | -83.865 | 0.47 | 2015 | 7 | 18 | 6 | 31 | 0.017 | 0.091 |
| 9 | 9.962 | -83.867 | 0.58 | 2015 | 7 | 18 | 6 | 40 | - | 0.083 |
| 11 | 9.961 | -83.864 | 0.28 | 2015 | 7 | 18 | 6 | 46 | - | 0.078 |
| 12 | 9.960 | -83.865 | 0.29 | 2015 | 7 | 18 | 7 | 2 | - | 0.136 |
| 13 | 9.968 | -83.868 | 0.92 | 2015 | 7 | 18 | 7 | 10 | 0.028 | 0.095 |
| 14 | 9.972 | -83.866 | 0.33 | 2015 | 7 | 18 | 7 | 17 | 0.087 | 0.101 |
| 15 | 9.973 | -83.866 | 0.92 | 2015 | 7 | 18 | 7 | 25 | - | 0.134 |
| 16 | 9.961 | -83.863 | 0.41 | 2015 | 7 | 18 | 7 | 32 | 0.061 | 0.093 |
| 18 | 9.968 | -83.868 | 1.23 | 2015 | 7 | 18 | 8 | 10 | - | 0.113 |
| 19 | 9.968 | -83.870 | 2.04 | 2015 | 7 | 18 | 8 | 48 | 0.067 | 0.098 |
| 20 | 9.962 | -83.864 | 0.68 | 2015 | 7 | 18 | 9 | 10 | 0.056 | 0.122 |
| 21 | 9.963 | -83.866 | 0.30 | 2015 | 7 | 18 | 9 | 39 | 0.076 | 0.089 |
| 22 | 9.974 | -83.866 | 1.55 | 2015 | 7 | 18 | 9 | 40 | - | 0.087 |
| 23 | 9.966 | -83.870 | 2.40 | 2015 | 7 | 18 | 9 | 50 | - | 0.087 |
| 25 | 9.962 | -83.865 | 1.69 | 2015 | 7 | 18 | 9 | 59 | 0.066 | 0.082 |
| 27 | 9.961 | -83.865 | 0.50 | 2015 | 7 | 18 | 10 | 7 | 0.067 | 0.095 |
| 29 | 9.960 | -83.864 | 0.40 | 2015 | 7 | 18 | 10 | 13 | 0.037 | 0.092 |
| 30 | 9.965 | -83.871 | 1.89 | 2015 | 7 | 18 | 10 | 25 | 0.076 | 0.110 |
| 31 | 9.972 | -83.867 | 0.99 | 2015 | 7 | 18 | 10 | 34 | 0.034 | 0.081 |
| 32 | 9.959 | -83.864 | 0.41 | 2015 | 7 | 18 | 10 | 42 | 0.002 | 0.097 |
| 33 | 9.963 | -83.865 | 0.35 | 2015 | 7 | 18 | 10 | 44 | 0.059 | 0.087 |
| 34 | 9.961 | -83.867 | 1.85 | 2015 | 7 | 18 | 10 | 47 | 0.078 | 0.077 |
| 36 | 9.968 | -83.868 | 0.72 | 2015 | 7 | 18 | 10 | 58 | 0.043 | 0.096 |
| 38 | 9.974 | -83.868 | 0.95 | 2015 | 7 | 18 | 11 | 27 | - | 0.080 |
| 39 | 9.972 | -83.864 | 0.65 | 2015 | 7 | 18 | 11 | 29 | - | 0.109 |
| 40 | 9.959 | -83.864 | 1.85 | 2015 | 7 | 18 | 12 | 12 | - | 0.107 |
| 41 | 9.976 | -83.871 | 2.33 | 2015 | 7 | 18 | 12 | 22 | - | 0.087 |
| 42 | 9.981 | -83.871 | 2.60 | 2015 | 7 | 18 | 12 | 28 | - | 0.110 |
| 43 | 9.968 | -83.870 | 1.61 | 2015 | 7 | 18 | 12 | 57 | - | 0.127 |
| 44 | 9.958 | -83.865 | 0.53 | 2015 | 7 | 18 | 13 | 6 | 0.043 | 0.113 |
| 45 | 9.961 | -83.866 | 2.14 | 2015 | 7 | 18 | 13 | 21 | - | 0.083 |
| 46 | 9.959 | -83.866 | 1.39 | 2015 | 7 | 18 | 13 | 35 | 0.040 | 0.090 |
| 47 | 9.960 | -83.866 | 1.31 | 2015 | 7 | 18 | 13 | 42 | 0.041 | 0.112 |
| 48 | 9.971 | -83.869 | 1.84 | 2015 | 7 | 18 | 14 | 2 | - | 0.074 |
| 49 | 9.961 | -83.865 | 0.58 | 2015 | 7 | 18 | 14 | 22 | 0.030 | 0.089 |
| 50 | 9.960 | -83.868 | 2.13 | 2015 | 7 | 18 | 14 | 25 | - | 0.118 |
| 52 | 9.961 | -83.865 | 1.54 | 2015 | 7 | 18 | 15 | 0 | 0.043 | 0.089 |
| 54 | 9.972 | -83.870 | 0.99 | 2015 | 7 | 18 | 17 | 7 | 0.042 | 0.091 |
| 55 | 9.973 | -83.868 | 0.85 | 2015 | 7 | 18 | 17 | 11 | 0.034 | 0.116 |
| 56 | 9.971 | -83.869 | 2.11 | 2015 | 7 | 19 | 0 | 44 | - | 0.077 |
| 57 | 9.969 | -83.869 | 2.00 | 2015 | 7 | 19 | 1 | 15 | - | 0.076 |
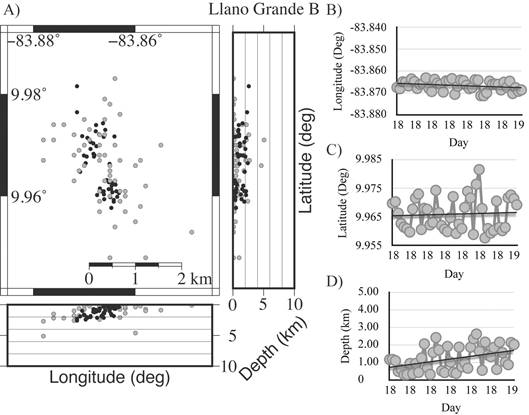
Fig. 6: This figure show in A) Relocation of the Llano Grande B seismic sequence. Grey dots represent the national catalog initial manual locations. Black dots are the events after HypoDD. The B - C - D) Longitude, latitude and depth through time, respectively. The black line represents a linear tendency of the events.
The relocation of these four sequences permitted to reduce its source region up to twenty times the area of the manual relocation, as well as its depths, from a 10 km difference between events to an average of 2 km between events. The separation between events was reduced so that in some cases it was possible to associate with more certainty the source of the events or the source geometry, as in the San Isidro sequence. For this reasons, it is showed the differences and the necessity to implement these post-processing methods as routine processing of future RSN sequence analysis.

