




 Inglês (pdf)
 Artigo em XML
 Referências do artigo

 Tradução automática
 Enviar este artigo por email
 Citado por SciELO
 Similares em
SciELO
 uBio

 Permalink


Introduction
Galliformes species have been closely associated with humans since antiquity, yet their taxonomy remains highly confusing at various levels (Carroll, 1994; Cracraft et al., 2004; Delacour, 1949; Fain & Houde, 2004; Groth & Barrowclough; 1999, Holman, 1961; Madge & McGowan, 2002; McGowan & Panchen, 1994; Salter et al., 2022; Sibley & Ahlquist, 1990). The limits that define species within this group are unclear, and the characteristics used to distinguish between species are associated with allopatric distributions and male plumage variation, across species (Carroll, 1994; Madge & McGowan, 2002). As a result, the number of recognized species in some genera, such as Lophura (Phasianidae), Lagopus (Phasianidae), and Colinus (Odontophoridae), differs among authors (American Ornithologists’ Union (AOU), 1983; AOU, 1998; Carroll, 1994; Delacour, 1949; Hellmayr & Conover, 1942; Madge & McGowan, 2002; Stiles & Skutch, 1989).
Within the genus Colinus, the number of recognized species ranges from three (AOU, 1983; AOU, 1998; Hellmayr & Conover, 1942) to four (Carroll, 1994; Chesser et al., 2024; Gill et al., 2024; Madge & McGowan, 2002; Stiles & Skutch, 1989), with 45 subspecies recognized in a super-species complex (Carroll, 1994; Madge & McGowan, 2002). When only three species are recognized, C. cristatus (Crested Bobwhite) and C. leucopogon (Spot-bellied Bobwhite) are often grouped together as Crested Bobwhite (AOU, 1983, AOU, 1998; Garrigues & Dean, 2014; Hellmayr & Conover, 1942). This grouping was initially proposed by Hellmayr & Conover (1942) and subsequently supported by the AOU (1983) AOU (1998). They argued that the plumage differences between the Central American (C. leucopogon) and South American (C. cristatus) forms are continuous (Hellmayr & Conover, 1942). In contrast, when C. leucopogon and C. cristatus are recognized as two distinct species, the separation is based on differences in male and female crest size, plumage, and color patterns (Carroll, 1994; Madge & McGowan, 2002; Stiles & Skutch, 1989) and supported by genetic reciprocally monophyly (Salter et al., 2022). But, no formal morphological analyses have been done in order to stablish the degree of morphological variation between these groups as a way to delineate species limits.
Acoustic analysis in mating signals is another approach that might produce reliable information to clarify the species status of C. leucopogon (Price, 1998; Slabbekoorn & Smith, 2002; West-Eberhard, 1983). The male bobwhite song attracts females and deter males (Sandoval, 2011b), and in C. leucopogon male song plays an important role in sexual selection (Sandoval, 2008, Sandoval, 2011a; Sandoval & Barrantes, 2012). Divergence in song traits could act as a reproductive barrier between species, potentially through female species recognition, increasing reproductive isolation (de Kort et al., 2002; Irwin, 2000; Irwin et al., 2001). Furthermore, male song in bobwhites is genetically determined (Catchpole & Salter, 2008; Kroodsma, 2004; Konishi, 1963), and in species lacking song learning ability (e.g., Galliformes), song variation has been used as a criterion to delineate species limits (Irwin et al., 2001; Isler et al., 1999; Isler et al., 2005; Isler et al., 2007; Seddon, 2005).
Our objective is to use morphological and acoustic data to test whether the recent taxonomic recognition of C. leucopogon is a distinct species from C. cristatus (Crested Bobwhite). We predict that if morphology and songs serve as distinguishing traits for separating C. leucopogon from C. cristatus, the differences in these traits should be comparable to or greater than those observed between C. nigrogularis (Black-throated Bobwhite) and C. virginianus (Northern Bobwhite), which have long been recognized as distinct species (AOU, 1998; Madge & McGowan, 2002).
Materials and methods
Acoustic Analysis: We analyzed WAV recordings of male songs (Fig. 1) from various sources, including the Cornell Macaulay Sound Library, LS records, commercial audio files (cassette or CD), and private collections (Appendix 1). We used this vocalization restrict to males, because are used for female attraction and male-male interaction (Sandoval, 2011a; Sandoval, 2011b; Sandoval & Barrantes, 2012). In total, we analyzed recordings from 64 individuals from the four bobwhite groups: 10 C. cristatus, 22 C. leucopogon, 8 C. nigrogularis, and 22 C. virginianus. For each recording, we randomly selected and analyze five songs. If a recording contained five or fewer songs, all songs were analyzed.
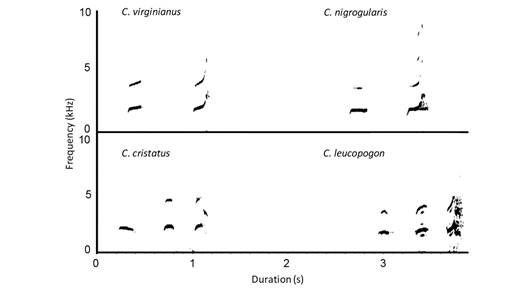
We conducted the song analysis using Raven 1.6 (Cornell Lab of Ornithology, Ithaca, NY, USA) with a combination of waveform window for duration measurements and power spectrum window for frequency measurements. We used 30 dB threshold to select the minimum and maximum frequency of the songs in the power spectrum window. We utilized the spectrogram window for song identification and selection, ensuring that songs overlapping with other sounds in frequency were excluded from the analysis. The following settings were applied in Raven 1.6 to construct the spectrogram window: a temporal resolution of 0.5 s, a frequency resolution of 2 kHz with a Hann window, 256 kHz sampling, and 50% overlap. Songs recorded on cassette were digitized at a sample rate of 44 100 Hz and 16-bit resolution using Cool Edit 2000 version 1.0 (Johnston, 1999) and saved in WAV format.
For each selected song, we measured two groups of frequency and duration characteristics. The first group described the entire song and included: 1) duration (s); 2) minimum frequency (Hz); 3) maximum frequency (Hz); 4) frequency of maximum amplitude (Hz); and 5) the number of elements in the song (discrete parts of the song separated by time or frequency, Fig. 1). The second group focused on individual elements within the song and included: 1) duration (s); 2) time between elements (s); 3) minimum frequency (Hz); 4) maximum frequency (Hz); and 5) frequency of maximum amplitude (Hz, Fig. 1).
We conducted discriminant function analyses (DFA) to estimate which variables of the song discriminate between male songs, following methodologies used in previous studies that employed acoustic characteristics to resolve species differences (e.g., Cadena & Cuervo, 2010; Millsap et al., 2011; Sandoval et al., 2014; Sandoval et al., 2017). In the first DFA, we used the average of each song measurement per recording as dependent variables, with species name as the grouping variable. A second DFA was conducted to compare male song differences among species using all measurements per element. In this DFA, we also used the average of each song element per recording as dependent variable and species name as the grouping variable. We do not pool all the measurements in a single DFA, because some of the measurements in the entire song and elements were the same (i.e., maximum frequency of the entire song and one of the elements), and pooling measurement will count twice the measurements. Both DFAs employed a backward stepwise approach to select the minimum number of song measurements that best distinguished the four bobwhite species. For both analyses, measurements with the lowest F-value were sequentially excluded, and the analysis was rerun after each deletion. This procedure was repeated until we obtained a model with the fewest variables that provided the highest accuracy in species classification based on the jackknife method. We conducted one-way analyses of variance (ANOVA) as post-hoc tests to compare the variation in song measurements selected in each DFA across species.
Morphological Analysis: We measured six morphological characteristics, including: 1) tarsus length (from the intertarsal joint to the middle of the sole of the foot), 2) wing chord length (unflattened), 3) tail length, 4) culmen length, 5) culmen width, and 6) culmen depth, from 225 adult individuals in museum collections (Appendix 2). All measurements were taken to the nearest 0.1 mm following the methods described by Sandoval & Mennill (2013). The sample included 89 C. cristatus (38 females and 51 males), 92 C. leucopogon (35 females and 57 males), 8 C. nigrogularis (3 females and 5 males), and 36 C. virginianus (14 females and 22 males).
We conducted two separate backward stepwise DFA, one for each sex, to determine which morphological measurements differed among the four bobwhite species. As in previous DFAs, we selected the minimum number of morphological measurements that best separated between the four species for each sex. Additionally, we performed ANOVA as post-hoc tests to compare variation in the morphological measurements selected in each DFA among the species per sex.
Results
We analyzed 271 songs from the four bobwhite species, with a mean (± SE) of 4.37 ± 1.01 songs per recording. All species’ songs included two distinct elements (Fig. 1). Noticeable differences were observed in the songs between the four species. The best discriminant function analysis (DFA) model, which is based on the characteristics of the whole song, correctly classified 69 % of songs into their respective species. This model included maximum amplitude frequency, duration, and the number of elements (Wilk’s λ = 0.09, F9,125 = 25.85, P < 0.001, Fig. 2). Maximum amplitude frequency (F3,58 = 13.45, P < 0.001) was significantly lower in C. leucopogon and significantly higher in C. cristatus, compared to the other two species, for which maximum amplitude frequency was similar (Fig. 3). Song duration (F3,58 = 5.18, P = 0.003) was significantly shorter in the C. leucopogon than in the other three species (Fig. 3). The number of elements per song (F3,58 = 13.03, P < 0.001) was significantly higher in both C. leucopogon and C. cristatus compared to the other two species (Fig. 3).
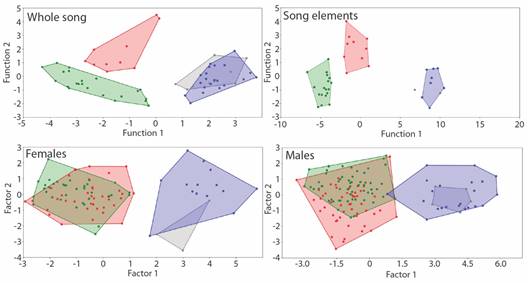
Fig. 2 Plot of the first two discriminant functions for measurements of male solo song and each song element, and female and male morphometric measurements between the four species of Colinus bobwhites (red: C. cristatus, green: C. leucopogon, blue: C. virginianus, and grey: C. nigrogularis) based on the best model for each comparison.
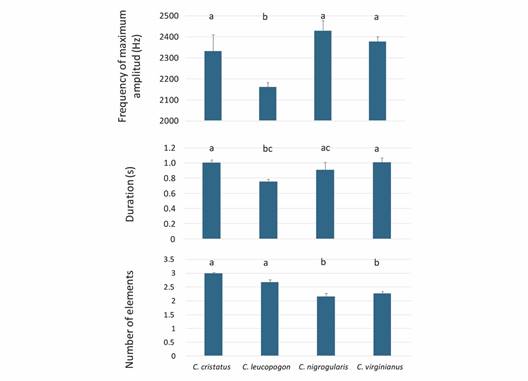
Fig. 3 Solo song characteristics (mean + SE) selected on the best model of discriminant function analysis for comparison of the four Colinus species. Bars connected by different letters are significantly different in pairwise comparisons.
The best DFA model based on measurements of individual song elements correctly classified 92 % of songs to the corresponding species. This model included the maximum amplitude frequency of the first and third elements, minimum frequency, duration of the first element, and time between elements (Wilk’s λ = 0.007, F18,82 = 22.43, P < 0.001, Fig. 2). The maximum amplitude frequency of the first song element (F3,34 = 8.13, P < 0.001) was significantly higher in the C. cristatus (Fig. 4), while the maximum amplitude frequency of the third song element (F3,34 = 8.92, P < 0.001) was significantly lower in the C. leucopogon (Fig. 4). The duration of the first element (F3,34 = 6.98, P < 0.001) and the time between elements (time between elements 1 and 2: F3,34 = 118.81, P < 0.001; time between elements 2 and 1: F3,34 = 95.65, P < 0.001) were significantly longer in the C. virginianus and C. nigrogularis (Fig. 4). The minimum frequency of the third element (F3,34 = 2.41, P = 0.08) did not significantly differ between species (Fig. 4).
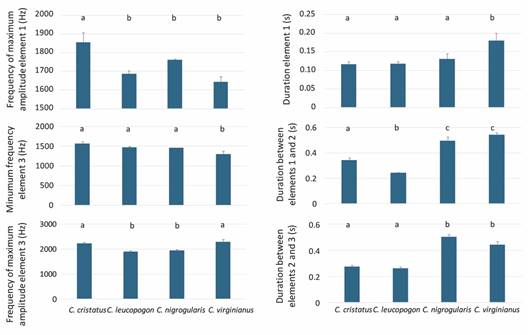
Fig. 4 Acoustic characteristics per element (mean + SE) based on the results on the best model of discriminant function analysis for comparison of the four Colinus species. Species connected by different letters are significantly different in pairwise comparisons.
Our analyses revealed that morphological measurements varied across the four species in both males and females. For females, the best DFA model correctly classified 67 % of individuals to their respective species and included tarsus length, wing chord length, and culmen length (Wilk’s λ = 0.20, F9,187 = 22.32, P < 0.001, Fig. 2). Tarsus length (F3,86 = 59.16, P < 0.001), wing chord length (F3,86 = 18.37, P < 0.001), and culmen length (F3,86 = 50.57, P < 0.001) were significantly greater in the C. virginianus and C. nigrogularis compared to the other two species (Table 1).
Table 1 Morphological measurements (mean ± SE) selected from the best model of discriminant function analysis for comparison of the four Colinus species separated by sex. Species with different letters next to the measurement values are significantly different in pairwise comparisons.
| C. cristatus | C. leucopogon | C. nigrogularis | C. virginianus | |
| Males | ||||
| Tarsus length | 24.04 ± 0.25 (a) | 23.15 ± 0.18 (b) | 29.16 ± 0.81 (c) | 29.55 ± 0.49 (c) |
| Wing chord | 100.11 ± 0.79 (a) | 99.57 ± 0.45 (a) | 100.2 ± 3.1 (ac) | 105.32 ± 1.25 (bc) |
| Tail length | 56.67 ± 0.8 (a) | 51.68 ± 0.63 (b) | 48 ± 1.55 (b) | 49.77 ± 1.21 (b) |
| Culmen length | 12.83 ± 0.09 (a) | 12.89 ± 0.1 (a) | 15.05 ± 0.23 (b) | 15.28 ± 0.17 (b) |
| Culmen depth | 10.45 ± 1.61 | 8.4 ± 0.06 | 8.24 ± 0.27 | 8.23 ± 0.07 |
| Females | ||||
| Tarsus length | 23.27 ± 0.28 (a) | 22.5 ± 0.27 (a) | 28.06 ± 0.7 (b) | 29.2 ± 0.56 (b) |
| Wing chord | 97.11 ± 0.77 (a) | 97.23 ± 0.58 (a) | 95 ± 4.58 (a) | 107.14 ± 1.71 (b) |
| Culmen length | 12.59 ± 0.11 (a) | 12.33 ± 0.14 (a) | 14.4 ± 0.45 (b) | 15.07 ± 0.2 (b) |
For males, the best DFA model correctly classified 66 % of individuals to the corresponding species and included tarsus length, wing chord length, tail length, culmen length, and culmen depth (Wilk’s λ = 0.15, F15,333 = 22.96, P < 0.001, Fig. 2). Tarsus length (F3,131 = 86.25, P < 0.001), wing chord length (F3,131 = 7.74, P < 0.001), and culmen length (F3,131 = 82.91, P < 0.001) were significantly greater in the C. virginianus and C. nigrogularis (Table 1). Tail length (F3,131 = 13.58, P < 0.001) was significantly longer in the C. cristatus (Table 1). Culmen depth (F3,131 = 0.93, P = 0.43) was similar across all species (Table 1).
Discusion
We found that the differences in song characteristics between C. leucopogon and C. cristatus were greater, and showed no overlap in our analysis, compared to the differences and the overlap observed between C. virginianus and C. nigrogularis, two species that have long been recognized as distinct (AOU, 1998; Madge & McGowan, 2002). Since male solo songs in bobwhites play an important role in sexual selection, including female attraction and male-male interactions (Sandoval, 2008, Sandoval, 2011b; Sandoval & Barrantes, 2012), our findings suggest that the significant song divergence between C. leucopogon and C. cristatus, historically grouped as a single species on several occasions (AOU, 1983; AOU, 1998; Garrigues & Dean, 2007; Hellmayr & Conover, 1942), may serve as a distinguishing trait between both specie. These differences in song are particularly important for taxonomic considerations because male song in bobwhites is genetically determined (Catchpole & Slater, 2008; Konishi, 1963; Kroodsma, 2004). In contrast, C. virginianus and C. nigrogularis exhibited much greater similarity in their male song characteristics. The song differences between C. leucopogon and C. cristatus and similarity between C. virginianus and C. nigrogularis may be a consequence of the vegetation structure where each species occur. For example, C. virginianus and C. nigrogularis inhabit pine forest and dense scrubs and grass-brushes (Madge & McGowan, 2002), which have obstacle of larger size for song transmission, and consequently favoring shorter songs. Meanwhile, C. leucopogon inhabit dry forest grassland that have tall, thin grasses (Stiles & Skurch, 1989); vegetation that will favor longer songs. But, C. cristatus that inhabit grassland of humid forest, which are denser in vegetation (Madge & McGowan, 2002), will favor the longer song of all four species to transmit.
Morphological variation was associated with the geographic distribution of the species rather than differences between individual species. Specifically, we found that C. virginianus and C. nigrogularis were overall larger than C. leucopogon and C. cristatus. Consequently, the most pronounced morphological differences were observed between the two species with the northernmost distributions. This lack of morphological differences between geographically closer pairs of species may be attributed to their use of similar habitats (Madge & McGowan, 2002; Mayr, 1976; Ricklefs, 2012). Both C. leucopogon and C. cristatus inhabit tropical grasslands with isolated trees and small forest patches (Madge & McGowan, 2002; Stiles & Skutch, 1989), while C. virginianus and C. nigrogularis occupy dry and temperate grasslands with small bushes (Madge & McGowan, 2002). Conversely, body size in closely related species often varies according to latitude or altitude, following Bergmann’s rule, where species at higher latitudes or altitudes tend to have larger body sizes (Gutiérrez-Pinto et al., 2014; Meiri, 2011; Sandoval et al., 2014; Sandoval et al., 2017). Our finding that the two species with northern distributions had larger body sizes is consistent with this expectation and it is a pattern common among other groups of closely related species of birds, such as Melozone (Sandoval et al., 2014, Sandoval et al., 2017), Pogoniulus (Sebastianelli et al., 2022), and Tyto (Romano et al., 2021).
In conclusion, our study found that C. leucopogon and C. cristatus are fully distinguishable based on male solo song, a trait that is important in sexual selection (Sandoval, 2008, Sandoval, 2011a, Sandoval, 2011b; Sandoval & Barrantes, 2012). The lack of significant morphological differences between these species may be due to ecological constraints, such as those outlined by Bergmann’s rule, given their similar habitats and altitudinal distributions (Gutiérrez-Pinto et al., 2014; Meiri, 2011; Sandoval et al., 2014, Sandoval et al., 2017).
Ethical statement: the authors declare that they all agree with this publication and made significant contributions; that there is no conflict of interest of any kind; and that we followed all pertinent ethical and legal procedures and requirements. All financial sources are fully and clearly stated in the acknowledgments section. A signed document has been filed in the journal archives.
See supplementary material

