




 Inglês (pdf)
 Artigo em XML
 Referências do artigo

 Tradução automática
 Enviar este artigo por email
 Citado por SciELO
 Similares em
SciELO
 uBio

 Permalink


Introduction
In upwelling areas, the warm surface water is pushed offshore by winds and replaced by cool deeper water with higher nutrient levels (Witman, 2007). Marine benthic communities respond to these water column fluctuations (Alongi, 1989a). This coupling between water column processes and the benthos has been documented by Alongi (1990), Graf (1992), Posey et al. (1995), and Witman (2007). In this context, input of organic matter from plankton can result in an increase of benthic biomass, or it could sustain the macrobenthos in posterior oligotrophic environments (Cosentino & Giacobbe, 2008; Escobar-Briones & Soto, 1997).
The upwelling process results in positive and negative effects on the marine fauna. For example, in Peru and Africa the upwelling has a positive influence on the biomass of benthic fauna (Alongi, 1990). Conversely, Alongi (1989b) points out that intense or constant upwelling on these shelves, and on the California coast, can have deleterious effects by exposing the benthos to anoxia. Additionally, the larval recruitment of benthic taxa can be reduced with an increase in the intensity (temporal permanence) of the upwelling (Menge et al., 1997, Menge et al., 2003), by exporting larval stages offshore.
The intensity or temporal permanence of the upwelling causes variations in taxa composition, as observed in rocky shore communities of both temperate and tropical localities (Cortés et al., 2014; Menge et al., 1997; Menge et al., 2003; Sibaja-Cordero & Cortés, 2008). Connolly & Roughgarden, (1999); Menge et al., (1997) and Phillips, (2005) have documented that areas with less intense upwelling, such as Oregon and the north of California, exhibit increased density, biomass, and growth of filter feeders compared to areas with stronger upwelling, like the south of California. These increases are attributed to the more stable and favorable conditions for filter feeders and their recruits in these less intense upwelling zones. Another example is the Galapagos Islands where both the number and the cover of rocky subtidal species (mainly suspension feeders) increased twofold when the upwelling events (causing the water temperature to drop by 3 to 9 ºC in less than a day) became more frequent and predictable from June to February (Witman & Smith, 2003). Sibaja-Cordero & Cortés (2008) report a change in the composition of rocky shore assemblages with more macroalgae cover during the season of upwelling in contrast with a less diverse assemblage dominated by barnacles in the non-upwelling season in Bahía Salinas, Costa Rica. In the case of soft-bottom systems, Quintana et al. (2015) noted that lower abundance values during non-upwelling periods compared to upwelling seasons in southeast Brazil can be the result of the decreased organic matter quality (detritus from phytoflagellate or diatom blooms) on the bottom.
A seasonal upwelling system has a temporal displacement offshore of the coastal surface seawater by the strong influence of wind. As the wind relaxes, the coastal system changes toward its initial condition. Seasonal upwellings in the neotropics occur in the Gulf of Tehuantepec (Mexico), Bay of Panama (Panama), and the Pacific coast of south of Nicaragua to Gulf of Papagayo, Costa Rica. During the dry season (December to April) the Trade Winds blow across Mesoamerica, from the Caribbean to the Pacific, producing strong Northeasterly winds, and resulting in a coastal upwelling of cooler nutrient-rich waters with lowest dissolved oxygen content (Alfaro & Cortés, 2012; Chelton, 2000a, Chelton, 2000b; Legeckis, 1988; McCreary et al., 1989).
During the upwelling season, the water temperature in the Gulf of Papagayo dropped by 7 °C to 9° C, while the nutrient concentrations rose by 3 to 15-fold. This stimulated phytoplankton growth, resulted in a 3 to 6-fold increase in chlorophyll concentration (Stuhldreier et al., 2015). This primary production and nutrient availability in the water column during upwelling possibly promote the development of diverse and abundant macrobenthic populations in the sediments of these areas (Alongi, 1990; Lee 1978; Menge et al., 2003). The small bay of Bahía Salinas (North Pacific of Costa Rica) is located in an area where the Trade Winds blow can blow with more intensity, because this zone has a low altitude of mainland, and a marked east-west axis which allows the winds to pass through without much obstruction (Alfaro & Cortés, 2021).
This study examines how the benthic taxa and feeding guilds vary in number, abundance, and composition between upwelling and non-upwelling seasons in Bahía Salinas. It also describes the oceanological and environmental conditions during the study period and the spatial variability of the benthic macrofauna within the bay.
Materials and methods
The oceanological and environmental conditions were measured to describe the periods of upwelling vs no upwelling in the specific locality of Bahía Salinas, North Pacific of Costa Rica during December 2007 to April 2009 (Fig. 1). Data on chlorophyll (µg/L) concentration, sea surface temperature (ºC), and wind velocity (m/s) to characterize the bay were obtained from the satellite data MODIS, AVHRR P5.1, QuickCAT, respectively available in NOAA Ocean Watch Voyager (http://www.pacioos.hawaii.edu/voyager/oceanwatch.html). The data are monthly averages derived from a box between 85° 38’ 32.64” W to 86° 15’ 0.36” W and 10° 56’ 56.76” N to 11° 9’ 2.16” N (Fig. 1). Additionally, seawater temperature at the bottom was recorded in situ with Hobo®Temp sensors, every 30 min at 3-6 m and 6.5-9 m depth, within the bay and outside the bay, stations H1-H2 and H3-H4, respectively, during the study period (Fig. 1). The mean ± standard deviation, minimum, and maximum values of these variables recorded were presented as indicators of upwelling.
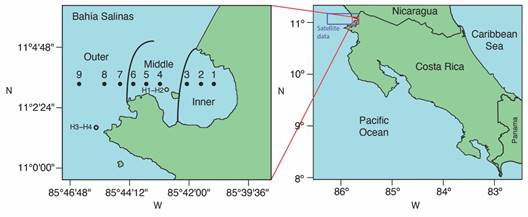
Fig. 1 Stations for benthic grab samples during December 2007 (stations 1-9), August 2008 (stations 1, 3, 4, 6 and 8), December 2008 and April 2009 (stations 1, 3, 4, 6, 8 and 9). Sites for Hobo®Temp sensors, labeled H1-H2 in the bay and H3-H4 outside the bay. The satellite data of wind, seawater temperature and chlorophyll concentration comes from the box on the figure on the right.
Four sampling visits (December 2007, August 2008, December 2008 and April 2009) were carried out to study the subtidal benthic community of Bahía Salinas. The bottom of the bay (Fig. 1) was divided into three zones: the inner bay (3 to 18 m depth at chart datum), middle bay (18 to 35 m depth) and outside bay (35 to 40 m depth).
A Petite Ponar grab (sampling area: 15.2 x 15.2 cm) was used to sample the sediment and biotic assemblages from an 11 km transect from the inner to outside bay (Fig. 1). In December 2007 (start of the upwelling season), nine grabs were collected, three in each zone of the bay (Fig. 1). In August 2008 (non-upwelling season), five grabs were taken, two in the inner bay, two in the middle bay, and one in the outside bay. In both December 2008 (start of the upwelling season) and April 2009 (end of the upwelling season), six grabs were collected, two in each zone of the bay (Fig. 1). The number of sampled stations vary between dates by the presence of adverse weather or severe oceanographic conditions. All sediment samples were preserved with formalin diluted to 5 % in seawater and stained with Rose Bengal. The samples were sieved through a 500 μm mesh, gently cleaned with fresh water as per Vargas (1987). The organisms were separated and identified to the lowest possible taxonomic category. Polychaetes were identified following Dean (1998), Dean (2001a), Dean (2001b) and de León-González et al. (2009), the mollusks following Keen (1971), and the crustaceans following Fischer et al. (1995), Hendrickx (1997), Hendrickx (1999), Rathbun (1918), Wicksten (1983), and Williams (1986). The identification for other groups was done with Carlton (2007).
Total taxa and total abundance per sampling date and zone of the bay were analyzed using a chi-squared test with expected values corrected by sampling effort (number of grab samples) following Krebs (1999). Additionally, mean diversity (H) using the Shannon-Wiener function with Ln, and mean equitability (J) were compared between dates of the bay with a Friedman test (F). With a Kendall’s coefficient (Wt) was determined the degree of concordance in the values of biodiversity measures across zones of the bay (0 = no concordance to 1 = total concordance) (Krebs, 1999; Siegel, 1956). This statics were carried out in R. A non-metric Multidimensional Scaling (nMDS) based in the Euclidean distance of the abundances (transformed by Ln x+1) was used to visualize the dissimilarity between samples according with the zones of the bay and sampling dates (Hammer et al., 2001). Euclidean distance of transformed data represented a gradient in a better way than a Bray-Curtis of the abundance data (Legendre & Gallagher, 2001). This analysis was conducted using the vegan package in R (Oksanen et al., 2019). In the PAST software, a two-way ANOSIM test was carried out to determine the degree of discrimination (R value as in Clarke, l993) between sampling date and zone of the bay, and a SIMPER analysis was applied to the data (Ln x+1) that provides the percentage contribution of each taxa to the between-group dissimilarity by sampling dates and zones (Clarke & Warwick, 1994; Hammer et al., 2001).
Additional, each taxon was catalogued by feeding guild using the information of (Fauchald & Jumars, 1979), Jumars et al. (2015), and MacDonald et al. (2010), assuming that the taxa found feed in a similar manner to species within the same major group: suspension feeder (active, passive, and mixed), deposit feeder (surface and subsurface), mobile predators, scavengers, omnivores, and herbivores to describe the functional composition of the faunal assemblages. Finally, ANOSIM and SIMPER tests were conducted using the feeding guilds data (Ln x+1) with Euclidean distance. The density of individuals per m2 was calculated from the means through a back transformation from the estimates of the SIMPER output.
Results
Oceanological and environmental conditions: Wind speeds reached above 4 m/s from November to the end of March, and presented the minimum speeds from April to July (Fig. 2A). Sea surface temperature (SST) from satellite data was lowest during the upwelling season (with minimum values of 24-25 ºC), than during the non-upwelling season (with minimum values above 28 ºC) (Fig. 2B). Mean and minimum seawater temperature from the in-situ sensor had lower values during upwelling season (April: 19-21 ºC and 15-17 ºC), and reached a higher mean during non-upwelling season (August: 28-28.5 ºC and 25-26.2 ºC) at the two depths and the two sites recorded (Table 1). Water temperature was 3 to 4 ºC cooler at 6.5-9 m than 3-6 m in both seasons (Table 1). Increased chlorophyll concentration was concordant with the increase in wind velocity and decrease of SST (Fig. 2C).
Table 1 Sea water temperature in the bottom by depth and date, measured at two sites in the region of Bahía Salinas, Costa Rica.
| Depth (m) | Mouth of the bay | Out of the bay | ||||||||
| H1 | Dec 2007 | Aug 2008 | Dec 2008 | Apr 2009 | H3 | Dec 2007 | Aug 2008 | Dec 2008 | Apr 2009 | |
| 3-6 | Mean | 23.4 | 28.4 | 26.6 | 19.7 | Mean | 23.8 | 28.3 | 24.4 | 21.2 |
| Desv | 1.3 | 0.9 | 0.4 | 0.8 | Desv | 1.2 | 0.8 | 1.0 | 3.2 | |
| Max | 26.6 | 29.8 | 27.3 | 22.3 | Max | 26.8 | 29.4 | 27.4 | 29.0 | |
| Min | 20.0 | 25.4 | 25.4 | 17.0 | Min | 21.3 | 25.0 | 22.4 | 16.2 | |
| Depth (m) | H2 | Dec 2007 | Aug 2008 | Dec 2008 | Apr 2009 | H4 | Dec 2007 | Aug 2008 | Dec 2008 | Apr 2009 |
| 6.5-9 | Mean | 22.98 | 28.28 | 24.07 | 20.41 | Mean | 23.6 | 28.5 | 24.0 | 20.8 |
| Desv | 0.38 | 0.96 | 1.01 | 3.05 | Desv | 1.2 | 0.7 | 0.7 | 3.1 | |
| Max | 23.64 | 29.71 | 27.13 | 28.82 | Max | 26.7 | 30.0 | 26.3 | 28.7 | |
| Min | 21.74 | 25.16 | 21.82 | 15.77 | Min | 20.9 | 26.2 | 22.1 | 15.4 | |
The highest temperatures are in bold font. The minimum temperatures are underlined. H1 to H4 are the Hobo®Temp sensors.
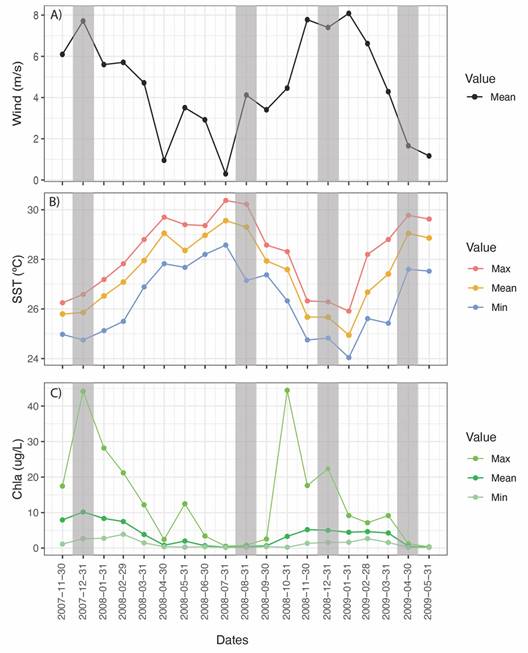
Fig. 2 A. Wind velocity, B. superficial seawater temperature, and C. Chlorophyll concentration from satellite data offshore of Bahía Salinas, Costa Rica. Data from NOAA Ocean Watch Voyager. The gray areas represent the benthic sampling events.
Fauna diversity and assemblages composition: A total of 1 969 individuals from 157 taxa were collected (Table 2). The nine grabs from December 2007 contained 683 individuals from 75 taxa; 136 individuals from 40 taxa were found in August 2008 (five grabs); 252 individuals from 76 taxa in December 2008 (six grabs); and 898 individuals from 101 taxa in April 2009 (six grabs). Polychaetes showed the highest percentage of total abundance and taxa, followed by crustaceans and mollusks (Table 3). Other relatively abundant taxa were sipunculids, nemerteans, nematodes, and echinoderms; remaining taxa corresponded to a flatworm (Platyhelminthes), a brachiopod, a cephalochordate, and a demersal fish (Table 2, Table 3).
Table 2 Taxa found during the benthic grab samples by dates in Bahía Salinas, Costa Rica.
| Taxonomic group | Taxa | Feeding guilds | SU | NU | SU | U | Total | |
| Dec. 2007 | Aug. 2008 | Dec. 2008 | Apr. 2009 | |||||
| Polychaeta | Acrocirridae | Acrocirridae indet. | Ds | 1 | 1 | 2 | ||
| Ampharetidae | Amphicteis sp. | Ds | 7 | 2 | 1 | 9 | 19 | |
| Melinna sp. | Ds | 3 | 15 | 18 | ||||
| Capitellidae | Capitella sp. | Dss | 2 | 2 | ||||
| Capitellidae indet. | Dss | 1 | 1 | |||||
| Dasybranchus lumbricoides | Dss | 1 | 1 | |||||
| Decamastus nudus | Dss | 1 | 5 | 6 | ||||
| Heteromastus filiformis | Dss | 1 | 1 | |||||
| Mediomastus ambiseta | Dss | 2 | 1 | 3 | 6 | |||
| Mediomastus californiensis | Dss | 4 | 4 | |||||
| Nootmastus tenuis | Dss | 2 | 2 | |||||
| Notomastus lineatus | Dss | 1 | 1 | 2 | ||||
| Peresiella sp. | Dss | 1 | 1 | |||||
| Chaetopteridae | Mesochaetopterus sp. | Sfa | 1 | 1 | ||||
| Cirratulidae | Cirratulidae indet. | Ds | 28 | 2 | 16 | 198 | 244 | |
| Cossuridae | Cossura brunnea | Dss | 1 | 1 | 3 | 5 | ||
| Dorvilleidae | Dorvillea sp. | Pm-Sca | 1 | 1 | 5 | 7 | ||
| Eulepethidae | Grubeulepis ecuadorensis | Pm | 1 | 1 | ||||
| Glyceridae | Glycera sp. | Pm | 3 | 5 | 4 | 12 | ||
| Goniadidae | Glycinde armigera | Pm | 2 | 1 | 1 | 4 | ||
| Goniada sp. A | Pm | 3 | 18 | 21 | ||||
| Goniada sp. B | Pm | 4 | 4 | |||||
| Goniadidae indet. | Pm | 3 | 1 | 4 | ||||
| Hesionidae | Gyptis sp. | Pm | 1 | 3 | 8 | 12 | ||
| Hesione panamena | Pm | 2 | 2 | |||||
| Hesionides arenarius | Pm | 1 | 1 | |||||
| Lumbrineridae | Lumbrineridae indet. A | Pm | 2 | 2 | 4 | |||
| Lumbrineridae indet. B | Pm | 13 | 4 | 3 | 24 | 44 | ||
| Magelonidae | Magelona californica | D-Pm | 4 | 1 | 2 | 7 | ||
| Magelona pacifica | D-Pm | 9 | 10 | 11 | 30 | |||
| Maldanidae | Heteroclyne cf. glabra | Dm | 1 | 1 | ||||
| Maldanidae indet. | Dm | 1 | 1 | |||||
| Maldanidae Indet. A | Dm | 1 | 1 | |||||
| Nepthyidae | Aglaophamus sp. | Pm | 2 | 2 | ||||
| Aglaophamus verrilli | Pm | 4 | 12 | 10 | 4 | 30 | ||
| Nepthys panamanensis | Pm | 26 | 4 | 7 | 12 | 49 | ||
| Nereididae | Ceratonereis singularis (Juvenile) | Om | 1 | 1 | ||||
| Gymnonereis crosslandi | Om | 3 | 1 | 1 | 5 | |||
| Neanthes microma | Om | 1 | 1 | |||||
| Nereis sp. (Juvenile) | Om | 2 | 2 | |||||
| Nereididae (Juvenile) | Om | 2 | 2 | |||||
| Nereid larvae | Om | 1 | 1 | 2 | ||||
| Onuphidae | Diopatra tridentata | Om | 3 | 1 | 1 | 13 | 18 | |
| Kinbergonuphis microcephala | Om | 7 | 3 | 4 | 17 | 31 | ||
| Ophelidae | Armandia brevis | Dss | 8 | 1 | 1 | 25 | 35 | |
| Orbiniidae | Scoloplos armiger | Dss | 1 | 1 | 1 | 3 | ||
| Scoloplos sp. | Dss | 3 | 2 | 5 | ||||
| Owenidae | Owenia fusiformis | SFp-Ds | 1 | 1 | ||||
| Paraonidae | Acesta (Acmira) lopezi | Dm | 1 | 1 | 2 | 4 | ||
| Aricidea (Acmira) catherinae | Dm | 25 | 4 | 15 | 42 | 86 | ||
| Aricidea (Aedicira) sp. A | Dm | 3 | 2 | 5 | 10 | |||
| Aricidea (Aedicira) sp. B | Dm | 2 | 2 | 4 | ||||
| Levensenia gracilis | Dm | 1 | 1 | |||||
| Phyllodocidae | Eumida longicornuta | Pm-Sca | 1 | 1 | ||||
| Phyllodoce madeirensis | Pm-Sca | 2 | 7 | 9 | ||||
| Phyllodoce sp. | Pm-Sca | 1 | 1 | 11 | 13 | |||
| Phyllodocidae indet. A | Pm-Sca | 1 | 1 | |||||
| Phyllodocidae indet. B | Pm-Sca | 1 | 1 | |||||
| Pilargidae | Loandalia riojai | Pm | 1 | 2 | 4 | 7 | ||
| Parandalia tricuspis | Pm | 3 | 4 | 7 | ||||
| Sigambra sp. | Pm | 1 | 1 | |||||
| Sigambra tentaculata | Pm | 22 | 22 | |||||
| Polynoidae | Polynoidae indet. | Pm | 3 | 1 | 4 | |||
| Sabellariidae | Idanthyrsus sp. | SFp-Ds | 1 | 1 | ||||
| Sabellidae | Sabellidae indet. | SFp | 28 | 4 | 6 | 103 | 141 | |
| Sigalionidae | Sthenelais fusca | Pm | 2 | 2 | 2 | 6 | ||
| Spionidae | Apoprionospio pygmaea | SFp-Ds | 10 | 1 | 2 | 13 | ||
| Dipolydora socialis | SFp-Ds | 1 | 1 | |||||
| Paraprionospio pinnata | SFp-Ds | 167 | 1 | 17 | 25 | 210 | ||
| Prionospio (Minuspio) multibranchiata | Ds | 28 | 15 | 18 | 61 | |||
| Prionospio (Prionospio) ehlersi | Ds | 1 | 1 | |||||
| Prionospio delta | Ds | 5 | 5 | |||||
| Prionospio sp. A | Ds | 3 | 3 | |||||
| Scolelepis (Scolelepis) squamata | SFp | 1 | 26 | 27 | ||||
| Spiophanes duplex | SFp-Ds | 19 | 1 | 4 | 3 | 27 | ||
| Spiophanes sp. A | SFp-Ds | 1 | 1 | 2 | ||||
| Syllidae | Brania sp. | Om | 1 | 1 | ||||
| Exogone breviantenata | Om | 2 | 1 | 3 | ||||
| Exogone dispar | Om | 2 | 1 | 3 | 6 | |||
| Terebellidae | Terebellidae indet. | Ds | 2 | 1 | 3 | |||
| Trichobranchidae | Terebellides reishi | Dss | 2 | 1 | 2 | 3 | 8 | |
| Oligochaeta | Oligochaeta indet. | Dss | 5 | 5 | ||||
| Sipuncula | Aspidosiphonidae | Aspidosiphon sp. | Dm | 1 | 1 | 2 | 4 | |
| Aspidosiphon sp. A | Dm | 1 | 1 | 2 | ||||
| Phascolosomatidae | Apionsoma sp. | Dm | 5 | 28 | 14 | 20 | 67 | |
| Mollusca / Class Gastropoda | Bullidae | Bullidae indet. | H | 3 | 3 | |||
| Caecidae | Caecidae indet. | Pm | 1 | 1 | ||||
| Naticidae | Natica sp. | Pm | 1 | 1 | 2 | |||
| Sinum noyesii | Pm | 2 | 2 | |||||
| Naticidae (Juvenile) | Om | 1 | 1 | |||||
| Bivalvia indet. | SFa | 1 | 2 | 3 | ||||
| Mollusca / Class Bivalvia | Corbulidae | Corbullidae indet. | SFa | 2 | 2 | |||
| Donacidae | Donacidae indet. | SFa | 1 | 2 | 3 | |||
| Mytilidae | Mytilidae indet. (Juvenile) | SFa | 1 | 1 | ||||
| Nuculidae | Nucula (Saccella) elenensis | SFa | 1 | 1 | ||||
| Veneridae | Pitar helenae | SFa | 1 | 1 | ||||
| Veneridae indet. (Juvenile) | SFa | 1 | 12 | 13 | ||||
| Tellinidae | Tellina (Eurytellina) eburnea eburnea | SFa | 3 | 1 | 4 | |||
| Tellinidae indet. (Juvenile) | SFa | 4 | 1 | 30 | 35 | |||
| Crustacea / Class Malacostraca / O. Decapoda /I.O. Brachyura | Raninidae | Raninoides benedicti | Om | 4 | 2 | 1 | 7 | |
| Pseudorhombilidae | Malacoplax californiensis | Pm | 1 | 6 | 3 | 10 | ||
| Parthenopidae | Mesorhoea bellii | Om | 1 | 1 | ||||
| Pinnotheridae | Pinnotheridae indet. | Om | 1 | 1 | ||||
| Parthenopidae | Upogebia jonesi | Om | 1 | 1 | ||||
| Thalassinidea | Thalassinidea indet. | Om | 3 | 3 | ||||
| Crustacea / Class Malacostraca / O. Decapoda / I.O. Caridea | Caridea indet. A | Om | 1 | 1 | ||||
| Caridea indet. B | Om | 1 | 1 | |||||
| Caridea indet. C | Om | 1 | 1 | |||||
| Caridea indet. D | Om | 1 | 1 | |||||
| Processidae | Processa peruviana | Om | 2 | 2 | ||||
| Pasiphaeidae | Leptochela gracilis | Om | 1 | 1 | ||||
| Penaeidae | Penaeidae indet. | Om | 3 | 3 | ||||
| Alpheidae | Alpheus sp. | Pm | 2 | 1 | 1 | 4 | ||
| Automate dolichognatha | Pm | 1 | 1 | |||||
| Zoea larvae | Om | 1 | 1 | |||||
| Crustacea / Class Malacostraca / O. Amphipoda | Amphipoda indet. A | Om | 174 | 36 | 15 | 23 | 248 | |
| Amphipoda indet. B | Om | 1 | 2 | 3 | ||||
| Amphipoda indet. C | Om | 1 | 2 | 7 | 10 | |||
| Amphipoda indet. D | Om | 1 | 1 | 2 | ||||
| Amphipoda indet. E | Om | 1 | 6 | 7 | ||||
| Amphipoda indet. F | Om | 1 | 10 | 11 | ||||
| Amphipoda indet. G | Om | 1 | 2 | 3 | ||||
| Amphipoda indet. H | Om | 1 | 2 | 3 | ||||
| Amphipoda indet. I | Om | 1 | 1 | |||||
| Amphipoda indet. J | Om | 10 | 10 | |||||
| Amphipoda indet. K | Om | 1 | 1 | |||||
| Amphipoda indet. L | Om | 1 | 1 | |||||
| Amphipoda indet. M | Om | 11 | 11 | |||||
| Caprellidae indet. | H | 1 | 7 | 8 | ||||
| Crustacea / Class Malacostraca / O. Cumacea | Cumacea indet. A | Om | 1 | 1 | 2 | 4 | ||
| Cumacea indet. B | Om | 1 | 1 | |||||
| Cumacea indet. C | Om | 1 | 1 | |||||
| Cumacea indet. D | Om | 2 | 2 | 4 | ||||
| Crustacea / Class Malacostraca / O. Isopoda | Gnathiidae | Gnathia sp. | Pm | 1 | 1 | |||
| Isopoda indet. A | Om | 1 | 1 | |||||
| Isopoda indet. B | Om | 1 | 1 | |||||
| Isopoda indet. C | Om | 3 | 3 | |||||
| Isopoda indet. D | Om | 2 | 2 | |||||
| Crustacea / Class Malacostraca / O. Leptostraca | Nebaliidae | Nebalia sp. | Pm | 1 | 1 | 2 | ||
| Crustacea / Class Copepoda / O. Harpacticoida | Harpacticoida indet. A | Om | 8 | 1 | 9 | |||
| Harpacticoida indet. B | Om | 5 | 2 | 7 | ||||
| Harpacticoida indet. C | Om | 1 | 1 | |||||
| Crustacea / Class Ostracoda | Ostracoda indet. A | Om | 2 | 2 | ||||
| Ostracoda indet. B | Om | 1 | 1 | |||||
| Ostracoda indet. C | Om | 1 | 1 | |||||
| Ostracoda indet. D | Om | 6 | 6 | |||||
| Ostracoda indet. E | Om | 1 | 1 | |||||
| Ostracoda indet. F | Om | 1 | 1 | |||||
| Nemertea | Nemertea indet. | Pm | 6 | 1 | 6 | 19 | 32 | |
| Platyhelminthes / Class Rabditophora / O. Tricladida | Tricladida indet. | Pm | 1 | 1 | ||||
| Brachiopoda / Class Inarticulata | Lingulidae | Glottidia albida | Sfa | 1 | 2 | 3 | ||
| Nematoda | Nematoda indet. | Om | 13 | 13 | ||||
| Echinodermata / Class Asteroidea | Asteroidea indet. | Pm | 3 | 1 | 4 | |||
| Echinodermata / Class Holothuroidea | Holuthuroidea indet. | Dss | 1 | 1 | ||||
| Echinodermata / Class Ophiuroidea | Ophiuroidea | Ophiuroidea indet. | Sfa | 1 | 6 | 7 | ||
| Chordata / Subphyllum Cephalochordata / Class Leptocardii | Branchiostomatidae | Branchiostoma californiense | SFa | 2 | 2 | |||
| Chordata / Subphylum Vertebrata / Class Teleostei | Ophichthidae | Ophichthidae indet. | Pm | 1 | 1 |
SU: Start upwelling season, NU: non-upwelling season, and U: upwelling season. Feeding guilds, D: Deposit feeder, s: surface, ss: subsurface, m: mixed; SF: Suspension feeder, a: active, p: passive; Pm: Predator mobile; Sca: Scavenger; Om: Omnivore, H: Herbivore.
Table 3 Percentage of taxa and total abundance of each faunal group by dates. Bahía Salinas, Costa Rica.
| Taxa | % | |||
| Dec-07 | Aug-08 | Dec-08 | Apr-09 | |
| Annelida | 69 | 65 | 53 | 64 |
| Crustacea | 19 | 15 | 39 | 23 |
| Mollusca | 8 | 10 | 4 | 8 |
| Others | 4 | 10 | 4 | 5 |
| Abundance | Dec-07 | Aug-08 | Dec-08 | Apr-09 |
| Annelida | 67 | 60 | 67 | 80 |
| Crustacea | 29 | 34 | 27 | 11 |
| Mollusca | 2 | 4 | 1 | 6 |
| Others | 3 | 3 | 4 | 3 |
The total number of taxa and individuals was lower during the non-upwelling season, at the start of the upwelling season, these values increased. By the end of the upwelling season, both values were even higher (taxa: χ2 = 29.24, d.f. = 3, P < 0.001; individuals: χ2 = 678.75, d.f. = 3, P < 0.001, Table 4).
Differences in the number of taxa between zones of the bay varied across sampling dates (χ2 = 17.09, d.f. = 6, P = 0.009) (Table 4). Post-hoc comparisons revealed that a similarly low number of taxa were found between the zones in August 2008 (non-upwelling season) (χ2 = 0.52, d.f. = 2, P = 0.771). In December 2007 (the start of the upwelling season), a lower taxa number were found at mid bay (χ2 = 9.72, d.f. = 2, P = 0.008). However, in December 2008, there was a peak in the number of taxa in the mid bay (χ2=9.14, d.f.=2, P = 0.010). The number of taxa was higher and similar across the bay in April 2009 (upwelling season) (χ2 = 2.87, d.f. = 2, P = 0.238) (Table 4).
Table 4 Biodiversity parameters by date and zone of the bay of the benthic macrofauna of Bahía Salinas, Costa Rica.
| Species | |||||
| Zone | December 2007 | August 2008 | December 2008 | April 2009 | Total number of species |
| Inner bay | 36 | 16 | 29 | 49 | 88 |
| Middle bay | 26 | 19 | 52 | 67 | 103 |
| Outer bay | 53 | 15 | 30 | 56 | 96 |
| Total number of species | 75 | 40 | 76 | 101 | 157 |
| Abundance | |||||
| Zone | December 2007 | August 2008 | December 2008 | April 2009 | Total abundance |
| Inner bay | 137 | 26 | 52 | 166 | 381 |
| Middle bay | 122 | 66 | 125 | 348 | 661 |
| Outer bay | 424 | 44 | 75 | 384 | 927 |
| Total abundance | 683 | 136 | 252 | 898 | 1969 |
| Shannon-Wiener | |||||
| Zone | December 2007 | August 2008 | December 2008 | April 2009 | Mean Diversity |
| Inner bay | 2.04 | 1.75 | 2.19 | 2.92 | 2.20 |
| Middle bay | 2.03 | 1.88 | 3.16 | 3.01 | 2.46 |
| Outer bay | 2.08 | 1.77 | 2.53 | 2.77 | 2.33 |
| Mean Diversity | 2.05 | 1.81 | 2.63 | 2.90 | 2.33 |
| Equitability | |||||
| Zone | December 2007 | August 2008 | December 2008 | April 2009 | Mean equitability |
| Inner bay | 0.87 | 0.84 | 0.83 | 0.87 | 0.86 |
| Middle bay | 0.84 | 0.73 | 0.91 | 0.80 | 0.82 |
| Outer bay | 0.62 | 0.66 | 0.91 | 0.76 | 0.73 |
| Mean equitability | 0.78 | 0.76 | 0.89 | 0.81 | 0.81 |
The highest values are in bold font and the lowest values are underlined.
Similar to the number of taxa, the values of the total abundance (Table 4) varied in their distribution within the bay (factor zone) across the sampling dates (χ2 = 145.00, d.f. = 6, P < 0.001). Post-hoc comparisons revealed that the middle of the bay showed the lowest abundance in December 2007 (χ2 = 254.46, d.f. = 2, P < 0.001), while higher abundance was observed in the mid bay during August and December 2008 (P < 0.001, d.f. = 2, with χ2 = 17.71 and χ2 = 33.17, respectively). Finally, the abundance values were high at mid and outer bay areas during April 2009 (χ2 = 91.25, d.f. = 2, P < 0.001) (Table 4).
A temporal effect was found for the Shannon-Wiener diversity index (Friedman test, χ2 = 8.20, d.f. = 3, P = 0.042), with the highest value during upwelling season (April 2009) and the lowest value during non-upwelling season (Table 4). This pattern was concordant in high degree across the zones of the bay (Kendall’s concordance: Wt = 0.91). However, a non-temporal trend was found for the equitability (Friedman, χ2 = 1.8, d.f. = 3, P = 0.615) by the low concordance of values between the zones of the bay (Kendall’s concordance: Wt = 0.20) (Table 4). The trend consisted in a decrease of equitability from inner to outside bay (Table 4).
The NMDS (Fig. 3) showed that the biological assemblage composition of samples collected in August was more similar to each other than to samples collected during other periods at the same location. In contrast, high variation was found in the samples collected in April 2009. Dimension 1 of the NMDS revealed the pattern of change in the community from non-upwelling to upwelling season, where the assemblages presented a mid-degree of discrimination between sampling dates (ANOSIM, R = 0.46, P = 0.0004). No difference in the assemblages was found between the start of upwelling season (December) and non-upwelling season (August) (ANOSIM, P > 0.05), but there was degree of discrimination of 0.50-0.59 between the assemblage in the start of upwelling season (December) with the assemblage at the end of the upwelling season (April). Similar situation occurs between assemblages in the non-upwelling and upwelling seasons with a degree of discrimination 0.48 (ANOSIM, P ≤ 0.01).
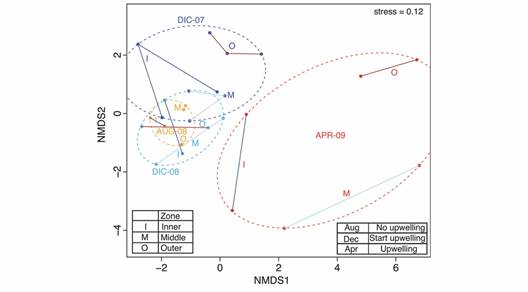
Fig. 3. MDS to show the similarity between sampling dates and zones of the bay based on their benthic macrofauna. Bahía Salinas, Costa Rica. The ellipses are the convex hull that contains all the samples in the group.
The taxa that changed the most between sampling dates corresponded to two polychaetes: Cirratulidae indet. that had a peak at the upwelling season (April 2009) and the spionid, Paraprionospio pinnata with a peak in December 2007 (Table 5). Both taxa presented their lowest density in August 2008 (non-upwelling season) (Table 5). Additionally, the amphipod indet. A presented low-density values in December 2008, and the polychaete, Aglaophamus verrilli, was more abundant during the non-upwelling season (Table 5).
Table 5 Results of the SIMPER analysis, and individuals per m2 per sampling date in Bahía Salinas, Costa Rica.
| Taxa | Feeding guild | Overall average dissimilarity | Contribution % | Cumulative Contribution % | Dec. 2007 | Aug. 2008 | Dec. 2008 | Apr. 2009 |
| 51.37 | ||||||||
| Cirratulidae indet. | Ds | 4.188 | 8.153 | 8.153 | 83 | 14 | 73 | 1062 |
| Paraprinospio pinnata | SFp-Ds | 3.445 | 6.707 | 14.86 | 402 | 6 | 62 | 147 |
| Amphipoda indet. A | Om | 2.851 | 5.55 | 20.41 | 290 | 134 | 72 | 117 |
| Sabellidae indet. | SFp | 2.815 | 5.48 | 25.89 | 73 | 22 | 30 | 280 |
| Aricidea (Acmira) catherinae | Dm | 1.885 | 3.67 | 29.56 | 71 | 28 | 44 | 235 |
| Apionsoma sp. | Dm | 1.596 | 3.106 | 32.67 | 20 | 76 | 71 | 87 |
| Prionospio (Minuspio) multibranchiata | SFp-Ds | 1.572 | 3.06 | 35.73 | 71 | 0 | 58 | 100 |
| Tellinidae indet. (Juvenile) | SFa | 1.502 | 2.925 | 38.65 | 8 | 6 | 0 | 194 |
| Scolelepis (Scolelepis) squamata | SFp | 1.117 | 2.175 | 40.83 | 3 | 0 | 0 | 91 |
| Nepthys panamanensis | Pm | 1.068 | 2.078 | 42.9 | 93 | 22 | 24 | 74 |
| Lumbrineridae indet. B | Pm | 1.061 | 2.065 | 44.97 | 38 | 32 | 18 | 106 |
| Sigambra tentaculata | Pm | 1.06 | 2.064 | 47.03 | 0 | 0 | 0 | 95 |
| Armandia brevis | Dss | 1.045 | 2.034 | 49.07 | 29 | 6 | 5 | 61 |
| Kinbergonuphis microcephala | Om | 1.037 | 2.018 | 51.09 | 20 | 14 | 18 | 83 |
The composition of the benthic fauna showed a marked change from inner to outside of the bay (ANOSIM, R= 0.60, P = 0.0001). In the NMDS (Fig. 3) this trend was observed within each sampling date, most notably in April 2009 (average dissimilarity: ad = 69.75, Table 5), followed by December 2007 (ad = 38.85, Table 5) and 2008 (ad = 35.04, Table 6), with the lowest differentiation observed in August 2008 (ad = 21.34, Table 6; Fig. 3).
The taxa that mainly contributed to the spatial change in composition of the assemblages between the zones of the bay are presented in Table 6. In December 2007, the amphipod indet. A and three polychaete taxa had high-density values outside of the bay. Additionally, the spionid Prionospio (Minuspio) multibranchiata had a peak of abundance at mid bay, and P. pinnata also had high abundance at the inner section (Table 6). In August 2008, a sipunculan worm and the onuphid polychaete Kinbergonuphis microcephala presented highest densities at the outside bay. An amphipod and a sabellid polychaete had their highest abundance at mid bay, and the decapod crustacean Malacoplax californiensis showed high densities at the inner bay (Table 6). Samples from December 2007 and December 2008 recovered the same taxa but presented higher densities in different zones of the bay (Table 6). For example, the polychete Aricidea (A.) catherinae and the aforementioned amphipod changed the dominance from outside to mid bay (Table 6).
Table 6 Results of the SIMPER analysis, and individuals per m2 by zone of the bay. Bahía Salinas, Costa Rica.
| Dec 2007 | Average dissimilarity 38.85 | % | Cumulative % | Inner | Middle | Outer |
| Amphipoda indet. A | 5.26 | 13.54 | 13.54 | 40 | 290 | 1307 |
| Paraprinospio pinnata | 3.90 | 10.03 | 23.56 | 229 | 184 | 1362 |
| Aricidea (Acmira) catherinae | 2.12 | 5.46 | 29.02 | 11 | 35 | 300 |
| Sabellidae indet. | 1.84 | 4.73 | 33.75 | 35 | 53 | 165 |
| Prionospio (Minuspio) multibranchiata | 1.82 | 4.67 | 38.42 | 70 | 151 | 25 |
| Aug 2008 | Average dissimilarity 21.34 | % | Cumulative % | Inner | Middle | Outer |
| Apiosoma sp. | 4.48 | 21.00 | 21 | 0 | 63 | 1084 |
| Amphipoda indet. A | 4.44 | 20.81 | 41.81 | 18 | 690 | 43 |
| Malacoplax californiensis | 1.42 | 6.65 | 48.46 | 71 | 0 | 0 |
| Kinbergonuphis microcephala | 0.96 | 4.50 | 52.97 | 0 | 0 | 130 |
| Sabellidae indet. | 0.90 | 4.22 | 57.19 | 0 | 79 | 0 |
| Dec 2008 | Average dissimilarity 35.04 | % | Cumulative % | Inner | Middle | Outer |
| Aricidea (Acmira) catherinae | 2.99 | 8.52 | 8.523 | 0 | 307 | 0 |
| Prionospio (Minuspio) multibranchiata | 2.20 | 6.27 | 14.79 | 0 | 43 | 229 |
| Paraprinospio pinnata | 1.91 | 5.44 | 20.23 | 93 | 71 | 32 |
| Amphipoda indet. A | 1.47 | 4.21 | 24.44 | 18 | 246 | 43 |
| Cirratulidae indet. | 1.35 | 3.85 | 28.29 | 63 | 79 | 79 |
| Apr 2009 | Average dissimilarity 69.75 | % | Cumulative % | Inner | Middle | Outer |
| Sabellidae indet. | 5.88 | 8.43 | 8.429 | 63 | 141 | 1690 |
| Goniada sp. A | 3.31 | 4.74 | 13.17 | 0 | 0 | 332 |
| Armandia brevis | 3.22 | 4.62 | 17.79 | 0 | 32 | 307 |
| Scolelepis (Scolelepis) squamata | 2.42 | 3.48 | 21.27 | 18 | 141 | 169 |
| Sigambra tentaculata | 2.29 | 3.29 | 24.55 | 32 | 43 | 363 |
Finally, in April 2009 the five taxa that contributed the most to the change in the bay were completely different from previous sampling dates, and the polychaetes presented higher densities outside of the bay (Table 6). Additionally, sabellid worms were the dominant group outside of the bay in that month (Table 6).
The ANOSIM test indicated the change of the feeding guilds composition by sampling dates (R = 0.47, P = 0.001) and zones of the bay (R = 0.34, P = 0.007). The SIMPER test by sampling date indicated that surface deposit feeders, passive suspension feeders, omnivores, and active suspension feeders were the main feeding guilds to explain the changes in the assemblages between sampling dates (Table 7). These groups presented low densities and taxa values during the non-upwelling season, the number of taxa increased at the start of the upwelling season, and the groups reached higher densities during the upwelling season. Among the groups that reached higher densities during the upwelling season, the highest corresponded mainly to the surface deposit feeders and the active suspension feeders. This pattern was present in the rest of the feeding guilds (Table 7). Finally, the assemblage was dominated by omnivores, mobile predators, and deposit feeders with mixed strategies during the non-upwelling season, but their densities were lower than during the upwelling season.
Table 7 Number of taxa (S) and density (D): ind/m2, and % of the community by feeding guilds of the Bahía Salinas.
| Feeding guild | SIMPER | Species | Density (ind/m2) | ||||||||
| Av. Dissim. 19.98 | Contrib. % | Cumulative % | Dec 2007 | Aug 2008 | Dec 2008 | Apr 2009 | Dec 2007 | Aug 2008 | Dec 2008 | Apr 2009 | |
| Ds | 4.1 | 20.5 | 20.5 | 8 | 2 | 5 | 6 | 213 | 22 | 169 | 1404 |
| SFp | 3.1 | 15.6 | 36.1 | 7 | 2 | 3 | 5 | 82 | 22 | 30 | 355 |
| Om | 2.0 | 10.2 | 46.3 | 8 | 5 | 6 | 6 | 539 | 277 | 332 | 800 |
| SFa | 1.8 | 9.2 | 55.6 | 6 | 4 | 6 | 6 | 42 | 32 | 68 | 468 |
| Dm | 1.8 | 9.0 | 64.6 | 8 | 4 | 5 | 6 | 122 | 196 | 196 | 463 |
| Pm | 1.7 | 8.6 | 73.2 | 9 | 5 | 6 | 6 | 705 | 175 | 495 | 967 |
| Dss | 1.6 | 8.0 | 81.2 | 6 | 4 | 5 | 5 | 55 | 53 | 54 | 267 |
| SFp-Ds | 1.2 | 6.1 | 87.3 | 6 | 2 | 4 | 3 | 71 | 14 | 61 | 28 |
| D-Pm | 1.1 | 5.4 | 92.6 | 6 | 4 | 3 | 5 | 59 | 32 | 22 | 112 |
| Pm-Sca | 1.0 | 4.8 | 97.5 | 2 | 1 | 1 | 5 | 7 | 6 | 5 | 108 |
| H | 0.5 | 2.6 | 100.0 | 0 | 0 | 1 | 4 | 0 | 0 | 5 | 53 |
| Feeding guild | SIMPER | Species | Density (ind/m2) | ||||||||
| Av. Dissim. 40.16 | Contrib. % | Cumulative % | Inner | Middle | Outer | Total of species | Inner | Middle | Outer | Mean density | |
| Ds | 3.6 | 18.8 | 18.8 | 6 | 7 | 8 | 9 | 112 | 252 | 474 | 279 |
| SFp | 3.1 | 16.1 | 34.9 | 4 | 7 | 6 | 2 | 24 | 100 | 187 | 104 |
| Om | 2.2 | 11.7 | 46.6 | 8 | 9 | 8 | 56 | 238 | 690 | 620 | 516 |
| Pm | 1.8 | 9.2 | 55.8 | 9 | 9 | 8 | 32 | 367 | 474 | 967 | 603 |
| Dm | 1.7 | 9.1 | 64.9 | 7 | 8 | 8 | 11 | 129 | 206 | 340 | 225 |
| Dss | 1.6 | 8.2 | 73.2 | 5 | 7 | 8 | 17 | 41 | 80 | 167 | 96 |
| SFa | 1.5 | 7.8 | 81.0 | 8 | 7 | 7 | 13 | 99 | 65 | 114 | 93 |
| SFp-Ds | 1.2 | 6.5 | 87.5 | 2 | 7 | 6 | 7 | 23 | 62 | 55 | 47 |
| D-Pm | 1.1 | 5.8 | 93.3 | 4 | 8 | 6 | 2 | 20 | 78 | 74 | 57 |
| Pm-Sca | 0.8 | 4.3 | 97.7 | 2 | 4 | 3 | 6 | 10 | 24 | 32 | 22 |
| H | 0.4 | 2.3 | 100.0 | 1 | 3 | 1 | 2 | 3 | 22 | 6 | 10 |
Av. Dissim. = Avarage dissimilarity. Feeding guilds, D: Deposit feeder, s: surface, ss: subsurface, m: mixed; SF: Suspension feeder, a: active, p: passive; Pm: Predator mobile; Sca: Scavenger; Om: Omnivore, H: Herbivore.
The variation of the assemblages between zones of the bay was marked by the surface deposit feeders, passive suspension feeders, omnivores, and mobile predators (Table 7). The general trend was that the density increased from inner to outside bay in the feeding guilds with contribution higher than 8 %. In the rest, the trend was a peak of density at mid bay (Table 7). The number of taxa by feeding guild was less variable between zones of the bay (Table 7).
Discussion
In the present study, the macrofauna had a low diversity and abundance in the non-upwelling season, which increased to a peak with the development of the upwelling season. Lee (1978) also found a change in the subtidal benthos of Panama Bay, concordant with the upwelling seasonality. The opportunist taxa such as spionids and cirratulids polychaetes of the benthos of Bahía Salinas can better utilize the input of food from the high plankton production during the upwelling months, as pointed out by Alongi (1989b) and Alongi (1990) in other localities. In the present study, there was a degree of discrimination (R) of 0.36 in the composition of taxa between December 2007 and December 2008, but the degree of discrimination had lower magnitude (R = 0.17) in the feeding guilds composition between these years.
During the start of the upwelling season (December 2007 and 2008), taxa such as Cirratulidae, Paraprinospio pinnata, Sabellidae, and Amphipoda presented considerable populations in the benthos. At the end of the upwelling season (April 2009), the high abundance of Cirratulidae, Sabellidae, Aricidea, and Tellinidae. This trend highlights the impact of seasonal nutrient influx in both the water and the sediment surface, similar to what occurs during the seasonal upwelling in Las Perlas, Panama Bay, which features comparable assemblage components (Mair et al., 2009). In the case of Kinbergonuphis possiby utilizing the abundance of phyto and zooplankton preys during this period (Checon et al., 2017; Jumars et al., 2015). In contrast, the non-upwelling season (August 2008) showed a decline in these groups, with a shift towards certain taxa such as Amphipoda, Apionsoma, Prionospio, Aricidea and Lumbrineridae that persisted, forming a resilient core that adapts to food availability in the sediment, ensuring the continuity of the assemblage even in less favorable conditions as in other tropical soft bottom assemblages (Tavakoly-Sany et al., 2018). Pacheco et al. (2010) suggested that diverse pathways in the succession process can produce different end points of the communities in subtidal benthos within the same locality. In the present study, year to year, the decline of certain populations during the non-upwelling season results in variable group of survival taxa. This condition allows other taxa to dominate or to be recruited to fill the empty niches resulted in a major taxonomic dissimilarity than the feeding guild dissimilarity.
During the upwelling season, the community was composed mainly of surface deposit feeders (Cirratulidae and Paraonidae worms) and active suspension feeders (tellinid and venerid clams), both in high densities, but both groups decreased during the non-upwelling season. Guzmán-Alvis et al. (2006) indicated that in Bahía Portete in the Colombian Caribbean deposit feeders dominated the fauna during the upwelling season because of the increase in available food on the seabed. This is the case of a Cirratulidae indet. and Aricidea (Acmira) catherinae (surface or mixed deposit feeders), which were within the main contributors to the total abundance during upwelling season, but had low abundance during the non-upwelling season. Similarly, surface deposit feeders accounted for less than a third of the number of polychaete taxa during the non-upwelling season in the Gulf of Panama (Mair et al., 2009). Another opportunist group that decreased drastically during the non-upwelling season were the passive suspension feeders, for example the tube worms (Sabellidae). Lee (1978) also indicated a rapid decrease in benthic biomass of opportunist taxa when primary production dropped during the reduction of the winds, following the upwelling season in Panama Bay. Similar to the present study, Quintana et al., (2015) found that high abundance of macrofauna is the result of the increase in wind velocity and phytoflagellate blooms in a coastal upwelling system in SE Brazil. It is possible that the macrofauna responds positively to the organic matter from the phytoplankton blooms that occur during the upwelling events in this region of Costa Rica (Morales-Ramírez et al., 2016).
Deposit feeders with a mixed strategy (surface and subsurface) such as sipunculans, mobile omnivores (mainly amphipods), and predators (the polychaete Aglaophamus verrilli and the crustancean Malacoplax californiensis) were the remaining fauna during the non-upwelling season. Within the deposit feeders, a few taxa of Ampharetidae, Cirratulidae, Cossuridae, Maldanidae, Spionidae, Paraonidae and Capitellidae persisted in low numbers during the non-upwelling season, because these taxa were able to compete during the period of low food supply. One example was the opportunist capitellid Mediomastus ambiseta, which was found in the non-upwelling season, whilst other capitellids were not recorded. In contrast, other capitellids have not been recorded during this season because these are opportunist taxa (Fauchald & Jumars, 1979), but this pattern could be due to numerous factors, such as nutrient availability, water temperature changes, and variations in granulometry, or biological interactions whether these factors are directly related to upwelling phenomena or not (Alongi, 1990). Graf (1992) pointed out that some infaunal organisms bury for food into the sediment, thus avoiding competition with surface deposit feeders. That food could be used later during a period of scarcity. Additionally, populations that persist through the year (i.e. spionid worms and tellinid bivalves) would have the capacity to use different food sources by switching between surface detritus or suspension feeding when necessary (Cosentino, & Giacobbe, 2008). This could explain in part the coexistence of some subsurface deposit and filter feeders after the upwelling events in the present study.
Finally, the number of taxa varied among zones of the bay in December, but the number of taxa was similar across the bay during August (non-upwelling season) and April (upwelling season). The abundance was low in August and higher during April. The harsh benthic conditions in Bahía Salinas at the beginning of the upwelling season (December), including lower bottom water temperature and lower concentration of dissolved oxygen are similar to those in the Culebra Bay, Gulf of Papagayo (Rixen et al., 2012). These conditions could explain the pattern of spatial variation, as found in other benthic systems (Alongi, 1990; Gray & Elliot, 2009; Mair et al., 2009). Additionally, dry and rainy seasons can influence tropical benthic systems abundance and distribution as in Golfo de Nicoya, Costa Rica (Maurer & Vargas, 1984; Maurer et al., 1988). The abundance and diversity index values were more spatially variable, but results show low equitability in the outside bay. This is the result of several taxa that changed their distribution within the bay through the study period due to differences in the environmental conditions. For example, changes in the dynamic distribution of sediments (data not available), food availability (low during the non-upwelling season, based on chlorophyll concentration), and depth promote the settling, growth, or prevalence of the different benthic populations (Little, 2000). In this way the spatial variability of the assemblages was higher during the upwelling season, and the populations from the outside bay reached maximum density values. Moreover, the spatial pattern of the feeding guilds within the bay was more stable that the taxonomic composition of the assemblage, with an increase of the main feeding guilds from inner to outside bay.
During the upwelling season, the abundance and diversity of benthic communities increased in comparison with the non-upwelling season. The variation in the composition of assemblages and diversity occurs in all the zones of this bay, although the outside bay presents lower values of equitability. During the upwelling season, the community was composed mainly of surface deposit feeders and active suspension feeders. These groups possibly utilize the organic matter that sinks to the bottom, produced by planktonic organisms. At the non-upwelling season, the community was dominated by deposit feeders with a mixed strategy (surface and subsurface), mobile omnivores, and predators.
During the upwelling season in Bahía Salinas, species richness and abundance of benthic fauna peak, likely due to high plankton productivity. In contrast, the non-upwelling season shows a decline in these parameters, shifting from surface deposit and suspension feeders to mixed strategies and omnivore feeders. These findings highlight the dynamic nature of benthic communities, adapting their traits to environmental variations in tropical seasonal upwelling areas.
Ethical statement: the authors declare that they all agree with this publication and made significant contributions; that there is no conflict of interest of any kind; and that we followed all pertinent ethical and legal procedures and requirements. All financial sources are fully and clearly stated in the acknowledgments section. A signed document has been filed in the journal archives.

