




 Inglês (pdf)
 Artigo em XML
 Referências do artigo

 Tradução automática
 Enviar este artigo por email
 Citado por SciELO
 Similares em
SciELO
 uBio

 Permalink


Introduction
The Magdalena basin is the economic center of development in Colombia with approximately 80 % of the country’s population settlement, with a generation of 80 % of the national gross domestic product. Likewise, its hydrographic region generates 70 % of hydropower production, 70 % of agricultural crops, 90 % of coffee and 50 % of freshwater fisheries (Restrepo et al., 2020). The growth of the Colombian population and its economic development in the Magdalena River basin has generated multiple pressures on the fluvial network and its natural environments, which is reflected in the environmental degradation of the basin (Jiménez-Segura & Lasso, 2020).
The main water bodies in the different municipalities of the Department of Atlántico, most of which are connected to or influenced by the Magdalena River in its lower basin, reveal a pronounced deterioration in water quality because of research carried out in the last two decades (Oyaga-Martínez, 2013). For this reason, it is pertinent to monitor the environmental and hydrobiological conditions of the swampy bodies and the main channel of the river. These wetlands provide ecosystem services and contribute to the social, economic and cultural development of the region, to understand how anthropic activities affect the conditions of rivers and aquatic biota, to assess the impacts and contribute to the management and conservation of these ecosystems (Gutiérrez-Fonseca & Ramírez, 2016).
One way to generate information on the environmental status of aquatic ecosystems is through the use of the Ecological Quality Index (EQI) proposed by Haase and Nolte (2008) and Chalar et al. (2011), which allows defining an environmental gradient according to the physical and chemical particularities of each system and, in turn, determine optimal and tolerance values for each organism, without conditioning the group and system to which they belong, according to this gradient (Flórez-Córdoba, 2020; Hernández et al., 2020), positioning the EQI as an integral and robust alternative to biotic indices mostly used in the country, such as the Biological Monitoring Working Party-Colombia (BMWP-Col) (Roldán, 2003), which has some weaknesses (Forero et al., 2014).
The design and implementation of monitoring tools are fundamental for the establishment of management plans and the definition of restoration objectives in South American rivers (Castillejo et al., 2024). EQI uses information from both environmental variables and biological groups with roles in bioindication functions to evaluate the ecological quality of an ecosystem. Ecological quality defined by its structure and function, and assessed by physical, chemical, hydromorphological and biological indicators (European Commission, 2000; Salinas-Camarillo et al., 2021). Indicator organisms, due to their life history traits, provide information that physicochemical analyses alone do not detect.
In the case of phytoplankton, these organisms respond rapidly to environmental changes due to their short life cycle. These changes alter the structure of their communities and have repercussions on another group of organisms in the system, especially because of their important role in maintaining the food web (Winder & Sommer, 2012) as primary producers. This is related to changes in the proportion, composition and structure of community taxa due to variations in water conditions (Castillejo et al., 2024). Therefore, microalgae have been widely used as bioindicators of water quality, as they are an immediate reflection of changes in aquatic ecosystems due to their high sensitivity to variations (Bellinger & Sigee, 2010; Heinrich et al., 2019; Hemraj et al., 2017).
Similarly, EQI has been applied in other regions of Colombia using aquatic macroinvertebrates and periphytic algae as bioindicator organisms (Forero et al., 2014; Hernández et al., 2018, Hernández et al., 2020). This index would allow responding to the need for a robust indicator to evaluate the quality of the ecosystem and provide an estimate of the quality of water used for drinking water treatment at different points in the department of Atlántico through the combination of physical, chemical and hydrobiological variables. For this reason, this study is proposed on the left riverbank of the Magdalena River in its lower basin, the main source of water supply in the Department of Atlántico, in order to evaluate its environmental condition by means of the Ecological Quality Index based on phytoplankton.
Material and methods
Study area: The Department of Atlántico is part of the last section of the Magdalena River along its left riverbank in Northern Colombia; it includes an area that goes from Canal del Dique (in the South) to the mouth of the Magdalena at Bocas de Ceniza (to the North), near Barranquilla. A warm thermal floor predominates in the Atlántico, with temperatures that generally vary between 24 °C to 28 °C but can exceed 34 °C at some times of the year (García-Alzate et al., 2016; Instituto de Hidrología, Meteorología y Estudios Ambientales (IDEAM), 2023).
Six monitoring stations were established in the Magdalena River in different municipalities of the department: Barranquilla-Las Flores (S1), Barranquilla-Aqueduct (S2), Sabanagrande (S3), Ponedera (S4), this taking into account the location of the different water catchments for the treatment plants operated by the Sociedad de Acueducto, Alcantarillado y Aseo de Barranquilla (Triple A S.A. E.S.P.), Suan (S5) in the water catchment for supplying this municipality and finally, Canal del Dique (S6) in order to approach the greatest spatial variation along the riverbank (Fig. 1).
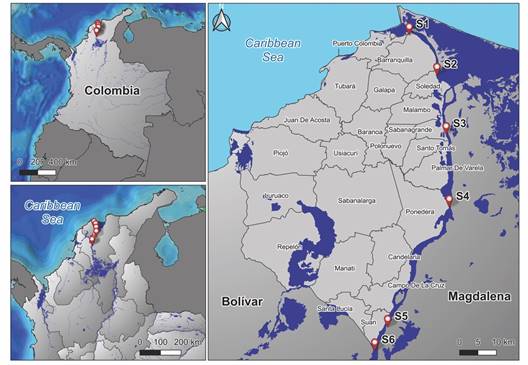
Fig. 1 Location of the six monitoring stations in the lower Magdalena River basin, Department of Atlántico, Colombia.
The Magdalena River is characterized by a bimodal hydrological regime of rains and droughts, with moments of water level transition from one season to another (Rojas-Luna & Pardo-Castañeda, 2024). Sampling was conditioned to climatic periods: The moment of rising waters occurs with the first rains that increase the river level (M1: May 2021), high waters when the river reaches its maximum levels (M3: October 2021 and M6: June 2022), the period of falling waters when the river level begins to decrease due to the absence of precipitation (M2: August 2021 and M4: January 2022) and finally, low waters during the dry season (M5: March 2022).
Sampling phase: Six bimonthly samplings were conducted between the months of May 2021 to June 2022, in order to cover the different moments of the hydrological regime using the water level of the Magdalena River in Calamar-Atlántico (2021-2022) taken from Corporación Autónoma Regional del Río Grande de la Magdalena (Cormagdalena) and IDEAM; and include the subregions of the Magdalena River and the Canal del Dique through the stations, established as areas of environmental interest under the criteria of Strategic Environmental Systems, together with the Coastal subregion (Avendaño-Maldonado et al., 2021; Gobernación del Atlántico, 2012).
Variables such as pH with a WTW 3110 pH meter, dissolved oxygen with a WTW 3205 oximeter, conductivity with a WTW 3110 conductivity meter, water temperature, relative humidity and environmental temperature with a UNI-T thermohydrometer were measured in situ. In addition, water samples were taken in a two-liter bottle, which was cooled with ice for subsequent analysis of alkalinity, acidity, nitrites (NO2 -), nitrates (NO3 -), sulfates (SO4 2-), total suspended solids (TSS), total hardness, water turbidity and phosphates (PO4 3-); and a sample in a 500 ml bottle that was preserved with H2SO4 until maintaining pH less than 2.0 and refrigerated at a temperature less than or equal to 6 °C for testing total nitrogen (N), ammonium (NH4 +), total phosphorus (P) and chemical oxygen demand (COD) following the standards described by American Public Health Association (APHA, 2023), in the Quality Control laboratory of Triple A S.A. E.S.P.
Similarly, surface water (30 l) was filtered using a 23 µm diameter phytoplankton capture mesh. The sample was taken for S1, S3, S4 and S5 directly on the river, for S2 it was taken in the lagoon (natural pre-sediment of the Barranquilla aqueduct treatment system) and finally, in S6 it was taken on an artificial arm of the river (Canal del Dique). The volume of filtered samples was reduced to 120 ml and stored in amber glass bottles, fixed with Lugol’s solution, labeled with the field specifications (place, date and station) and transported to Triple A S.A. E.S.P.’s Quality Control laboratory for identification and counting.
Laboratory phase: Acidity, alkalinity, ammonium, nitrites, total suspended solids, sulfates, phosphates and total hardness were analyzed using the methodology proposed by APHA (2023). In addition, COD, nitrates, total phosphorus and total nitrogen were measured using Spectroquant kits from Merck.
Phytoplankton were observed using a Sedgewick-Rafter chamber with a chamber volume of 1 ml and observed under an inverted optical microscope at 200X magnification for counting and 400X to 1 000X magnification for taxonomic identification (Rojas-Luna & Pardo-Castañeda, 2024). The sample inside the chamber was completely analyzed and its standardization and representativeness was evaluated by rarefaction curves by fields. Absolute abundance of the species was used in the EQI analysis. Identification was made using taxonomic keys and research material in Bicudo and Menezes (2006), van Vuuren et al. (2006), Bellinger and Sigee (2010), Ministerio de Medio Ambiente y Medio Rural y Marino (2011), Moreno et al. (2012), Montoya-Moreno et al. (2013), and Oliva-Martínez et al. (2014), down to the lowest possible taxonomic level. For the revision of taxonomic names and synonymies, the online database AlgaeBase was consulted.
Data analysis: For the use of the index, the methodology proposed by Chalar et al. (2011), Forero et al. (2014) and Hernández et al. (2018) was used as a basis, and the method was executed using R statistical software (Flórez-Córdoba, 2020).
Initially, the matrices of physicochemical variables and abundance of organisms were standardized based on the method of Guisande-González et al. (2006). A Spearman correlation was performed between physicochemical variables to observe redundancy and variance inflation factors (VIF) to analyze multicollinearity (VIF > 20: Strong collinearity) to reduce the dimensionality of the index with the exclusion of variables that were explained by others. A Detrended Correspondence Analysis (DCA) was used to evaluate the length of the environmental gradient and to obtain the statistical basis for the application of the appropriate ordination model; a Detrended Redundancy Analysis (RDA) is used when the length of the environmental gradient is less than 2.5 and a Canonical Correspondence Analysis (CCA) when it is greater or equal to 2.5, in order to determine the environmental gradient from the abundances of the species with respect to the physicochemical variables of the environment. The significance of the model was estimated by means of the Monte Carlo permutation test.
As recorded in the DCA, the multivariate analysis for this study was a CCA, considering the length of the environmental gradient (2.63 standard deviation). Then, the values of the first axis obtained from the ordination analysis were rescaled between 1 and 10 from a linear regression, being the lowest score scaled to ten and the highest was given a value of one. Optimal and tolerance scores were calculated for each organism through a Weighted Averages Analysis (WA), considering the abundance of the species and the rescaled values; which allowed identifying sensitive taxa of environmental quality by their sensitivity, with high optimal and low tolerance values.
Subsequently, the EQI values were calculated for the monitoring stations in each of the samplings following the formula described by Haase and Nolte (2008). To give robustness to the calculation of the index, a Spearman correlation was made between the EQI values and the scores of the first axis of the multivariate analysis. Another correlation was used to determine the physicochemical indicator variable that models the composition of the organisms, taking into account the EQI values and the physicochemical parameters with a ratio of R ≥ 0.5 or R ≤ -0.5 (Ministerio de Ambiente y Desarrollo Sostenible, 2018). A Clustering Analysis using Ward’s method and Euclidean distance was used in order to establish three groups that represented three quality categories on a scale of poor, fair and good. The definition of the ranges for the indicator variable and the EQI, was made using the minimum and maximum values of each group, or the medians if the first ones were superimposed (Forero et al., 2014).
Finally, a Spearman correlation was used to determine the degree of association between EQI values and some parameters involved in the taxonomic and ecological composition of phytoplankton such as river level, total abundance and proportion of the main phytoplankton groups (diatoms, green algae, cyanobacteria and euglenids).
Results
Phytoplankton community composition: 43 species and 34 morphospecies distributed in five phylum, eight classes and 36 families were recorded; however, only 56 taxa were included in the analysis considering taxa that were present in more than one sampling station. The highest species richness was represented by the phylum of diatoms (Bacillariophyta: 44.2 %), followed by green algae (Chlorophyta: 20.8 %), blue-green algae (Cyanobacteria: 14.3 %), euglenids (Euglenozoa: 11.7 %) and finally, charophytes (Charophyta: 9.1 %). However, it is the Cyanobacteria (47 %) that contributes most to the relative abundance of the phytoplankton community, followed by the Bacillariophyta (38.3 %). Dominant species include Oscillatoria tenuis Agardh ex Gomont 1892 (31.4 %), O. princeps Vaucher ex Gomont 1892 (10.5 %), Melosira varians Agardh 1827 (5.7 %), Ankistrodesmus sp. (5.3 %), Aulacoseira granulata (Ehrenberg) Simonsen 1979 (4.2 %), and finally, Raphidiopsis raciborskii (Wołoszyńska) Aguilera et al. 2018 (3.9 %) and Pseudanabaena sp. (3.9 %).
Physicochemical variables: Of the 15 environmental variables taken in the study, 10 were included in the model. Spearman correlations showed that alkalinity (R = 0.65) and sulfates (R = 0.70) had a high association with conductivity; likewise, pH (R = 0.66), water temperature (R = 0.67) and TSS (R = 0.85) had a high correlation with turbidity. These variables whose behavior was explained by others were excluded from the analysis. The use of the variables selected from the correlations was supported by the VIFs less than 20, which indicates that there is no collinearity between them.
Environmental gradient: The first two axes of the CCA obtained the highest eigenvalue (0.25 and 0.21, respectively) and explained 36 % of the total variation in the data. The Monte Carlo test showed that the model is highly significant (p < 0.001). The first axis had a high positive correlation with nitrogenous nutrients such as total nitrogen (0.86) and nitrates (0.75) and a slight correlation with conductivity (0.52); meanwhile, the second axis was negatively associated with dissolved oxygen (-0.74) and slightly with other nutrients such as ammonium (0.50) and total phosphorus (0.50).
Thus, the first axis was mainly associated with nutrients, such as total nitrogen, which was positively and significantly correlated (R ≥ 0.6 and p < 0.05) with dissolved oxygen and nitrates, which in turn were positively associated with turbidity, sulfates and conductivity. This axis showed a gradient of high nutrient values in relation to the hydrological regime, mainly to the period of falling water. Similarly, for the second axis, dissolved oxygen was also significantly and positively correlated with pH and sulfates, while total phosphorus and phosphates were not correlated with other variables. This axis was influenced by phosphorus nutrient contributions from activities and discharges along the riverbank, which constantly impact the stations.
The sample scores obtained by the stations in each monitoring in the CCA were the basis with statistical and environmental support for the re-scaling necessary in the calculation of the index. The rescaled values between 1 (most impacted stations) and 10 (least impacted stations) were obtained from the equation y = -2.0371x + 6.7865, where the value of x was replaced by the sample score of each station per sampling.
Optimal and tolerance scores of the organisms: The WA analysis showed a model with adequate statistical performance based on a high coefficient of determination (R2 = 0.96), low root mean square error of prediction (RMSEP = 0.42) and low mean (Avg = 0.00) and maximum (Max = 0.54) biases.
Of the 56 taxa considered for the analysis, 38 of these recorded optimal values higher than 6.1 (a value associated with good ecological quality). Of these 38 taxa only five obtained low tolerance values (Toli ≤ 1.0), which is reflected in a high sensitivity to variations in the physicochemical conditions of the water and confers them characteristics as sensitive organisms in the ecosystem (Fig. 2). Three of the five taxa belong to the group of diatoms or Bacillariophyta (Navicula sp1, Diatoma sp3 and Pinnularia sp2), and the other two belong to the same genus Closterium within the Charophyta (C. limneticum Lemmermann 1899 and C. rostratum Ehrenberg ex Ralfs 1848).
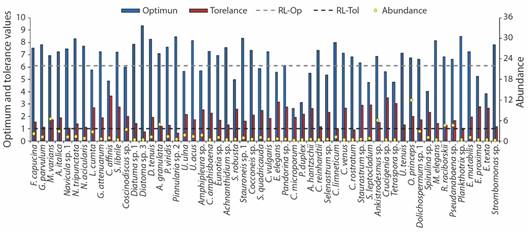
Fig. 2 Optimum (Op) and tolerance (Tol) values of phytoplankton species associated with the environmental gradient of the Magdalena River. RL-Op: Reference limit of optimum values, RL-Tol: Reference limit of tolerance values taken from Forero et al. (2014).
Ecological Quality Index: The EQI values in the West bank of the Magdalena River using phytoplankton as a biological model were in a range between 5.5 and 7.5 (Table 1). These scores have a high and significant correlation with the sample scores of the first axis of the CCA (R = -0.78, p < 0.01). Indicating that the index explains most of the environmental variation through the relationship of phytoplankton with the physicochemical variables of the water. Likewise, Spearman’s correlation showed that EQI has an inverse and significant relationship with conductivity, representing an indicator variable of the ecological quality of the ecosystem (R = -0.54, p < 0.01). Conductivity is a conservative measure, considered a key parameter in the limnology of neotropical water bodies, which provides information on the metabolic dynamics of aquatic ecosystems; it is also related to the nutrients that contribute ions to the system, to primary productivity (phytoplankton), to pollution contributions and to the hydrological regime.
Table 1 Descriptive statistics of EQI scores and conductivity values, with their respective threshold values for ecological quality categories.
| Statistics | Group 1 | Group 2 | Group 3 | ||||
| Conductivity (mg/l) | EQI | Conductivity (mg/l) | EQI | Conductivity (mg/l) | EQI | ||
| Average | 173 | 6 | 156 | 7 | 125 | 7 | |
| Minimum | 162 | 6 | 151 | 6 | 117 | 7 | |
| Maximum | 197 | 7 | 160 | 8 | 139 | 7 | |
| Median | 169 | 6 | 156 | 7 | 124 | 7 | |
| Standard deviation | 11 | 0.3 | 3 | 0.5 | 6 | 0.2 | |
| Index | Group 1 | Group 2 | Group 3 | ||||
| Ecological quality | Poor | Fair | Good | ||||
| Conductivity (mg/L) | ≥ 161 | 140-160 | ≤ 139 | ||||
| EQI | ≤ 5.9 | 6-7 | ≥ 7.1 | ||||
The cluster analysis showed three groups, where the first group represented stations and monitoring sites with the highest average conductivity values associated with high concentrations of nitrogenous nutrients (nitrates, total nitrogen and ammonium), sulfates, high COD values indicating organic pollutants and high turbidity in the water. The third group recorded the opposite behavior to group one, with the lowest average values of conductivity, nitrogen nutrients, sulfates, COD, turbidity, as well as TSS in water and alkalinity. Finally, the second group obtained the sites and periods with average values intermediate between the two previous groups (Fig. 3). The results show that the behavior of the EQI values follow an environmental gradient from waters with a tendency to a high concentration of ions and nutrients to waters with lower ionic dynamics and less turbidity.
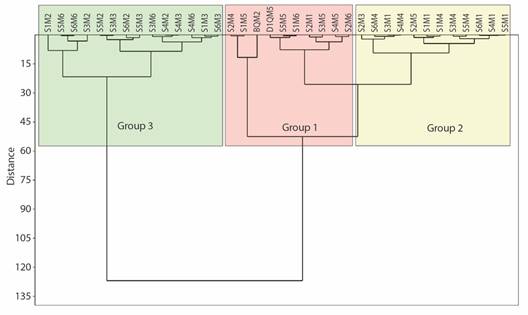
Fig. 3 Grouping of stations and monitoring considering EQI scores and conductivity values in the Magdalena River. S1: Barranquilla-Las Flores, S2: Barranquilla-Aqueduct, S3: Sabanagrande, S4: Ponedera, S5: Suan, S6: Canal del Dique. M1: Monitoring 1, M2: Monitoring 2, M3: Monitoring 3, M4: Monitoring 4, M5: Monitoring 5, M6: Monitoring 6.
On average, the six stations monitored in the Magdalena River on its bank over the Department of Atlántico are in a regular ecological condition, being the most impacted the Barranquilla-Aqueduct station with the lowest EQI value. This reflects that the municipalities located in the lower part of the basin are exposed to frequent environmental impacts and anthropic pressure due to the development of activities near the bank, such as industrial activity, wastewater discharge, agriculture, animal husbandry, deforestation and connection with highly eutrophicated swampy bodies, even though the river has resilient characteristics in its dynamics.
The EQI showed variation with respect to the hydrological regime, registering values in poor ecological condition in M5 associated with low waters with little rainfall where the river level decreases and the concentration of anthropic and natural impacts increases, which is reflected in the predominance of cyanobacteria and increase in the general abundance of phytoplankton. By contrast, the EQI showed a good ecological condition in M1 corresponding to the period of the first rains of the year, which provide a process of mixing of the ionic conditions of the river, increasing its flow and turbidity, which impacts the life cycle of microalgae. However, once the rainy period is prolonged, the ecological condition of the ecosystem tends to decrease, mainly associated with discharges of solid pollutants and wastewater through the streams and interconnections with urban centers and swampy bodies characteristic of the Atlántico department’s riverbanks (Fig. 4).
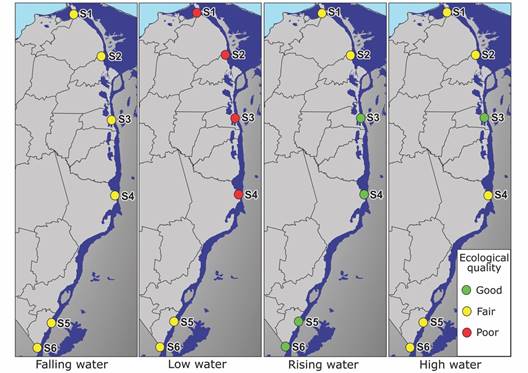
Fig. 4 Ecological quality of the monitoring stations in relation to the hydrological regime of the Magdalena River, Atlántico, Colombia. S1: Barranquilla-Las Flores, S2: Barranquilla-Aqueduct, S3: Sabanagrande, S4: Ponedera, S5: Suan, S6: Canal del Dique.
The EQI values had a high correlation with the relative abundance of diatoms (R = 0.70) so that when this group predominates in the phytoplankton community the index values tend to be higher; the opposite case is registered with cyanobacteria (R = -0.33) where their predominance causes a decrease in EQI values in relation to their ability to compete for resources preventing other groups of algae to proliferate, generating ecological imbalances that are reflected in water quality. This reflects the importance of the composition and structure of the biological group under study, so that once the EQI has been calculated, the indicator variable plays a key role in subsequent routine monitoring. Therefore, in this case, conductivity may register high values but if the phytoplankton diversity in terms of balance between the main groups (diatoms and cyanobacteria) is not altered, it may be related to a punctual change of the physicochemical variable (erosion or sedimentation on the riverbanks, stream discharges, etc.) and not a prolonged alteration of the water quality. In addition, another important factor in relation to the EQI is the absolute abundance recorded for the phytoplankton community (R = -0.57); therefore, there may be a dominance of cyanobacteria with respect to the other groups of algae, but if the total abundance recorded is low, it is not reflected in a deterioration of the ecological quality of the ecosystem.
Discussion
Conductivity was the main variable that determined the variation of the environmental gradient in the evaluated section of the Magdalena River. This variable was positively and significantly correlated with sulfates and alkalinity: The former are considered the most important anions in water after carbonates because algae can take advantage of their availability in the environment through their protoplasm, which is necessary to produce key proteins in the life cycle of phytoplankton. Furthermore, alkalinity is a measure related to carbonate and bicarbonate ions that influence the functioning and metabolism of water bodies through photosynthesis and respiration processes (Roldán & Ramírez, 2022). In addition to knowing biological and geochemical factors of aquatic ecosystems, conductivity allows detecting sources of anthropic contamination through the drastic increase in concentrations related to activities carried out on the riverbank such as agriculture, industrial and domestic pollution, or by natural components such as the hydrological regime or the La Niña or El Niño phenomena (Restrepo et al., 2020; Roldán & Ramírez, 2022).
Similarly, the first and second axis of the CCA showed a correspondence of nitrogenous and phosphorous nutrients with the environmental gradient, which supports the dynamics of eutrophication related to periods of rainfall and drought, as well as anthropic discharges. This presence of nitrogen compounds such as nitrate in large quantities can be a risk factor for the fauna associated with the aquatic ecosystem, as well as for the use of water for human consumption (IDEAM, 2023). Likewise, the increase of phosphorus compounds can accelerate eutrophication, causing proliferations of generally harmful algae that generate a decrease in the concentration of dissolved oxygen, causing mortality of aquatic fauna or even terrestrial animals distributed along the riverbanks (Gutiérrez-Moreno & De la Parra-Guerra, 2020).
Considering the optimum and tolerance values, it was possible to identify sensitive organisms that model the environmental gradient in the waters of the lower Magdalena River basin. Three species of diatoms and two charophytes were identified: Pinnularia sp2, a typical taxon of oligotrophic and low ion concentration freshwater (da Silva et al., 2016), together with other Bacillariophyta such as Navicula sp1 and Diatoma sp3, are robust indicators of good environmental status. Their sensitivity to changes in nutrient concentration and conductivity, in addition to their fundamental role in the food web, reflects the health of the ecosystem (Srivastava et al., 2016). However, the ecological particularities of diatoms must be considered, because these genera may have species sensitive to eutrophication, as well as species tolerant to eutrophic conditions (Lobo et al., 2015; Roa & Pinilla-Agudelo, 2017). Likewise, Closterium is a group of algae sensitive to water quality, including C. limneticum and C. rostratum, useful in indicating the trophic state of aquatic ecosystems; they are considered bioindicators of oligotrophic and oligotrophic-mesotrophic systems, generally with low abundance in water bodies with eutrophic and/or toxic characteristics (Gutiérrez et al., 2017; Wang et al., 2018).
The EQI showed a deterioration in the environmental quality of the stations monitored in Atlántico, particularly highlighting S2, mainly related to an increase in sedimentation near the municipality of Soledad, the discharge of water with physicochemical characteristics different from those of the river such as those of the El Salao’ and El Platanal streams, which are misused for wastewater discharge in areas with historical social problems such as land invasion (Corporación Autónoma Regional del Atlántico , 2023). In addition to these problems, there is the poor disposal of solid waste in the department of Atlántico, mainly related to the lack of environmental awareness among citizens. These problems also increased due to the high rainfall caused by the La Niña phenomenon in 2021 and 2022, which caused the river to flood the swampy bodies with low-flow water that drained into the river and deteriorated the ecological quality of the riverbank.
Good ecological quality was recorded at the time of rising water when the concentration of total suspended solids, water turbidity and flow rate increased. In addition, the concentration of nitrogenous and phosphorus nutrients, essential for algal growth, decreases during the same period (Rojas-Luna & Pardo-Castañeda, 2024). This decrease in nutrients prevents organisms such as cyanobacteria from establishing on the aquatic surface (Chorus & Zessner, 2021). Because the Magdalena River is characterized by its high sediment production in South America, with oligotrophic waters in the rainy season, which limits the proliferation of cyanobacteria or euglenids, and favors the predominance of algal groups such as diatoms, which have morphological structures that allow them to establish in these conditions (Heinrich et al., 2019; Martínez & Donato, 2003; Restrepo et al., 2020).
The EQI is a tool that allows diagnosing the environmental status of an aquatic ecosystem through reference categories established from a robust statistical analysis (Hernández et al., 2018, Hernández et al., 2020). However, although EQI considers the abundance of taxa there are other life history factors of species that need to be taken into account. As for example, the proportion of phytoplankton groups was important in explaining the variation of EQI values, generally relating values associated with good ecological quality with a predominance of the diatom group over cyanophytes and euglenophytes; in contrast, poor quality values are represented by the dominance of cyanophytes. According to the classification proposed by Kruk et al. (2010), diatoms belong to the group of non-flagellate organisms with silica exoskeletons that rarely have substantial negative effects on water quality. Most cyanophytes belong to the group of algae with long filaments and aerotopes, a structure that, together with a high surface-volume ratio, allows them to have a low sinking rate, which facilitates their access to resources. They also have a high tolerance to conditions of low nutrient concentration and sunlight incidence, which leads them to remain even when conditions are not optimal. The dominance of this group of microalgae can generate large impacts on water quality related to high abundance and the potential to form toxic blooms.
Currently, the Ecological Quality Index is recommended as a monitoring strategy for aquatic ecosystems in the Water Resource Management Plan of Minambiente. It is a quantitative tool that provides physicochemical and biological information on water bodies and is a robust alternative to the indexes normally used in bioindication such as the BMWP-Col (Roldán, 2003). However, it is necessary to implement new factors in the study of the EQI: the hydrological regime influenced by the La Niña and El Niño phenomena, the life history traits of the taxa under study, the balance in the relative abundance of these taxa in the community, the historical changes in the physicochemical condition of the rivers, the strong and growing anthropic and socio-natural threats to which the water resources are exposed, among others, are variables that should be included in the analysis of the ecological status of the aquatic ecosystems. The latter taking into account that the reference categories are dynamic, and the EQI should be flexible to increase or decrease the number of categories as needed.
Ethical statement: The authors declare that they all agree with this publication and made significant contributions; that there is no conflict of interest of any kind; and that we followed all pertinent ethical and legal procedures and requirements. All financial sources are fully and clearly stated in the acknowledgments section. A signed document has been filed in the journal archives.

