




 Inglês (pdf)
 Artigo em XML
 Referências do artigo

 Tradução automática
 Enviar este artigo por email
 Citado por SciELO
 Similares em
SciELO
 uBio

 Permalink


Introduction
Human activities can have significant negative impacts on mammals, threatening their survival, causing biodiversity loss, and altering the ecosystems in which they inhabit. For example, tropical forests play an important role in maintaining biodiversity and global ecological services, however, human disturbance has caused alarming rates of loss, fragmentation and degradation in this type of forest (Bradshaw et al., 2009; Curtis et al., 2018 Díaz-Gallegos et al., 2010; Gibson et al., 2011). The fragmentation produces patches of vegetation surrounded by a matrix of different land use or vegetation (Saunders et al., 1991). Currently, large fragments of tropical forests are being reduced to mosaics of small fragments (Hansen et al., 2020) and exhibit degradation processes (Gibson et al., 2011; Phillips et al., 2017). This means that forests lose their capacity to provide ecosystem services or undergo significant changes in species composition (Millennium Ecosystem Assessment, 2005). Among the main causes are the intensification of slash and burn agriculture, an agricultural system that transforms the forest into a mosaic of vegetation patches represented by various stages of succession or secondary vegetation (Brady, 1996; Phillips et al., 2017). Such changes are producing profound effects on the presence, abundance, interactions, spatial distribution and behavior of species (Bowyer et al., 2019; Gibson et al., 2011; Pires et al., 2023).
Wild mammal communities show a relationship between the intensity of landscape fragmentation and degradation with species composition. Slightly fragmented or moderately degraded landscapes can maintain a number of species similar to those occurring in primary forests but showing changes in the dominance of resilient generalist species (Barlow et al., 2007; Borges, 2007; Gibson et al., 2011; Phillips et al., 2017; Scales & Marsden, 2008; Tilker et al., 2019). Forest fragments tend to contain less diverse mammalian communities with a predominance of species with small home ranges (Meyer et al., 2015). In addition, in highly fragmented and degraded landscapes mammalian communities tend to become homogeneous, due to local and regional extinctions, where even generalist species occur in low abundances (Bovendorp et al., 2019; Knowlton et al., 2019 Phillips et al., 2017).
In fragmented landscapes, edges substantially influence the magnitude to which species use the fragments, notably affecting those species dependent on primary forests such as carnivores (Balme et al., 2010; Brodie et al., 2015; Slater et al., 2023). On the other hand, herbivorous species do not present a negative effect (Brodie et al., 2015; Kiffner et al., 2013). Concurrently, other human disturbances such as roads and human settlements negatively affect mammal occupancy (Boron et al., 2019).
Medium and large sized mammals (those that weigh more than 100 g, Medellín, 1994), are more susceptible to disappearing due to either extrinsic or intrinsic factors (Davidson et al., 2017). These mammals are important in the dynamics of forests, performing the roles of herbivory, including seed consumption and dispersal, and as top predators (Dirzo & Miranda, 1990; Lacher et al., 2019). Therefore, the loss of species and decrease in abundance of medium and large sized mammals produces severe cascading effects that impact several lower trophic levels, causing “extinction cascades” (Bovendorp et al., 2019; Garmendia et al., 2013; Michalski & Peres, 2007).
The tropical forests located in southern Mexico have been identified as priority places for the conservation of mammals (García-Marmolejo et al., 2008; Jenkins et al., 2013), due to their high diversity of species and endemism (Briones-Salas et al., 2015; Sánchez-Cordero et al., 2014). The largest fragments of mountain cloud forests and tropical rainforests in Mexico occur there (Challenger, 1998). Particularly, the forests of La Sierra Negra-Mazateca show evidence of species of conservation importance, such as jaguars (Panthera onca) and ocelots (Leopardus pardalis, Briones-Salas et al., 2015; Galindo-Aguilar et al., 2016); this locale acts as a potential corridor for them, by linking the populations of northern and southern Mexico (Cacelin-Castillo et al., 2020; Ceballos et al., 2021). However, the region presents intense processes of fragmentation and degradation (Velázquez et al., 2003). It is estimated that habitat loss rates of rainforest and mountane cloud forest between 2000 and 2016 were -2.63 % and -2.29 %, respectively and that few fragments are considered suitable to maintain ocelot populations (Galindo-Aguilar et al., 2019).
Although second growth forests, derived from human disturbance, are increasing in area around the world (Food and Agriculture Organization of the United Nations & United Nations Environmental Programme, 2020), few studies have explored changes in the presence and abundance of medium and large sized mammals, with respect to primary forests with little disturbance (e.g. Azlan, 2006; Zhang et al., 2019). In a multi-taxonomic study, Barlow et al. (2007) found group-dependent responses, with greater species richness of birds, amphibians, arachnids, butterflies, lizards, beetles and bats in primary forests than in second growth forests or plantations. However, the authors found no differences in richness in either small or large mammals. In other studies, second growth forests harbor substantial bird richness compared to other more degraded environments (Harvey et al., 2006). In small mammals, fragment size and structure complexity influenced diversity more than condition of the forest per se (da Fonseca, 1989; da Fonseca & Robinson, 1990). In medium and large sized mammals, the importance of second growth forest fragments immersed in monoculture matrices has been highlighted, favoring occupation (McShea et al., 2009; William et al., 2023). In Brazil, species composition was not different between primary and second growth forests, but there were substantial changes in abundances, particularly in herbivores and small primates that were more frequent in second growth forests (Parry et al., 2007). In central China, it was observed that richness was not different between primary, secondary or plantation forests, but changes in abundance were observed (Zhang et al., 2019). Likewise, in southern Mexico, no differences were found in species richness between palm plantations and fragments of secondary forests, but a high proportion of species showed greater abundance in the fragments, although there were no differences in average relative abundance (Knowlton et al., 2019). In Lacandona, Chiapas, it was observed that the number of mammal species is higher when forest cover is greater; in fragmented forests, species not recorded in continuous forests were found, as is the case with Cabassous centralis (Garmendia et al., 2013). In general, most studies agree on a low effect on the specific richness between primary, secondary forests or plantations, but significant changes affect the occupancy or abundance of several species.
In this context, our objective was to evaluate the influence of human disturbances on the composition and relative abundance of medium and large sized mammals, as well as on the trophic guilds that make up these communities. We wanted to test two hypotheses. First, it is postulated that there is a species-specific response of the relative abundance of medium and large mammals to the landscape condition (Garmendia et al., 2013; Michalski & Peres, 2007; Naughton-Treves et al., 2003). It is anticipated that generalist species will show greater abundance in disturbed environments, while less tolerant species will have lower abundance (Bovendorp et al., 2019). Our second hypothesis, we proposed that at the guild level, carnivores will show a negative effect on disturbed environments, due to their needs for food, shelter and large home areas (Kruuk, 2002). In contrast, it is expected that herbivores will have a positive effect on disturbed environments, by having a greater food supply in sites with secondary vegetation or agriculture (Gallegos-Peña et al., 2010).
Materials and methods
Study area: Our study was carried out in the Negra and Mazateca mountains, located in the states of Puebla and Oaxaca, respectively, in southern Mexico. The climate of this region is warm and humid with temperatures ranging between 16 and 26 °C, and it has annual rainfall of 3 000-4 500 mm (García, 1964). The main types of vegetation are humid tropical forests, mountane cloud forests and pine-oak forests, all in primary and secondary states. Land uses include seasonal and perennial agriculture, and induced grasslands for livestock raising (Instituto Nacional de Estadística, Geografía e Informática (INEGI), 2015).
The area is made up of communal lands (“ejidos”) belonging to indigenous peoples (Nahuas and Mazatecs), and includes two municipalities: San Sebastián Tlacotepec (State of Puebla, 18°14’-18°32’ N & 96°43’-96°55’ W; altitude between 60 and 1 580 m (Fig. 1), with 13 534 inhabitants distributed in 61 localities with a density of 56.9 inhabitants/km² (INEGI, 2010); and Santa María Chilchotla (State of Oaxaca, 18°10’-18°24’ N & 96°35’-96°52’ W; altitude from 0 to 2 100 m, with 20 584 inhabitants distributed in 110 localities with a density of 72.3 inhabitants/km2 (INEGI, 2010).
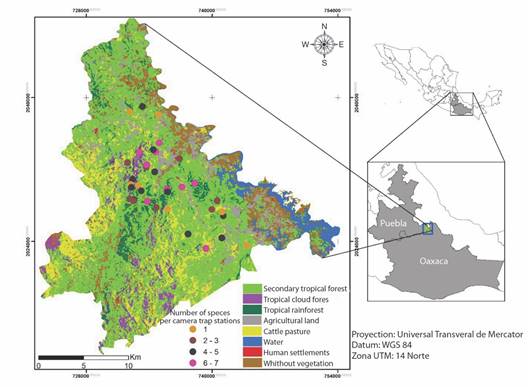
Fig. 1 Land cover in Sierra Negra-Mazateca, México, obtained through supervised classification of Landsat 8 images, and camera traps locations. The color of the camera indicates the number of species recorded.
Data collection: To determine the study area, we used GIS to create a polygon of 110 km². This size was chosen because it matches the home range required by the largest mammal potentially inhabiting the area, the jaguar (150 km² in Abra Tanchipa, SLP, Silva-Caballero, 2019). Within the polygon, we established an imaginary grid containing 18 squares of 3 km² each. In each square, we placed 2-3 camera trap stations, spaced 1-3 km² apart, during three different time periods. This sampling design meets the criteria for obtaining independent data and covering the largest possible area (Noss et al., 2013) (Table 1; Fig. 1). The cameras were in primary forests (21 stations) and in secondary forests (19 stations). The total sampling effort was 1 693 nights/trap (943 in primary forests and 750 in secondary forests) to ensure a similar number of cameras in each type of forest.
Table 1 Camera trap survey effort to document medium and large sized mammals in Sierra Negra-Mazateca, Mexico.
| Sampling periods | Days | Distance between cameras | Number of cameras | Trap days | |||
| Primary | Secondary | Primary | Secondary | ||||
| December 2013-January 2014 | 30 | 1 km | 9 | 8 | 270 | 240 | |
| April 2014 | 11-48 | 3 km | 5 | 3 | 182 | 71 | |
| July-October 2014 | 10-101 | 3 km | 7 | 8 | 491 | 439 | |
| Total | 21 | 19 | 943 | 750 | |||
The cameras were placed 3 m apart from mammal trails with spoor evidence (Aranda-Sánchez, 2012), and we secured them to a tree at 40 cm above the ground (Noss et al., 2013). We use StealthCam® Delta8 cameras model STC-Q8X / STC-D8BZ, Cuddeback® Ambush Black Flash Model 1194 and Bushnell® TrophyCam HD Essential 119736C and Covert®. We placed a single camera in 34 stations, and we placed two facing cameras in six stations. In these sites we used Obsession® CK perfume as an attractant for felids. The cameras were programmed to take photographs throughout the day and were checked monthly for maintenance and battery replacement. We used field guides to identify photographed mammals to the species level (Aranda-Sánchez, 2012; Ceballos & Oliva, 2005).
Landscape analysis: To characterize the landscape and obtain a map of land use and vegetation in the study area, a Landsat 8 (OLI-TIRS) image (Route 24 / Row 47; April 28, 2016) was analyzed with a resolution of 30 m, obtained from the Glovis platform (U.S. Geological Survey, 2016). We use infrared bands 5, 4 and 3 because their combination is more useful to discriminate between types of cover and/or vegetation (Chuvieco, 1991). The spatial resolution of the image was resampled to 15 m due to the highly fragmented landscape. Subsequently, supervised classification was performed with the maximum likelihood algorithm (Moumane et al., 2022; Zhang et al., 2022). For the resulting image, a majority filter with a 5 x 5 pixel window was applied. The processing was carried out in the ENVI 4.7 software (ITT, 2009). From the resulting land use and vegetation map, the following metrics that characterize the landscape were calculated: area of vegetation cover, percentage of vegetation cover, number of patches (NumP) and average patch area (APA). For the calculation of the last two metrics, the edge effect (100 m) was eliminated to preserve only the core area of the patches.
Data Analysis: Species richness was obtained from photographic records, both for primary and secondary forests. The trophic guilds that we used correspond to carnivores, omnivores, insectivores, frugivores, and herbivores, which were obtained following Ceballos & Oliva (2005).
Camera trapping rate was used as an index of relative abundance (Rovero & Marshall, 2009). Relative abundance indices (RAI) were calculated using the ratio of the number of independent events of each species / trap night x 1 000 (Jenks et al., 2011). As independent events, those photographic records that met the following characteristics were considered: 1) consecutive photographs of different individuals (that is, identified by spot patterns) of the same species; 2) and consecutive photographs of the same species taken > 24 hours apart (O’ Brien et al., 2003). We performed a Mann-Whitney test to determine if there were differences between the RAIs of the species and the trophic groups to which they belong between primary and secondary forests.
Sample coverage and diversity: We used coverage-based rarefaction-extrapolation sampling curves, based on standardized level of sample completeness. This approach integrates rarefaction and extrapolation of the Hill numbers in a unified standardization method for quantifying and comparing species diversity across multiple assemblages with different sampling effort (Chao & Jost 2015; Hsieh et al., 2016). Diversity was estimated with the reformulation of the Hill numbers done by Chao and Jost (2015). Hill numbers are parameterized by a diversity order q, which determines the measures’ sensitivity to species relative abundances (Hsieh et al., 2016). Here, we used q = 0, which estimate the species diversity without regard to their relative abundances of species (Chao & Jost, 2015), and can also be interpreted as a species accumulation curve (Chao et al., 2014). Estimates confidence intervals were obtained with 1 000 bootstrap iterations (Chao & Jost, 2015); to extrapolate the species diversity, we used the double of the larger sample in assemblages, and for rarefaction-extrapolation calculus we used 80 every-spaced knots (Chao et al., 2014). Calculus were done in iNext package for R (Hsieh et al., 2016).
Rank-abundance curves: Rank-abundance curves were constructed for each zone following the methodology described by Feinsinger (2001). The analyses were conducted using BiodiversityR version 2.13-1and vegan’ version 2.6-4 in R software version 4.0.2 (R Core Team, 2012).
Regression models with excess of zeros: To relate the relative abundance of the guilds with the environmental variables we used regression models with excess of zeros. These regression models have two components, the first with a binomial distribution evaluates the probability of having excesses of zeros; and the second, models the counts, using a Poisson distribution, and unlike truncated models of zeros, zeros are considered within the model, whether the species is not present or was not detected (Zuur et al., 2009). The excess of zeros in camera traps can be due to two types of factors, sampling and structural. Sampling errors (“false zeros”) may include cameras placed in habitats not used by the species (e.g. urban areas), out-of-season sampling (e.g. migratory species), and identification errors; structural errors are due to species not using a particular site in response to environmental variables (“true zeros”). In this work we ruled out sampling errors, given that the stations were arranged in habitats reported as used by the species, the sampling time was long enough to detect or not detect the species in the sites, they are not migratory species and the identification of the species can be reviewed until a consensus is reached (photographic evidence is available). The binomial part, when modeling the probability that a value of zero is observed, measures the relationship of the variables with the absence of the species in the sites. To compensate for variation in the resulting response we used sampling effort (i.e. the specific days each station operated) as an offset variable.
Environmental and human disturbance covariates: We chose human disturbance and environmental covariates that have been shown to have an effect on mammal occupancy (Cavada et al., 2019; Pardo et al., 2018): the Euclidean distance to the nearest human settlement, the Euclidean distance to the nearest road, elevation, type of cover (primary/secondary), and percentage of natural vegetation (primary/secondary) and edge density in 500 m buffers. At each camera trap station, we recorded elevation with a Garmin global positioning system and land use or vegetation cover (primary or secondary). On the other hand, using the ArcMap program, 500 m buffers were created in the land use and vegetation map for each camera-trap station (Pardo et al., 2018). In FragStat, within each buffer the percentage of primary and secondary tree cover and edge density were calculated (McGarigal & Marks, 1995). In addition, from each station, the Euclidean distance to the nearest human settlement and the distance to the nearest road were measured as variables that may have an effect on the abundance of mammals. The variables were standardized, and collinearity was evaluated with the variance inflation factors and 2 as a threshold. Additionally, we obtained correlation coefficients between covariates and when | r | > = 0.7, one of the variables was excluded. The models were made in the R environment with the car and pscl packages (R Core Team, 2012).
Results
Landscape analysis: Secondary tropical forests are the main type of vegetation cover in La Sierra Negra-Mazateca covering 48.6 % of the study area; agricultural land, cattle pastures and without vegetation cover another 37.9 %; and the primary forest occupies 9.6 % (Table 2). 1 098 tropical forest patches were identified, of which 963 patches correspond to secondary tropical forests and 135 to primary forests, of which 53 are tropical cloud forest and 82 are tropical rainforest (Table 2, Fig. 1, Fig. 2). Most patches of primary forest are found in the most remote sites, far from population centers (Fig. 1).
Table 2 Land cover types in Sierra Negra-Mazateca, Mexico.
| Land cover types | Area (km2) | Percentage | Average patch area (ha) | Number of patch |
| Secondary tropical forest | 252.98 | 48.60 | 3.08 | 963 |
| Cattle pastures | 74.11 | 14.24 | 1.50 | 248 |
| Without vegetation | 68.41 | 13.14 | 1.97 | 189 |
| Agricultural land | 53.49 | 10.28 | 1.96 | 140 |
| Tropical rainforest | 29.05 | 5.58 | 1.04 | 82 |
| Tropical cloud forest | 20.99 | 4.03 | 0.85 | 53 |
| Water | 20.06 | 3.85 | 12.27 | 37 |
| Human settlements | 1.48 | 0.28 | ||
| Total | 520.57 | 100 | 22.67 | 1 712 |
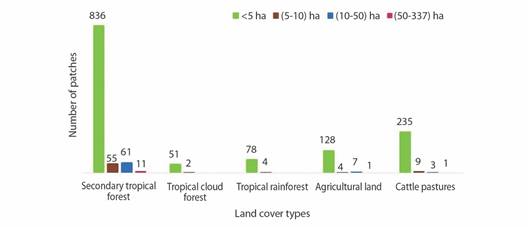
Fig. 2 Patch size per land cover types in Sierra Negra-Mazateca, México. The color indicates the size of the patches.
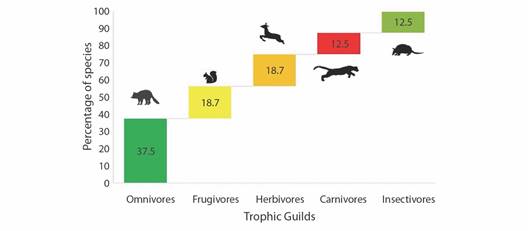
Community composition of medium and large mammals: We obtained 497 independent events from 16 species of medium and large mammals, distributed in 13 families and six orders. Regarding the total number of species, the order Carnivora was the best represented (37.5 %), followed by Rodentia (18.7 %; Table 3). Five trophic guilds were observed, the omnivores were the ones that occurred in the highest proportion (37.5 %) and the insectivores and carnivores in the lowest proportion (12.5 %) (Fig. 3). In the primary forest patches all species were recorded, while in the secondary forest patches, Coyote (Canis latrans) and Northern tamandua (Tamandua mexicana) were not recorded. The largest carnivore recorded was the Ocelot (Leopardus pardalis) and of the herbivores, the Collared peccary (Dicotyles crassus) and the American red brocket (Mazama temama). Most species were more frequent in the primary forests, although the Nine banded armadillo and American red brocket were more frequent in secondary tropical forest.
Table 3 Detected species, guild, and Relative Abundance Index (RAI) of medium and large mammals in Sierra Negra-Mazateca, México.
| Orden Scientific name | Common name | Guild | EI TR | RAI TR | EI STF | RAI STF | EI total | RAI Total |
| Didelphimorphia | ||||||||
| Didelphis spp. | Opossum | O | 16 | 17 | 3 | 4 | 19 | 11.2 |
| Philander opossum | Gray four-eyed opossum | O | 7 | 7.4 | 7 | 9.3 | 14 | 8.2 |
| Cingulata | ||||||||
| Dasypus novemcinctus | Nine banded armadillo | I | 3 | 3.2 | 21 | 28 | 24 | 14.2 |
| Pilosa | ||||||||
| Tamandua mexicana a | Northern tamandua | I | 2 | 2.1 | 0 | 0.0 | 2 | 1.2 |
| Rodentia | ||||||||
| Sciurus aureogaster | Mexican gray squirrel | F | 18 | 19 | 3 | 4 | 21 | 12.4 |
| Cuniculus paca | Spotted paca | F | 32 | 34 | 28 | 37.3 | 60 | 35.4 |
| Dasyprocta mexicana | Mexican aguti | F | 160 | 170 | 63 | 84 | 223 | 132.0 |
| Lagomorpha | ||||||||
| Sylvilagus spp. | Cottontail | H | 2 | 2.12 | 1 | 1.3 | 3 | 1.8 |
| Carnivora | ||||||||
| Canis latrans | Coyote | O | 1 | 1.1 | 0 | 0.0 | 1 | 0.6 |
| Leopardus pardalis | Ocelot | C | 18 | 19.1 | 4 | 5.3 | 22 | 13 |
| Leopardus wiedii | Margay | C | 1 | 5.1 | 1 | 1.8 | 2 | 1.1 |
| Conepatus semistriatus | Striped hog-nosed skunk | O | 12 | 13 | 13 | 17.3 | 25 | 14.8 |
| Nasua narica | White-nosed coati | O | 41 | 43.5 | 7 | 9.3 | 48 | 28.4 |
| Procyon lotor | Northern raccoon | O | 5 | 5.3 | 1 | 1.3 | 6 | 3.6 |
| Artiodactyla | ||||||||
| Dicotyles crassus | Collared peccary | H | 10 | 10.6 | 4 | 5.3 | 14 | 8.3 |
| Mazama temama | Central American red brocket | H | 3 | 3.2 | 10 | 13.3 | 13 | 7.7 |
| Total | Total | 331 | 166 | 497 |
Independent events (EI). Trophic guild: C, carnivore; F, frugivore; H, herbivore; I, insectivore; Or, omnivore. Tropical rainforest (BT) and Secondary tropical forest (STF). / a Excluded from zero-inflated models due to their arboreal habits.
Relative abundance: The species with the highest relative abundance was the Mexican aguti (Dasyprocta mexicana), both in secondary and primary forests (RAI = 84 and 170, respectively). The Coyote was the least detected species in primary forests (RAI = 1.1) and Cottontail (Sylvilagus spp.), Margay (Leopardus wiedii) and Northern raccoon (P. lotor) in secondary forests (RAI = 1.3, Table 3). No significant statistical differences were found in the RAI for mammals between primary and secondary forests (U = 260.0, T = 329.0, p = 0.104). However, within the trophic guilds we found significant differences for omnivores (U = 298.0, T= 291.0, p = 0.006) and carnivores (U = 275.0, T= 314.0, p = 0.019), but neither for frugivores (U = 219.0, T = 370.0, p = 0.605) or herbivores (U = 207.0, T = 382.0, p = 0.820).
Sample coverage and diversity: Sample completeness was high for the forest types and conditions (Fig. 4). We found that the estimated species diversity was slightly higher in primary forests (q0= 16.86 effective species, CI 11.73-22.00) than in secondary forests (q0 = 15.89 effective species, CI 10.50-21.28) (Fig. 5). In rainforests, the difference was more noticeable, with greater diversity in primary than secondary fragments (primary 15.04, CI 5.92-24.17; secondary 9.85, CI 6.59-13.10) (Fig. 6A), than in the cloud forests (primary 14.12, CI 8.17-20.08; secondary 16.91, CI 7.94-25.88) (Fig. 6B).
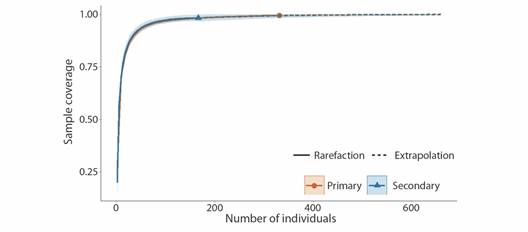
Fig. 4 Curve of the sample completeness of mammals recorded in primary and secondary forests in Sierra Negra-Mazateca, Mexico.
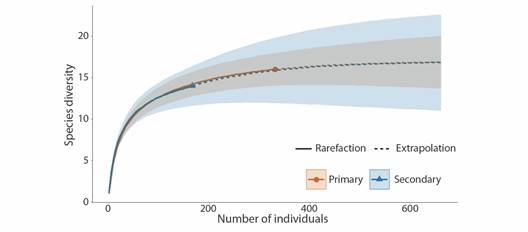
Fig. 5 Curve of rarefaction and extrapolation of mammals recorded primary and secondary forests in Sierra Negra-Mazateca, Mexico.
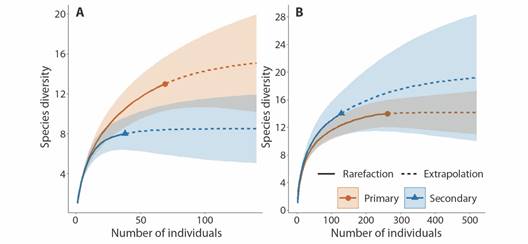
Fig. 6 Curve of rarefaction and extrapolation of mammals recorded in A. primary and secondary cloud forest and B. tropical rainforest in Sierra Negra-Mazateca, Mexico.
Rank-abundance curves: The rank-abundance curves revealed that the dominant species in both primary and secondary forests are similar, whereas the rare species differ; L. wiedii in conserved forests, whereas Sylvilagus in disturbed forests (Fig. 7).
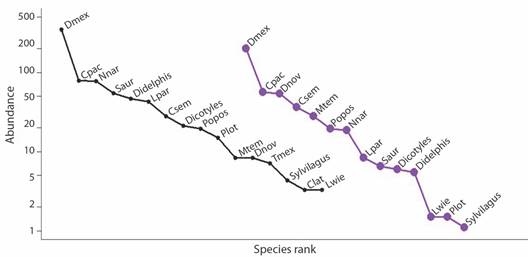
Fig. 7 Curve of rank-abundance of mammals recorded in primary forest (black line) and secondary forest (purple line) in Sierra Negra-Mazateca, Mexico. Dmex = Dasyprocta mexicana, Cpac = Cuniculis paca, Plot = Procyon lotor, Sylvilagus, Mtem = Mazama temama, Dnov = Dasypus novemcinctus, Lpar = Leopardus pardalis, Cla t= Canis latrans, Nnar = Nasua narica, Popos = Philander opossum, Saur = Sciurus aureogaster, Lwie = Leopardus wiedii, Csem = Conepatus semistriatus, Tmex = Tamandua mexicana.
Relationship between mammals and guilds with environmental and human disturbance variables: The two zero-inflated models showed that no variable explained the presence and abundance of the species. The unions showed that some variables had a negative relationship; for example, carnivores with elevation (β = -0.739, p = 0.0003) and secondary cover (β = -1.756, p = 0.0012); omnivores with elevation (β = -1.152, p = 0.000254), secondary cover (β = -2.428, p = 0.000341), edge density (β = -2.84, p = 0.001362); herbivores had a negative relationship with elevation (β = -1.112, p = 0.0207). Omnivores also had a positive relationship with the distance to rivers (β = 1.652, p = 0.00072), and the percentage of tree cover (β = 2.31, p = 0.001796, Table 4). In the case of insectivores, there were limited data available to conduct analyses within this guild.
Table 4 Zero-inflated count component model for guilds in Sierra Negra-Mazateca, México.
| Guild | Estimate | Std.Error | Z value | p |
| Carnivores | ||||
| (Intercept) | -0.1232 | 0.2549 | -0.483 | 0.629 |
| elevation | -0.7393 | 0.2045 | -3.615 | < 0.005 |
| secondary cover | -1.7569 | 0.5457 | -3.22 | < 0.005 |
| Omnivores | ||||
| (Intercept) | 2.0698 | 0.3326 | 6.223 | < 0.005 |
| elevation | -1.1526 | 0.3151 | -3.658 | < 0.005 |
| distance to rivers | 1.6523 | 0.4886 | 3.382 | < 0.005 |
| secondary cover | -2.8406 | 0.7929 | -3.582 | < 0.005 |
| percentage of tree cover | 2.3109 | 0.7402 | 3.122 | < 0.005 |
| edge density | -2.4285 | 0.7583 | -3.203 | < 0.005 |
| Herbivores | ||||
| (Intercept) | -0.4305 | 0.3232 | -1.332 | 0.183 |
| elevation | -1.1127 | 0.4808 | -2.314 | 0.021 |
Discussion
In this study we explore the effect of human disturbances on medium and large mammal communities in tropical forests. Unlike what we expected, the richness and composition of species between secondary and primary forests in La Sierra Negra-Mazateca was similar; likewise, the relative abundance indices did not present significant differences between forests. Regarding species richness, a similar finding was reported in forests of central China, where in primary forests, secondary forests and plantations, richness varied by only one species. However, in this region there were notable differences in relative abundances, with high values in primary forests (Zhang et al., 2019).
Considering the RAI values in Sierra Negra-Mazateca, we can observe that the species that tolerate human presence (e.g., the American red brocket and Nine-banded armadillo Dasypus novemcinctus (Newman, 1913; Salazar-Ortiz et al., 2022) have higher values than species that are less tolerant and require a larger home range (e.g., Dicotyles crassus). Although the species recorded here, such as Ocelot or Collared peccary, had higher RAI in primary forests than in secondary forests, these values were notably lower compared to other tropical forests (Lira-Torres & Briones-Salas, 2012; Muench & Martínez-Ramos, 2016). It is possible that there is overexploitation of the species, since many of them are captured for different purposes, such as preventing and reducing damage to crops, for food, trade, ornament, traditional medicine or because people consider them to have magical-religious attributes (Galindo-Aguilar, 2015). It has been observed in various forests that hunting has direct negative effects on the survival of mammals (Cullen et al. 2000; Peres, 1997).
In contrast, we found that the Nine-banded armadillo and American red brocket, two of the main prey of large and medium-sized carnivores, had a higher abundance index in secondary forests than in primary forests. One of the reasons is the tolerance that these species have to human activities and that, in addition, secondary forests provide abundant food for herbivores, through fast-growing plants (Naughton-Treves et al., 2003; Zapata-Ríos et al., 2006). On the other hand, the Mexican aguti had a greater abundance in primary forests, a result similar to the tropical forests of Los Chimalapas, Oaxaca, where this species used secondary forests to a lesser extent (Lira-Torres & Briones-Salas, 2012), this finding confirms the importance of primary forests for mammals.
At the guild level, not only carnivores showed a negative effect to the disturbance, but also omnivores, but this was not the case for herbivores, as we had predicted. Carnivores had a negative relationship with secondary cover, that is, they prefer conserved or primary vegetation environments (Ferreira et al., 2018; Ferreira et al., 2020; Graham et al., 2019). On the other hand, they had a negative relationship with elevation, this means that sites with lower elevation have a greater abundance of carnivores. In the region, low-altitude areas present a mosaic of primary and secondary forests, in addition to livestock and crop areas, therefore, these sites can be ideal for carnivores to hunt their prey. It has been documented that vegetation structure is an important variable for capture success (Watine et al., 2022). In this case, agroforestry systems can offer better visibility to predators. Another possible reason are that the prey of carnivores is usually found in these modified habitats: Nasua narica (White-nosed coati), Cuniculus paca (Spotted paca), Mexican aguti, Collared peccary, American red brocket, since they feed on corn and beans from the milpa (Magioli et al., 2019).
The abundance of omnivores was related to more variables, preferring low altitude and conserved areas (primary cover zones) and lower edge density. In such a fragmented region, it is possible that the primary forest is playing an important role in the survival of this guild, since although they are generalist species, they require primary forest; they may also be playing a key functional role as seed dispersers for forest conservation (Ferreira et al., 2020; Magioli et al., 2021).
Herbivores had a negative relationship with elevation; it is possible that in low-altitude areas where there are more crops, they are taking advantage of these resources by feeding on bean crops, as well as on the growing plants that occur in the acahuales (it is a stage of ecological succession in tropical forests, typically vegetation that grows in an area abandoned for agricultural land use), however conserved forests continue to be a necessary element for them to remain present (Bodmer, 1989; Salazar-Ortiz et al., 2022).
The Sierra Negra-Mazateca has experienced processes of deforestation and, mainly, continuous degradation since the 1980s (Velázquez et al., 2003). This work allowed us to see that these processes are still present, where 60 % of the vegetation cover of these mountains is forest, but only 10 % is primary, the rest is secondary in different stages of succession. Although secondary vegetation functions as habitat for different species, they are not a substitute for primary forests (Gibson et al., 2011; Mendenhall et al., 2016). In the area, a mosaic of primary and secondary vegetation was observed, with patches so small that they seem incapable of hosting populations of some species of medium and large mammals (Mendoza et al., 2005; Michalski & Peres, 2007).
The number of species we recorded (16) represents a little more than a third (38 %) of the mammals that were historically found in the region (Briones-Salas et al., 2015). The absence of species, both large and medium-sized, suggests that the area is experiencing a defaunation process, similar to that observed in other tropical forests (Flores et al., 2014; Ortiz-Lozada et al., 2017). Studies with camera traps show a greater number of species, for example, in the Chimalapas and La Selva Lacandona, 20 and 18 medium- and large-sized species were detected, respectively, including three globally threatened species: jaguar (Panthera onca), tapir (Tapirus bairdii) and White-lipped peccary (Tayassu pecari) (Garmendia et al., 2013; Lira-Torres & Briones-Salas, 2012). Among the medium-sized threatened species not recorded in the Sierra Negra-Mazateca, but with historical distribution are Derby’s woolly opossum (Caluromys derbianus), Jaguarundi (Puma yagouaroundi), Greater grison (Galictis vittata) and Tayra (Eira barbara; Lavariega et al., 2017). We also did not record large species such as Puma (Puma concolor), White-tailed deer (Odocoileus virginianus) and jaguar. In the case of the jaguar, not only the transformation of the landscape contributed to its extirpation, according to the interviews that were carried out in the region, the jaguar was persecuted until it was eliminated (Galindo-Aguilar, 2015).
Although well-conserved protected patches could support a significant proportion of wildlife, they are generally insufficient to maintain long-term populations of most large mammals (Mendoza et al., 2005; Ortiz-Lozada et al., 2017). Therefore, connectivity through vegetation restoration should be a necessary measure to contain species and ecological services in La Sierra Negra-Mazateca (Hansen et al., 2020; Knowlton et al., 2019). In addition, awareness-raising work must be proposed and real opportunities generated with the rural communities where the potential corridors are located so that ecological connectivity can be effective. It is urgent to work multidisciplinary and together with local inhabitants, academic institutions, private initiative and the government, generating alternatives for the effective restoration and conservation of tropical forests.
Ethical statement: The authors declare that they all agree with this publication and made significant contributions; that there is no conflict of interest of any kind; and that we followed all pertinent ethical and legal procedures and requirements. All financial sources are fully and clearly stated in the acknowledgments section. A signed document has been filed in the journal archives.

