




 Inglês (pdf)
 Artigo em XML
 Referências do artigo

 Tradução automática
 Enviar este artigo por email
 Citado por SciELO
 Similares em
SciELO
 uBio

 Permalink


Introduction
Long-term (e.g., > 10 yr) studies on patterns of occurrence of jaguars (Panthera onca, Linnaeus, 1758) and other large predators (e.g., pumas Puma concolor, Linnaeus, 1771) in undisturbed lowland forest are not common (Harmsen et al., 2017). Yet, such studies are useful for evaluating the conservation potential of protected (and unprotected) regions. Given that jaguars and pumas are the largest terrestrial predators that coexist in lowland forests of the Neotropics, their continued presence may serve as an indication of the health of the forest (Espinosa et al., 2018; Terborgh 1988). If large predators are present in good numbers, there are likely to be plenty of prey, for example. Reduced numbers of jaguars may reflect the impacts of human activities (e.g., hunting) on preferred prey items, such as peccaries, deer, agoutis, armadillos, and others, rather than a consequence of direct hunting by humans, although killings of jaguars do occur (Espinosa et al., 2018; D. Mosquera, personal observation).
Most studies of jaguars are conducted over large areas given the large home ranges typical of large predators (Gonzalez-Borrajo et al., 2016; Harmsen et al., 2020; Maffei et al., 2004; Silver et al., 2004). Yet, most studies are relatively short in duration (“snapshot surveys”; Harmsen et al., 2017), which may not provide a good indication of population patterns. Although home ranges of male and female jaguars are known to overlap (e.g., Gonzalez-Borrajo et al., 2016; Harmsen et al., 2017; Soisalo & Cavalcanti, 2006), we know relatively little about the extent of temporal and spatial overlap of individual jaguars at more local scales (Blake et al., 2014; Emmons, 1987; Harmsen et al., 2009). With overlapping home ranges, many jaguars and pumas may use the same areas of forest (e.g., Gonzalez-Borrajo et al., 2016; Harmsen et al., 2009; Harmsen et al., 2017; Scognamillo et al., 2003; Soisalo & Cavalcanti, 2006). However, individuals may use the same areas but at different times (e.g., transients vs. permanent residents; Harmsen et al., 2017) without necessarily encountering one another, although that is possible (Emmons, 1987).
Jaguars and pumas occur in a wide variety of habitats (Gonzalez-Borrajo et al., 2016) although pumas have a much greater geographic range. In tropical regions, for example, jaguars occur in habitats as diverse as grasslands, dry forests (Kelly 2003; Maffei et al., 2004; Scognamillo et al., 2003; Soisalo & Cavalcanti, 2006), and lowland wet forests (Espinosa et al., 2018; Harmsen et al., 2017; Harmsen et al., 2020; Silver et al., 2004; Tobler et al., 2013; Wallace et al., 2003). Although lowland Amazonian forests are among the most important habitats for jaguars (Tobler et al., 2013), there have been relatively few studies on jaguars (or pumas) in such habitats (Gonzalez-Borrajo et al., 2016).
Previously (Blake et al., 2014), we reported on temporal and spatial patterns of occurrence and activity of jaguars at Tiputini Biodiversity Station (TBS), Ecuador. Located in lowland Amazonian forest of Eastern Ecuador, TBS is situated in the midst of extensive, relatively undisturbed forest, in one of the most biodiverse regions in the world (Bass et al., 2010). The station and surroundings have experienced very little disturbance, except around the main buildings, and human activity has apparently had relatively little impact on animal activity (Blake & Mosquera, 2014; Blake, Mosquera & Salvador, 2012). The station area is characterized by an intact fauna, with all top predators (e.g., jaguar, puma, ocelot Leopardus pardalis Linnaeus, 1758, harpy eagle Harpia harpyja¸Linnaeus, 1758) and prey (e.g., collared peccaries Dicotyles tajacu, Linnaeus, 1758, white-lipped peccaries Tayassu pecari, Link 1795; red brocket deer Mazama americana, Erxleben, 1777; black agoutis Dasyprocta fuliginosa, Wagler, 1832; and others) present; most are frequently observed and/or captured in camera-trap images (Blake, Mosquera, Loiselle et al., 2012; Blake et al., 2014; Blake et al., 2016). Nonetheless, the station and its surroundings are likely subjected to external influences, such as caused by climate change. For example, substantial declines in bird populations over the last decade (Blake & Loiselle, 2024), in the absence of habitat change, suggest that external forces have had an impact. Similarly, prey populations may exhibit changes in abundance that could influence predator populations (Espinosa et al., 2018; Fragoso et al., 2022). White-lipped peccaries, for example, have apparently mostly disappeared from the station area based on data from camera traps, with few if any images since 2021 (J. G. Blake, unpublished data; see Fragoso et al., 2022).
Our first study was based on camera-trap images collected over an 8-yr sample period (Blake et al., 2014). Here, we reexamine presence/activity of jaguars at the station over 10 additional years (i.e., ~20 years combined across the two study periods, 2005-2012, 2014-2023, longer than most studies on jaguars (Harmsen et al., 2017), to determine (1) whether occurrence (e.g., capture rate), (2) daily activity patterns (e.g., nocturnal vs diurnal), and (3) presence and number of individuals of jaguars have changed over time. Given that jaguars and pumas are the two largest predators in lowland tropical forest (Gonzalez-Borrajo et al., 2016) and can overlap in diet and temporal/spatial occurrence (Harmsen et al., 2009; Harmsen et al., 2011; Romero-Muñoz et al., 2010), we compare capture rates and activity between the two species. Unlike jaguars, however, we do not attempt to identify individual pumas given their relative lack of distinguishing marks, although some are identifiable based on scars, bot-fly infestations, or other marks (Kelly et al., 2008; Romero-Muñoz et al., 2010). There have not been any significant changes in levels of human activity at or near the station over the past two decades so we predicted that there would be little change in occurrence or activity. As in our previous study (Blake et al., 2014), we emphasize that we are not attempting to estimate density of jaguars; our study area is much too small to allow for such estimates (Harmsen et al., 2020). Rather, we focus on the extent to which large cats use the same small area of forest across multiple years.
Materials and methods
Study area: Research was conducted at Tiputini Biodiversity Station (TBS), Orellana Province, Ecuador (0°37’ S & 76°10’ W, 190-270 m.a.s.l.). TBS is located on the North side of the Tiputini River, adjacent to Yasuní National Park on a tract (~670 ha) of largely undisturbed lowland rain forest within the biologically diverse Yasuní Biosphere Reserve (Bass et al., 2010). The station and nearby areas are dominated by terra firme forest; várzea forest, palm swamps, and various successional habitats also are present. Additional descriptions of the forest composition in the Yasuní region can be found in Pitman et al. (2001) y Pitman et al. (2002). Mean annual precipitation at Yasuní Research Station, approximately 30 km WSW of TBS, is about 3 100 mm.
Camera traps: We used cameras triggered by an infrared heat-and-motion detector to capture images of jaguars (and other large mammals and birds), starting in 2005. Here, our main focus is on images collected at ten locations during January to March from 2014 through 2023, to complement records from 2005 to 2012 (see Blake et al., 2014 for details of the previous sampling activity). Data from the previous study are included when appropriate for comparison. Pairs of cameras were located approximately 1-1.2 km apart along narrow (< 0.5 m) preexisting trails within terra firme forest (see map in Blake et al., 2016). Two cameras were placed at each location, on opposite sides of the trail, approximately 0.5-0.75 m off the ground, with the goal of ensuring that both sides of jaguar individuals were photographed. Jaguar coat patterns differ by side so having images of both sides improves chances for individual identification. Vegetation was cleared immediately in front of each camera, but locations were not otherwise disturbed; no attractants were used. Cameras remained continuously activated (except when malfunctions occurred); date and time were automatically stamped on each image. Cameras were set to record five images when the sensors were activated with a minimum 5-min break between successive triggers.
The previous study (Blake et al., 2014) was based on results from a combination of filmbased (Highlander Photoscout, PTC Technologies, Huntsville, Alabama; 2005-2008) and digital camera traps (Cuddeback Capture, Cuddeback, Green Bay, Wisconsin 2010-2012). The current study is based on Reconyx Hyperfire cameras (Reconyx, Holmen, Wisconsin). According to manufacturers’ information, all cameras had similar reaction times of ~ 0.2-0.5 sec. Based on video records of jaguars and pumas walking along the trails, it is clear that they walk relatively slowly, and all camera models should, therefore, be able to capture their images. This is further supported by the fact that multiple images are obtained for each event.
In addition to images captured by cameras located along trails, other images were captured by cameras located on two 100 ha study plots (Blake & Loiselle, 2018) and at four mineral licks (saladeros). Two licks were within the station boundaries but not along trails and two were located near (2 to ~5 km) but outside the station boundaries south of the Tiputini River. Further, separate cameras captured video records of jaguars along trails on the station. We use images from these additional sites in analyses that focus on daily activity patterns and to document presence in the study area (e.g., number of months over which an individual occurred within the study area) but do not use them for analyses based on capture rates. All capture-rate analyses for the current study are based on cameras located at the ten sites sampled in each year; capture rate data from the earlier study (Blake et al., 2014) were based on nine to twelve sites from each year, including the locations used in the present study.
Analyses: We summarized images by species (and individuals of jaguars, identified, when possible, by the distinctive patterns on coats), location, date, and time. We classified images as belonging to independent records if more than 30 min had elapsed between consecutive photographs of the same species at the same location (Datta et al., 2008; O’Brien et al., 2003). Activity was evaluated in terms of the number of independent images / 100 trap-days (hereafter referred to as capture rates; i.e., captures of images). Previous studies have demonstrated that capture rates can reflect changes in actual abundance (Carbone et al., 2001; Kuprewicz, 2012; Rovero & Marshall, 2009) but we do not claim that capture rates are necessarily an accurate indication of changes in actual abundance. We calculated number of trap days from the time the camera was placed in operation until it was removed or, if malfunctions occurred (e.g., batteries failed), until the last image was recorded (based on date and time stamps on the image). We combined records within a year. We classified records by two-hour blocks, starting at midnight, to examine hourly patterns of activity (e.g., 0200 h would include records from 0001 h to 0200 h).
We used correlation analyses to compare capture rates, hourly activity patterns, and spatial distribution patterns between jaguars and pumas. Similarly, we used correlation analyses to examine capture rates over time (years). We further used linear regression to examine the change in capture rates from 2005 to 2023. Two-sample t-tests were used to compare capture rates between the first (2005-2012) and second (2014-2023) sample periods for both jaguars and pumas. We used paired t-tests to compare capture rates of jaguars and pumas over time, from 2005 to 2023, and to compare numbers of images at different locations. We used chi-square tests to compare the distribution of numbers of months individual jaguars were present between the first and second sample periods and to compare diurnal vs nocturnal records for both species. All statistical analyses were run with Statistix 10.0 (Analytical Software, 2013) except for the analyses of overlap described below.
To further evaluate hourly activity patterns between the two species, we estimated the coefficient of overlapping Δ (Ridout & Linkie, 2009) using package overlap in R (Meredith & Ridout, 2014; R Core Team, 2024). This coefficient provides a descriptive measure of the similarity in two Kernel density curves and ranges from Δ = 0 (no overlap; different activity patterns) to Δ = 1 (complete overlap; identical activity patterns). We used the estimator Δ^1 when sample sizes for jaguar and puma were less than 50 and Δ^4 when sample sizes were greater. Confidence intervals (95 %) for the overlap estimator were calculated using bootstrap resampling of the data set of detections of each species with 999 iterations, recalculating Δ each time (Ridout & Linkie, 2009). To evaluate whether the pairs of activity patterns were significantly different, we used the compareCkern function in the package activity (Rowcliffe, 2023) in R. This function is a randomization test to determine if two sets of circular observations differ from each other (Lee et al., 2024).
Results
Capture rates: Cameras along trails (n = 10 sites) captured 65 independent images of jaguars and 91 of pumas. Capture rates from 2014 to 2023 (Table 1, Fig. 1) varied from 0.0 to 2.94 images/100 trap days for jaguars and from 0.46 to 4.88 for pumas. The high value (4.88) for pumas was from 2016 when more than twice as many images were recorded compared to other years. Across all years, from 2005 to 2023 (Fig. 1), mean capture rates were 1.20 (SE = 0.20, CV = 65.1) for jaguars and 1.25 (SE = 0.29, CV = 93.9) for pumas and did not differ between species (paired t-test, t = 0.17, d.f. = 15, p = 0.87). Mean capture rates of jaguars did not differ between the first set of samples (2005-2012, 0.97, 0.23 SE) and the second (2014-2023, 1.38, 0.30 SE; t = 1.03, d.f. = 14, p = 0.32, variances not different, F 8,6 = 2.13, p = 0.19). In contrast, capture rates of pumas were significantly higher during the second period (0.55, 0.07 SE and 1.80, 0.45 SE; t = 2.76, d.f. = 8.4, p < 0.05, unequal variances F 8,6 = 49.3, p < 0.001).
Table 1 Summary of sampling effort by year; cameras operating Jan-March. Number of sites, total number of trap nights, total number of independent photos, number of identified individual jaguars, and capture rates.
| Year | Sites | Trap nights | Jaguars | Pumas | ||||
| Images | Individuals | Rate | Images | Rate | ||||
| 2014 | 10 | 652 | 0 (4) | 0 (4) | 0.00 | 3 | 0.46 | |
| 2015 | 10 | 529 | 4 (13) | 2 (5) | 0.95 | 3 | 0.57 | |
| 2016 | 10 | 594 | 6 (18) | 3 (7) | 1.01 | 29 | 4.88 | |
| 2017 | 10 | 557 | 4 (8) | 1 (3) | 0.72 | 11 | 1.97 | |
| 2018 | 10 | 623 | 12 (28) | 5 (9) | 1.93 | 8 | 1.61 | |
| 2019 | 10 | 562 | 6 (9) | 3 (5) | 1.07 | 13 | 2.31 | |
| 2020 | 10 | 578 | 16 (24) | 7 (8) | 2.94 | 13 | 2.25 | |
| 2022 | 10 | 447 | 8 | 3 | 1.79 | 6 | 1.34 | |
| 2023 | 10 | 558 | 9 | 4 | 1.61 | 5 | 0.90 | |
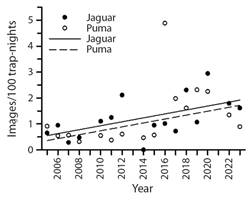
Fig. 1 Capture rates (independent images) for jaguars and pumas at Tiputini Biodiversity Station, Ecuador, from 2005 to 2023. Regression lines were based on data with 2016 excluded (see text).
Number of images and number of individuals of identified jaguars are given first for cameras located along trails (i.e., those used to calculate capture rates) and for all camera locations, in parentheses, including those not on trails.
Regression analyses (Fig. 1) indicated that capture rates increased for both species, although the rate of increase was not great (slope = 0.074, 0.03 SE, p < 0.05 for jaguars; slope = 0.091, 0.049 SE, p = 0.086 for pumas). When data from 2016 was omitted because of the unusual number of records for pumas, the rates of increase were similar and significant for both species (slope = 0.076, 0.031 SE for jaguars; 0.075, 0.025 SE for pumas; p < 0.05 for both species. Capture rates of jaguars and pumas were not correlated across years (r = 0.23, p = 0.40).
Individual jaguars: Including images from cameras not located along the main trails, there were 121 independent records of jaguars (Table 1) that represented 28 individuals (plus four photographs that could not be assigned to a specific individual), including 18 males and seven females; 12 images of at least three individuals could not be assigned to a sex (Table 2). One male was melanistic. Number of photographs per individual jaguar ranged from one or two (12 individuals) to 12 or 13 (3 individuals, Table 2). Capture periods (number of months from first to last photograph of an individual) ranged from one to three months (i.e., all within a one-year sample, 15 individuals) to 36 or more (i.e., over a ≥ 3-year period, eight individuals) from 2014 to 2023 (Fig. 2). Five males and two females were recorded over a period of at least 36 months; these two females were present at TBS for at least 72 and 84 months (Table 2). The distribution of individuals across different numbers of months did not differ between 2005-2012 and 2014-2023 (Fig. 2, χ 2 = 0.83, d.f. = 4, p = 0.94).
Table 2 Occurrences of 28 individually identified jaguars at Tiputini Biodiversity Station, Ecuador, from 2014 through 2023.
| ID | Sex1 | Number of Photos | Number of Trap Sites2 | Number of Months3 | First Month | Last Month |
| 14 | M | 2 | 2 | 36 | 2/2012 | 2/2015 |
| 2 | M | 5 | 3 | 13 | 1/2022 | 2/2023 |
| 35 | F | 6 | 6 | 72 | 2/2014 | 2/2020 |
| 46 | M | 5 | 4 | 2 | 1/2022 | 2/2022 |
| 55 | M | 13 | 10 | 36 | 3/2014 | 3/2016 |
| 6 | M | 2 | 2 | 1 | 1/2022 | 1/2022 |
| 74 | F | 2 | 3 | 84 | 2/2010 | 2/2016 |
| 8 | M | 1 | 1 | 1 | 1/2023 | |
| 95 | M | 5 | 4 | 1 | 2/2017 | 3/2017 |
| 10 | F | 1 | 1 | 1 | 1/2023 | |
| 11 | M | 1 | 1 | 1 | 1/2018 | |
| 125,7 | M | 7 | 5 | 48 | 3/2016 | 3/2020 |
| 135,7 | M | 13 | 6 | 12 | 2/2018 | 2/2019 |
| 145,7 | F | 12 | 7 | 24 | 2/2018 | 2/2020 |
| 155,7 | M | 3 | 2 | 2 | 1/2018 | 2/2018 |
| 165 | F | 2 | 2 | 1 | 1/2016 | |
| 175 | M | 5 | 4 | 12 | 1/2019 | 1/2020 |
| 185,7 | M | 3 | 3 | 12 | 1/2017 | 1/2018 |
| 195 | F | 1 | 1 | 1 | 2/2017 | |
| 205 | M | 4 | 3 | 55 | 2/2014 | 9/2018 |
| 215 | M | 5 | 5 | 24 | 2/2014 | 2/2016 |
| 225 | M | 1 | 1 | 1 | 2/2016 | |
| 235,7 | ? | 3 | 2 | 2 | 1/2018 | 3/2018 |
| 24 | ? | 1 | 1 | 1 | 1/2019 | |
| 25 | ? | 2 | 2 | 1 | 1/2020 | |
| 265 | F | 2 | 2 | 3 | 1/2020 | 4/2020 |
| 27 | M | 5 | 2 | 2 | 1/2020 | 3/2020 |
| 285 | M | 5 | 4 | 54 | 9/2018 | 2/2023 |
Does not include 4 images that could not be assigned to an individual, typically because only a small part of the animal was visible. Number of photos refers to images separated by at least 30 min and/or at a different trap site. Trap sites include those regularly used along trails as well as extras (see text). / 1M = male; F = Female; ? = Unknown. / 2Number of distinct locations, including cameras located along trails, on plots, and at other locations in the Tiputini area, including sites across the Tiputini River. / 3Number of months from first to last image. / 4Also photographed in period covered by Blake et al. (2014). / 5Includes photos from extra locations, not long-term sites along trails. / 6Melanistic individual. / 7Includes photos from extra locations on the south side of the Tiputini River.
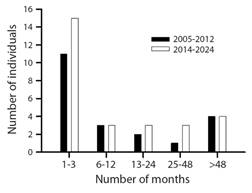
Fig. 2 Numbers of months individual jaguars were recorded at or near Tiputini Biodiversity Station, Ecuador, during two different study periods.
Diurnal activity patterns: Jaguars were primarily active during daylight hours (06:00-18:00, 77 % of photographs with all years combined) whereas pumas were most active at night (18:00-06:00, 65 %) (Fig. 3). Number of nocturnal vs diurnal records differed significantly between species (χ 2 = 42.1, d.f. = 1, p < 0.001). Number of records per 2-hour blocks were negatively correlated between jaguars and pumas (r = -0.61, p < 0.05). Results were similar when compared across 1-hour blocks (r = -0.49, p < 0.05). The coefficient of overlapping (Δ) indicated some overlap in activity between the two species (Δ^4 = 0.59, 0.49-0.70, 95 % CI) with data from all years combined but the activity patterns were, based on the compareCkern function, significantly different (p < 0.001). Both species increased diurnal activity somewhat from the first period (2005-2012, jaguars 68 % diurnal, pumas 27 %) to the second period (2014-2023, jaguars 82 %, pumas 39 %) but the change in the distribution of diurnal vs nocturnal records was not significant for either species (jaguar: χ 2 = 2.88, d.f. = 1, p = 0.09; puma: χ 2 = 1.28, d.f. = 1, p = 0.26). Similarly, the number of nocturnal and diurnal records still differed significantly between species (2005-2012, χ 2 = 10.91, d.f. = 1, p < 0.001; 2014-2023, χ 2 = 31.6, d.f. = 1, p < 0.001). Coefficients of overlapping were similar during the first and second periods (Δ^1 = 0.58, 0.40-0.74 CI and Δ^4 = 0.55, 0.43-0.67 CI, respectively). In both periods, the activity patterns were significantly different between jaguars and pumas (p < 0.002 and p < 0.001, for the two periods respectively).
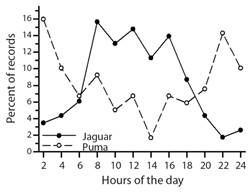
Fig. 3 Hourly activity (2-hour periods) of jaguars and pumas at Tiputini Biodiversity Station, Ecuador, from 2014 to 2023.
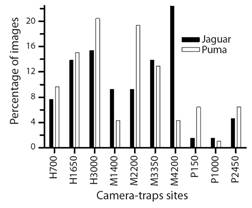
Spatial patterns: Number of images per camera-trap site (n = 10) ranged from one to 15 for jaguars and from one to 19 for pumas (Fig. 4) but number of images per site did not differ between species (paired t-test, t = 1.41, d.f. = 9, p = 0.19). Number of images per trap site was not correlated between jaguars and pumas (r = 0.33, p = 0.35) indicating that the two species differed in their spatial pattern of occurrence among camera locations. For example, jaguars were most frequently captured at M4200 whereas pumas were more frequent at M2200 (Fig. 4). These two sites are approximately 1.5 km apart (see map in Blake et al., 2016). Three sites, P150, P1000, P2450, are in a peninsula of forest and typically had fewer captures of jaguars when compared to the other seven sites (t = 3.33, d.f. = 8, p < 0.05), similar to results from the previous study (i.e., from 2005-2012). Pumas also were less likely to occur at these three sites than at other sites, but the difference was not significant (t = 1.88, d.f. = 8, p = 0.10).
Discussion
Long-term studies (i.e., > 10 years) of jaguars and other predators of Neotropical forests are not common (Harmsen et al., 2017). The current study encompasses 19 years which allows us to evaluate variation in occurrence of jaguars and pumas over time. Capture rates of both species varied across years, with puma capture rates somewhat more variable (higher CV), but neither species showed any evidence of declines; in fact, capture rates increased slightly over the years for both species. Continued presence of jaguars and pumas in the TBS area suggests that their abundance, or at least activity as indexed by capture rate, may be relatively stable. This in turn suggests that human activities in the region have not had a negative impact on populations of these predators and that prey abundance has remained at a high enough level to support them (Espinosa et al., 2018). In fact, capture rates of many typical prey items, such as collared peccaries, red brocket deer, pacas (Cuniculus paca Linnaeus 1766, black agoutis, and nine-banded armadillos (Dasypus novemcinctus Linnaeus 1758) but not white-lipped peccaries or tapirs (Tapirus terrestris Linaeus 1758), were positively correlated with year (J. G. Blake, unpublished data). Jaguar capture rates were not significantly correlated with any of the prey species whereas pumas were positively associated with collared peccaries, red brocket deer, and nine-banded armadillos (J. G. Blake, unpublished data).
Both jaguars and pumas were recorded at all camera locations within the station boundaries, with no significant differences in overall capture rates. The two species did, however, differ somewhat in their activity (number of records) at specific camera locations. This might indicate some spatial segregation in activity. Both species were less likely to be captured in cameras that were located within an area of forest bounded closely by the Tiputini River; a similar result was seen for jaguars in our earlier study (Blake et al., 2014).
Jaguars are known to be good swimmers (Emmons, 1987; Da Silveira et al., 2010; Duarte et al., 2022) and several individuals were recorded at sites located on both sides of the Tiputini River, up to 5 km from camera locations within the station boundaries. The two sites on the south side of the river were saladeros (mineral licks) that attract a variety of species known to be prey to jaguars (e.g., peccaries, deer; Blake et al., 2011). Similarly, images of jaguars were captured at two mineral licks found within the station boundaries, perhaps because of the presence of potential prey.
Jaguars and pumas showed a clear separation in hourly activity in the current study, with jaguars primarily active during daylight hours while pumas were mostly active at night. This was true both during the first years of the study (2005-2012) and the latter years (2014-2023) suggesting that these activity patterns are relatively consistent over time. This pattern of activity differs from some previous studies that found both species to be primarily nocturnal (Scognamillo et al., 2003) without clear differences in hourly activity. Foster et al., (2013) found that the two species were primarily nocturnal and crepuscular in closed, grasslands, and scrubby forest habitats and were more diurnal in pantanal. The two species showed little temporal segregation but did have a significant overlap with activity of their main prey. Similarly, Harmsen et al., (2009) found that both were predominantly nocturnal with a high correlation in capture rates at different locations and significant overlap with their main prey items (Harmsen et al., 2011). In contrast, Romero-Muñoz et al. (2010) found that the two species varied in hourly activity depending on the study site, showing significant temporal segregation in some dry forest sites but considerable overlap in others. The extent of nocturnal vs diurnal activity also varied among sites (Romero-Muñoz et al., 2010), suggesting that their behavior was flexible. The temporal differences in activity seen at TBS might suggest that jaguars and pumas may differ in primary prey items. Such differences also might reflect competitive avoidance of jaguars by the relatively smaller puma at TBS, although more study is needed to confirm this hypothesis regarding diet and biotic interactions. Clearly, hourly activity patterns of the two species can vary substantially depending on habitat and study region and likely with the distribution and abundance of different prey species.
Over the course of ~20 years, ~50 individual jaguars have been present at some point within the boundaries of Tiputini Biodiversity Station. There were 21 individuals identified from images taken from 2005 to 2012 (Blake et al., 2014) and 28 from 2014-2023; two of the 28 (one male, one female) from the current period also were recorded during the first study. In addition, there were several images during both sample periods that could not be assigned to a specific individual, so the actual number that have occurred at the station is likely greater than the number identified. That only two individuals were recorded in both sample periods indicates substantial turnover in the identities of jaguars found within the boundaries of the station.
Many individuals were recorded relatively few times, with 11 during the first period and 15 during the second period recorded in only one year, often in only one month. Most of these individuals likely were simply transients, passing through Tiputini, or individuals whose home range lies primarily outside the station boundary. On the other hand, some individuals were recorded over many months, more than 72 (6 years) in some cases, suggesting that they are resident in the area. During the current study, five males and two females were recorded over more than three years, with the two females present in more months than any of the males. One female, that could not be identified, was captured on video with two cubs during April 2015 (D. Mosquera, unpublished data), the only instance when cubs were documented. Although not identified, this likely was one of the resident females and provides further evidence of the viability of the population. During the first study, 4 males and 1 female were recorded over more than 3 years, with two males and one female recorded over at least 6 years (72-81 months; Blake et al., 2014). No cubs were photographed during that period. TBS is only ~670 ha so clearly is not large enough to encompass the entire home range of an individual jaguar. Instead, most of these individuals likely have home ranges that include some or all of TBS property. Harmsen et al. (2017), in a 14-year study in Belize, identified 105 individual jaguars in a study area of ~100 km2, including 57 males, 31 females, and 17 whose sex was not determined. They suggested that individuals recorded over < 3 years should be considered transients with those recorded over longer periods considered residents. Their data indicated a maximum age of 14 years for males and 13 for females. If the same age structure applies to individuals in the Tiputini area, this could explain why only two individuals were recorded during both sample periods.
Tiputini Biodiversity Station is in the midst of extensive, relatively undisturbed lowland forest. Despite its relatively small size, jaguars and pumas, as well as other predators (e.g., ocelots) are regularly present within and near the station. Results demonstrate the large overlapping ranges of jaguars, based on individual identifications, and the spatial overlap of the Neotropics largest terrestrial predators, jaguars and pumas. Nearly 25 % of jaguar individuals occurred within the station across more than 3 years, some for at least 6 years. Temporal divergence in daily activity patterns, together with some spatial separation in sites most frequently encountered, suggest possible behavioral avoidance or differences in diet between the two species. The continued presence within the station boundaries of the two largest predators in Neotropical lowland forest provides a positive indication of the conservation status and importance of the region. It suggests that prey populations (e.g., many ungulates) are sufficient and that human activities have not had, to date, a large negative impact on either predators or prey. Whether this will remain true in the future remains to be seen as climate and other anthropogenic changes (e.g., deforestation, oil/gold mining) continue to affect many parts of the Amazon basin.
Ethical statement: the authors declare that they all agree with this publication and made significant contributions; that there is no conflict of interest of any kind; and that we followed all pertinent ethical and legal procedures and requirements. All financial sources are fully and clearly stated in the acknowledgments section. A signed document has been filed in the journal archives.

