


 Inglés (pdf)
 Articulo en XML
 Referencias del artículo
 Enviar articulo por email
 Citado por SciELO
  Similares en
SciELO
Similares en
SciELO  uBio
uBio 
 Permalink
Introduction
Knowledge of Colombia’s marine biodiversity has improved in recent decades due to expeditions in the Colombian Caribbean ranging from 20 to 900 m (Díaz & Acero, 2003). These efforts have significantly contributed to our understanding of marine biodiversity, especially in deeper areas. Several studies along this coastal zone revealed a high species richness within taxonomic groups like corals, crustaceans, mollusks, and echinoderms (Benavides-Serrato et al., 2011; Díaz & Puyana, 1994; Lemaitre, 1981; Martínez-Campos et al., 2017; Núñez et al., 1999; Reyes et al., 2010). However, there are still gaps in information regarding the spatial patterns of diversity in the assemblages of other faunal groups along the marine coast of the Caribbean and the Colombian Pacific, particularly those associated with the supralittoral zone (Batista-Morales & Díaz-Sánchez, 2011). This zone is defined as the area of the coastline above the high tide line, including the high tide berm where plant material and debris deposited by the sea accumulate. The supralittoral zone extends up to the cliffs, dunes, coastal ridges, and both rocky and sandy coastlines (Ceballos-Fonseca, 2009). In this area, various types of microhabitats favorable for edaphic fauna may be found, including decomposing plant material (such as logs, leaf litter, algae), bark of living trees and their roots, herbaceous plants, rocks, coral remains, and sand (Núñez et al., 1999; Schultz, 1972).
Terrestrial isopods (Oniscidea) are a unique lineage among crustaceans, adapting entirely to terrestrial habitats and considered an important detritivore component of the edaphic fauna, particularly in tropical habitats (Leistikow, 2001; Schmalfuss, 2003; Hornung, 2011; Richardson & Araujo, 2015; Taiti, 2018). The group encompasses over 4,000 described species in more than 500 genera within 38 or 39 families, distributed across almost all terrestrial environments, making it one of the richest groups within Isopoda (Campos-Filho & Taiti, 2021; Dimitriou et al., 2019; Lins et al., 2017; Sfenthourakis & Taiti, 2015).
Alongside other members of the edaphic fauna, the oniscideans play a key role in soil formation and nutrient recycling (Ŝpaldoňová & Frouz, 2014; Zimmer & Topp, 1999). Many species within this group are utilized as model organisms in research on ecology (Hamaïed & Charfi-Cheikhrouha, 2004; Sfenthourakis et al., 2005; Sghaïer & Charfi-Cheikhrouha, 2002), reproduction (Araujo & Bond-Buckup, 2005), and physiology (Lesěr et al., 2008), and they are considered valuable indicators of environmental impact (Longo et al., 2013; Paoletti & Hassall, 1999; Solomou et al., 2019). The dynamics of terrestrial isopod populations and assemblages are significantly influenced by environmental factors such as temperature and humidity, impacting their survival, growth, and reproduction (Leistikow, 2001; Messina et al., 2016; Rushton & Hassall, 1987; Solomou et al., 2019; Zimmer, 2005).
While studies on distribution patterns and spatial changes in terrestrial isopods diversity have been conducted in the Palearctic region, particularly in mountainous areas, oases, and wetlands (e.g., Gabsi et al., 2024; Khemaissia et al., 2012a, Khemaissia et al., 2016, Khemaissia et al., 2017; Sfenthourakis, 1993, Sfenthourakis, 1996a, Sfenthourakis, 1996b; Sfenthourakis & Legakis, 2001; Sfenthourakis & Triantis, 2009; Sfenthourakis et al., 2008), the research conducted in the Neotropical supralittoral zone has primarily focused on taxonomy, with no prior investigations into the spatial patterns of this group’s assemblage (e.g., López-Orozco et al., 2022; Paoletti & Stinner, 1989; Schultz, 1972; Schultz 1984; Schultz & Johnson, 1984; Taiti et al., 2018). Similarly, there is a limited number of studies investigating distribution patterns of species in the different marine ecoregions of the country within the supralittoral zone. Most studies conducted in the region have focused on the slope and continental shelf at depths ranging from 20 to 1 000 meters and in some cases, there are no known works on groups that inhabit the supralittoral zone (e.g., Benavides-Serrato & Borrero-Pérez, 2010; Merchán-Cepeda et al., 2009; Navas et al., 2010; Navas et al., 2013; Vides, 2011).
This study aims to evaluate the spatial changes in alpha and beta diversity within the terrestrial isopod assemblage across three marine ecoregions of the Colombian Caribbean. Additionally, it seeks to examine abundance gradients in relation to soil temperature and moisture. The obtained information will serve as a key input for proposing plans dedicated to the conservation, management, and sustainable use of this group of organisms, representing opportunities to provide insights into the composition, structure, function, and dynamics of ecological systems.
Material and methods
Study area: The Colombian Caribbean coast spans from 11°50’ N-71°18’ W in Castilletes to 08°42’ N- 7°19’ W in Cabo Tiburón, covering an approximate length of 1 600 km (Fig. 1). IDEAM et al. (2007) assert that the Colombian Caribbean Sea Province is located in the Marine Biogeographic Region of the Western Tropical Atlantic (Spalding et al., 2007), encompassing two ecozones (Caribbean Continental Shelf and Caribaná Talud). These represent uniform sectors of the seabed, characterized by significant geomorphological features that group distinct biota types. The marine coast of the Colombian Caribbean is divided into eight ecoregions, the lowest level of regionalization for marine systems. Ecoregions are delimited based on factors including the degree of continental influence, coast geomorphology, sediment types, water masses outcrops, wave energy levels, presence of ecological units, biological productivity of the water column, and type of coastal ecosystems, and are located in the ecozone Caribbean Continental Shelf (Fig. 1) (Díaz & Acero, 2003).
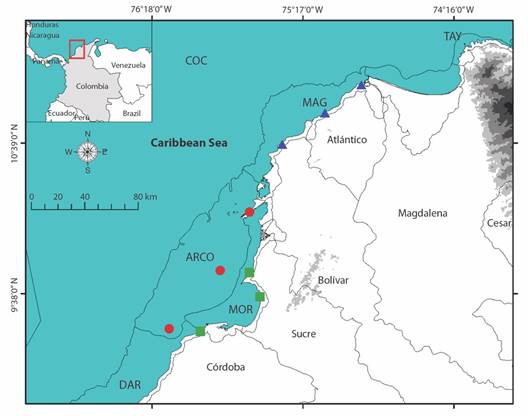
Fig. 1 Sampling stations in each of the ecoregions under study. ARCO, Coralline Archipelagos Ecoregion; MAG, Magdalena Ecoregion; MOR, Gulf of Morrosquillo Ecoregion. Shapefile from the ecoregions provided by INVEMAR.
This study focuses on three ecoregions in the central part of the Colombian Caribbean (Fig. 1): 1. Coral Archipelagos (ARCO), characterized by clear waters, hosting a high species richness, and feature diverse habitats, including coral reefs, seaweed beds, bioclastic sand flats, and mangroves on some islands; 2. Magdalena (MAG), highly influenced by the discharges of the Magdalena River, characterized by strong sediment loads and low salinity levels; and, 3. Gulf of Morrosquillo (MOR), affected by continental discharges through the Canal del Dique and the Sinú River, characterized by fine sediments and mangrove ecosystems (Díaz & Acero, 2003). Three sampling stations in each ecoregion were stablished, selected a priori based on Google Earth and available basic cartography maps, following three main criteria: 1. Existence of cliffs, dunes, coastal remains, rocky, or sandy coastline; 2. Low level of anthropic intervention; and 3. Ease of access. Supplementary Information SMT1 and SMF1 present the characteristics and photographs, respectively, of the different sampling stations, and Fig. 1 shows their geographical location.
Sampling and taxonomic identification: Sampling was conducted between September and November 2022. At each sampling station, a visit was made, and Direct Intuitive Searches (DIS) were performed, which involved searching for terrestrial isopods in key sites or microhabitats (such as leaf litter, logs, coral remains, and decomposing plant material) for 10 minutes per observer (two observers) (Karasawa, 2022; Taiti & Wynne, 2015). Ten repetitions were conducted in each microhabitat, spaced at least 15 meters apart to ensure data independence. This resulted in 1.65 hours of searching per microhabitat per observer at each station. The samples were collected manually, and all search sites were delimited to 1 m2 with a PVC quadrant. It is important to note that there was no delimitation of the microhabitats, and the sites were selected considering the completeness of the microhabitat greater than 90% within the sampling station. In each microhabitat, soil temperature and moisture data were recorded using a YAXU N03654 soil thermohydrometer, and substrate information was noted. Moreover, three replicate measurements per parameter were conducted.
The material was identified using morphological characters using micropreparations (microscope glass slides) in Hoyer’s medium (Anderson, 1954), following Carpio-Díaz et al. (2016), Carpio-Díaz et al. (2023), López-Orozco et al. (2014), López-Orozco et al. (2022), and Taiti et al. (2018). The collected material was deposited in the research laboratories of the Grupo de Investigación Hidrobiología of the University of Cartagena, Cartagena, Colombia, with catalog numbers between CBUDC-CRU 408 and CBUDC-CRU 492.
Data analysis: We analyzed three transects of logs, three of coral remains, and two of leaf litter in ARCO; three of logs and two of decomposing plant material in MAG; and three of logs, two of decomposing plant material, and one of leaf litter in MOR. Richness was treated as the total number of species per transect, and abundance as the total number of individuals captured. We evaluated the completeness of the sampling by applying the approach of Chao et al. (2014), using extrapolation-interpolation curves on the rarefaction and coverage of the sample. This is based on the first-order diversity according to Hill numbers (q = 0), utilizing the abundance data, following the proposals by Chao et al. (2014) and Colwell et al. (2012). Alpha diversity was evaluated using the effective numbers of species (q0, q1, and q2) for each site, representing the three diversity orders: q0, the number of species observed; q1, the exponential of the Shannon index; and q2, the inverse of the Simpson index. For each q order, 95 % confidence intervals were obtained with 500 bootstrap pseudoreplicates, and alpha diversity profiles were constructed. These analyses were performed using RStudio v4.2.0 with the “iNEXT” package and the online iNEXT tool (Chao et al., 2016; Hsieh et al., 2016; R Core Team, 2020). Additionally, to compare the patterns of richness, abundance, and uniformity between sites, rank/abundance curves were performed with the abundance data transformed using Log10, following the proposal of Whittaker (1972).
Following the proposal of Moreno et al. (2011), the q values were compared based on the magnitude of their differences (MD) with the modifications of Cultid-Medina & Escobar (2016) and Cultid-Medina & Escobar (2019), taking into account that the values obtained for the completeness of the sampling in each of the sites according to the coverage curves (100 % in each case). This method considers that it is possible to compare diversity estimates (qD ± 95 % CI) under the same sampling coverage, allowing the principle of replication to be respected and to calculate how many times one assemblage is more or less diverse than another. This measurement is calculated in percentage terms using the following equation: % MD = 100 - [(qD sample 2 * 100) / qD sample 1]. In that sense, when sample 1 is more diverse than sample 2, the MD percentage will be positive; otherwise, it will be negative. MD varies between 0 (no change in pairwise diversity) and ± 100 % (completely different diversity). The MD values were compared visually, and the interpretation of the comparisons is complementary to that of the 95% confidence interval (Cultid-Medina & Escobar, 2016; Cultid-Medina & Escobar, 2019).
Beta diversity and its components were evaluated using the proposal of (Baselga, 2010; Baselga, 2013; Baselga, 2017), implementing the functions beta.multi.abund and beta.pair.abund, with the Bray-Curtis index through the “betapart” package in RStudio (Baselga, 2013; Baselga, 2017; Baselga & Orme, 2012; R Core Team, 2020). To determine if there were significant differences in the composition and abundance of the species assemblage between the ecoregions, a Permutational Analysis of Variance (PERMANOVA) of one-way was performed based on the similarities of Bray-Curtis index with 999 permutations in the software PAST v4.12 (Anderson, 2001; Hammer et al., 2001). Additionally, the matrix of abundances by transects was transformed to the square root to reduce the weight of the dominant species, and a similarity matrix was calculated using the Bray-Curtis index, and an ordination was carried out using a Non-metric Multidimensional Scaling analysis (NMDS), to explore possible relationships between transects per ecoregion. This analysis was performed using RStudio v4.2.0 with the package “vegan” (Oksanen et al., 2014; R Core Team, 2020). Graphics of alpha and beta diversity were performed in RStudio v4.2.0 using the “ggplot2” package (Wickham, 2016).
Characteristic or indicator species of the ecoregions were identified using the indicator species analysis (IndVal %). This method consists of determining the species’ affinity for a specific environment, site, or habitat. The measure is based on fidelity (relative frequency) and specificity (relative abundance) and obtains its maximum value (100 %) when a species is found only at one site and in all its samples (Dufrêne & Legendre, 1997). Species with IndVal ≥ 50 % and with statistical significance (P < 0.05) were considered as indicators. These analyses were performed in the software PAST v4.12 (Hammer et al., 2001).
A non-parametric Kruskall-Wallis test was performed (after confirmation of normality using the Shapiro-Wilk test and homogeneity of variances using the Levene test), to identify possible differences between the ecoregions regarding soil temperature and moisture (P < 0.05). Subsequently, to identify between which pairs of ecoregions the differences existed, a Wilcoxon post-hoc test was applied (P < 0.05). This analysis was performed in RStudio v4.2.0 (R Core Team, 2020). Canonical Correspondence Analysis (CCA) was used to detect possible relationships between species and environmental variables (soil moisture and temperature), following the procedures of Legendre & Legendre (1998) in the software PAST v4.12, using type 2 scaling, which emphasizes the relationship between species and variables. The P-values for each eigenvalue were obtained using 999 permutations (Braak & Verdonschot, 1995; Hammer et al., 2001; Legendre & Legendre, 1998). Species with an abundance of fewer than 20 individuals were excluded from this analysis.
Results
We collected 1 970 individuals, distributed across three ecoregions: ARCO (1 166), MOR (533), and MAG (271), representing nine families and 17 species, two of which are classified as Incertae sedis (Table 1). The families with the greatest richness were Tylidae (N = 1 109, 56.3 %), Halophilosciidae (N = 598, 30.3 %), and Detonidae (N = 43, 2.2 %), each with three species. The genera Tylos Audouin, 1826 and Armadilloniscus Uljanin, 1875 presented the highest number of species, each with three. However, Tylos contributed 56.3 %, and Armadilloniscus 2.2 % in terms of abundance.
Table 1 Composition and abundance of terrestrial isopod assemblages in the Coralline Archipelagos (ARCO), Magdalena (MAG), and Gulf of Morrosquillo (MOR) ecoregions.
| Family/Species | ARCO- E1 | ARCO- E2 | ARCO- E3 | MOR- E1 | MOR- E2 | MOR- E3 | MAG- E1 | MAG- E2 | MAG- E3 |
| Ligiidae | |||||||||
| Ligia baudiniana Milne-Edwards, 1840 | 31 | 60 | 24 | _ | 10 | _ | 20 | 5 | _ |
| Tylidae | |||||||||
| Tylos marcuzzii Giordani Soika, 1954 | _ | _ | 11 | 389 | 1 | 40 | _ | 4 | _ |
| Tylos negroiLópez-Orozco, Carpio-Díaz & Campos-Filho, 2022 | 4 | 31 | 20 | 18 | 23 | _ | 20 | 7 | _ |
| Tylos niveus Budde-Lund, 1885 | 438 | 26 | 77 | _ | _ | _ | _ | _ | _ |
| Stenoniscidae | |||||||||
| Stenoniscus nestoriLópez-Orozco, Taiti & Campos-Filho, 2022 | 1 | _ | _ | _ | _ | _ | _ | _ | _ |
| Detonidae | |||||||||
| Armadilloniscus luisi Carpio-Díaz, Taiti & Campos-Filho, 2022 | _ | 5 | 3 | _ | _ | _ | _ | _ | _ |
| Armadilloniscus ninaeSchultz, 1984 | _ | 2 | 3 | _ | _ | _ | _ | _ | _ |
| Armadilloniscus caraibicusPaoletti & Stinner, 1989 | 1 | _ | 29 | _ | _ | _ | _ | _ | _ |
| Halophilosciidae | |||||||||
| Halophiloscia trichoniscoides (Vandel, 1973) | 41 | _ | 91 | _ | _ | _ | _ | _ | _ |
| Littorophiloscia denticulata (Ferrara & Taiti, 1982) | 13 | 35 | 17 | _ | _ | _ | 7 | _ | _ |
| Littorophiloscia tropicalisTaiti & Ferrara, 1986 | 36 | 91 | 49 | 17 | 3 | 5 | 121 | 36 | 36 |
| Platyarthridae | |||||||||
| Trichorhina bermudezae Carpio-Díaz, López-Orozco & Campos-Filho, 2018 | 21 | _ | _ | _ | _ | _ | _ | _ | _ |
| Trichorhina heterophthalma Lemos de Castro, 1964 | 1 | _ | _ | _ | _ | _ | _ | _ | _ |
| Porcellionidae | |||||||||
| Porcellionides pruinosus (Brandt, 1833) | 3 | _ | _ | _ | _ | _ | _ | _ | _ |
| Armadillidae | |||||||||
| Ctenorillo tuberosus (Budde-Lund, 1904) | _ | _ | _ | _ | 27 | _ | 3 | _ | _ |
| Incertae sedis | |||||||||
| Buchnerillo neotropicalisTaiti, Montesanto & Vargas, 2018 | _ | _ | _ | _ | _ | _ | 10 | _ | 2 |
| Buchnerillo sp. | _ | 1 | 1 | _ | _ | _ | _ | _ | _ |
| Abundance | 590 | 251 | 325 | 424 | 64 | 45 | 181 | 52 | 38 |
| Richness | 11 | 8 | 11 | 3 | 5 | 2 | 6 | 4 | 2 |
Sampling coverage was 100 % in each ecoregion, indicating a high efficiency of the implemented methodology in capturing terrestrial isopods (Fig. 2A). Rarefaction and extrapolation curves, based on the number of individuals, revealed that doubling the sample size would yield the same sampling completeness in MAG and MOR ecoregions. However, for the ARCO ecoregion, there would possibly be one more species (16.2 estimated) with a 95 % confidence interval. Additionally, richness exhibited consistent behavior across ecoregions (Fig. 2B).
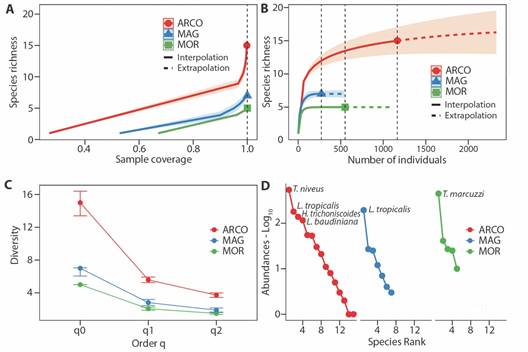
Fig. 2 A. Coverage-based rarefaction and extrapolation sampling curves of the assemblage of terrestrial isopods for ecoregion. B. Species interpolation/extrapolation rarefaction curves based on number of individuals and richness (q0) for ecoregion. C. Diversity profiles for each ecoregion, with CI 95% for each q order. D. Rank abundance (Whittaker curves) of the assemblage of terrestrial isopods for ecoregion. ARCO, Coralline Archipelagos Ecoregion; MAG, Magdalena Ecoregion; MOR, Gulf of Morrosquillo Ecoregion.
In terms of species richness, ARCO revealed 10 additional species compared to MOR and eight more than MAG. Moreover, ARCO boasts 2.8 and 3.5 more effective species than MAG and MOR, respectively. Regarding dominant effective species, ARCO outpaced MAG by 1.8 and MOR by 2.2. Consequently, ARCO demonstrated superior richness, diversity, and dominance. Additionally, MAG yielded two more species than MOR, with comparable values in terms of effective and dominant species (Fig. 2C). Pairwise differences were consistently positive for ARCO across all diversity orders, being greater between ARCO and MOR (q0 = 66.7 %, q1 = 63.1 %, q2 = 59.9 %), than between ARCO and MAG (q0 = 53.3 %, q1 = 49.6 %, q2 = 49.2 %). Between MAG and MOR, the greatest difference was observed in terms of richness (q0 = 28.6 %), with no clear differences in terms of Shannon’s exponential (q1 = 26.7 %) and inverse of Simpson’s (q2 = 21.2 %).
The assemblage in ARCO has four dominant species, differing from MAG and MOR, where one species had the greatest number of individuals. The species with the highest abundances were Tylos niveus, Littorophiloscia tropicalis, Halophiloscia trichoniscoides, and Ligia baudiniana in ARCO ecoregion; Tylos marcuzzii in MOR; and L. tropicalis in MAG (Fig. 2D). The abundance of these species represents 84.4 % of the total.
We found that total beta diversity between ecoregions (βBC = 82.7 %), was modulated to a greater extent by the balanced variation in abundance (βBC:BAL = 67.6 %) than the abundance gradient (βBC:GRA = 15.1 %). Beta diversity among ecoregions exceeded 60 %, with the greatest dissimilarity observed between ARCO and MOR (βbc = 0.89), primarily determined by balance. Similarly, between MAG and MOR (βbc = 0.83), dissimilarity was modulated by balance, and between ARCO and MAG (βbc = 0.65), it was determined by the gradient (Fig. 3A). Assemblage structure differed significantly between ecoregions (FPermanova = 3.706; P = 0.001), with significant differences observed between ARCO and MAG (FPermanova = 3.923; P < 0.01), ARCO and MOR (FPermanova = 4.305; P < 0.001), and MAG and MOR (FPermanova = 2.761; P < 0.05). The NMDS confirmed the PERMANOVA results, clearly separating the structure of the assemblages between the ecoregions (Fig. 3B).
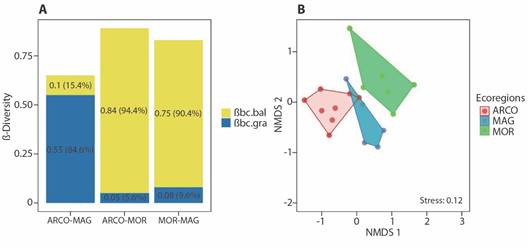
Fig. 3 A. Beta diversity partitioning values calculated with the Bray-Curtis index between the ecoregions studied in the Colombian Caribbean. βbc.bal: balanced variation component of Bray-Curtis dissimilarity; βbc.gra: abundance gradient component of Bray-Curtis dissimilarity. B. Non-metric Multidimensional Scaling (NMDS) ordination analysis based on Bray-Curtis index of similarities of the terrestrial isopods assemblage between ecoregions. ARCO, Coralline Archipelagos Ecoregion; MAG, Magdalena Ecoregion; MOR, Gulf of Morrosquillo Ecoregion.
Six indicator species were identified (IndVal ≥ 50 %, P < 0.05). L. denticulata, L. baudiniana, T. niveus, and H. trichoniscoides are indicator species for ARCO ecoregion; L. tropicalis for MAG; and T. marcuzzii for MOR (Fig. 4).
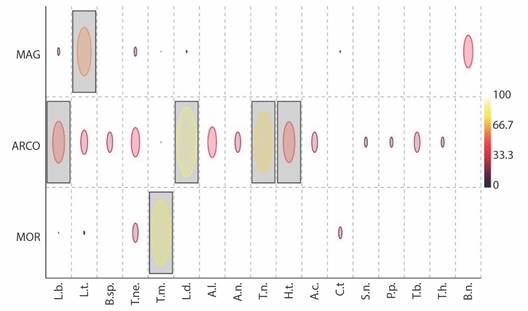
Fig. 4 Indicator species analysis (IndVal%) of the terrestrial isopod assemblage in the three ecoregions. Gray boxes denote species with significances (P < 0.05) of IndVal. ARCO, Coralline Archipelagos Ecoregion; MAG, Magdalena Ecoregion; MOR, Gulf of Morrosquillo Ecoregion. Species: L.b, Ligia baudiniana; T.m, Tylos marcuzzii; T.ne, T. negroi; T.n, T. niveus; A.c, Armadilloniscus caraibicus; A.n, A. ninae; A.l, A. luisi; H.t, Halophiloscia trichoniscoides; L.d, Littorophiloscia denticulata; L.t, Littorophiloscia tropicalis; T.b, Trichorhina bermudezae; T.h, T. heterophthalma; C.t, Ctenorillo tuberosus; B.n, Buchnerillo neotropicalis; B.sp., Buchnerillo sp.; S.n, Stenoniscus nestori; P.p, Porcellionides pruinosus.
The highest average soil temperatures were found in MAG (29.7 ± 0.3), while the lowest were in ARCO (28.3 ± 0.1). Concerning soil moisture, the highest values were observed in MOR (75.4 ± 2), and the lowest in MAG (64.2 ± 1.9). These two variables differ significantly between ecoregions (temperature: H = 17.725; P < 0.001; moisture: H = 17.573; P < 0.001). Soil temperature differences were observed among all ecoregions, whereas soil moisture showed significant differences between ARCO and MAG, without differences between ARCO and MOR (Fig. 5).
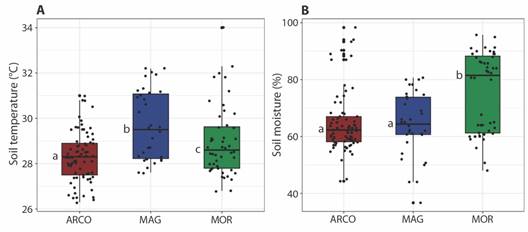
Fig. 5 Box-plot of soil temperature (A) and soil moisture (B) in the study area. Different letters indicate statistically significant differences (P < 0.05). ARCO, Coralline Archipelagos Ecoregion; MAG, Magdalena Ecoregion; MOR, Gulf of Morrosquillo Ecoregion.
Canonical Correspondence Analysis revealed a positive relationship between the two variables and the first axis, explaining 100 % of the variation (P < 0.05). This axis was positively associated with the abundance of T. marcuzzii, displaying a marked distribution towards the MOR transects, indicating that this species is linked to high values of soil temperature and moisture. The other species included in the analysis exhibited negative relationships with the two variables (L. baudiniana, T. negroi, T. niveus, A. caraibicus, H. trichoniscoides, L. denticulata, L. tropicalis, T. bermudezae, and C. tuberosus) (Fig. 6).
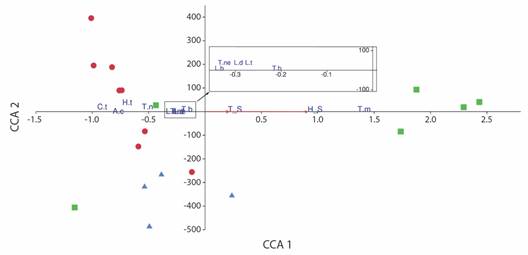
Fig. 6 Ordination diagram of Canonical Correspondence Analysis (CCA) showing distribution of abundance data for taxa, transects and environmental variables (red arrows). S_M, soil moisture; S_T, soil temperature. Squares, transects of Gulf of Morrosquillo Ecoregion; triangles, transects of Magdalena Ecoregion; circles, transects of Coralline Archipelagos Ecoregion. Species: L.b, Ligia baudiniana; T.m, Tylos marcuzzii; T.ne, Tylos negroi; T.n, Tylos niveus; A.c, Armadilloniscus caraibicus; H.t, Halophiloscia trichoniscoides; L.d, Littorophiloscia denticulata; L.t, Littorophiloscia tropicalis; T.b, Trichorhina bermudezae; C.t, Ctenorillo tuberosus.
Discussion
In our study, we identified 17 species of terrestrial isopods in the supralittoral zone across the three evaluated ecoregions. Currently, Colombia boasts the highest number of species recorded from the coastal environment in the Neotropical region (Carpio-Díaz et al., 2016; López-Orozco et al., 2022). Furthermore, additional surveys in coastal areas outside the supralittoral zone in the ARCO, MOR, and MAG ecoregions have unveiled the presence of species not previously documented from Colombia, including Rhyscotus sphaerocephalus Budde-Lund, 1893, Littorophiloscia culebrae Moore, 1901, and Alloniscus buckupi Campos-Filho & Cardoso, 2018.
The taxonomic composition and abundance observed in the assessed ecoregions closely resemble findings in other tropical countries (Mexico, Cuba, Belize, Costa Rica, Venezuela, and Brazil), featuring common species of the genera Ligia Fabricius, 1798, Tylos, Armadilloniscus, Littorophiloscia Hatch, 1947, and Stenoniscus Aubert & Dollfus, 1890 being common (Boone, 1934; López-Orozco et al., 2022; Paoletti & Stinner, 1989; Schultz, 1972; Schultz, 1984; Schultz & Johnson, 1984; Taiti & Ferrara, 1986; Taiti et al., 2018). Schultz (1972), Schultz (1984), Schultz & Johnson (1984), and Taiti et al. (2018) documented up to 13 species in the supralittoral zone of Caribbean countries. In contrast, López-Orozco et al. (2022) reported 17 terrestrial isopod species on Isla Grande (Colombian Caribbean), with 16 in the coastal environment.
The results for richness and abundance analysis in the supralittoral zone of the three evaluated ecoregions were highest in ARCO. This pattern is likely attributed to the availability and quality of microhabitats in this ecoregion. Conversely, the lower availability of microhabitats, coupled with the influence of discharges from the Magdalena and Sinú rivers in the MAG and MOR ecoregions, could be influencing the establishment of certain species with more stringent physiological requirements. López-Victoria et al. (2004) mentioned that the specific composition in the rocky coastlines of the Colombian Caribbean is primarily determined by substrate type, waves, and slope. While the latter two variables were similar across all stations, differences in microhabitat availability (substrates) were noted. Therefore, the species richness of terrestrial isopods in the supralittoral zone of the Colombian Caribbean is related to the availability of microhabitats.
The structure and composition of the terrestrial isopod assemblage vary among the evaluated ecoregions, with high beta diversity values. Faunistic assemblages respond to abiotic environmental variables (Messina et al., 2016; Navas et al., 2010), and their distribution is determined by the environmental conditions and the organisms’ capacity to adapt. The distribution patterns of terrestrial isopods in the supralittoral zone of the Colombian Caribbean align with the zoning of marine ecoregions, each presenting unique characteristics such as geomorphology, the influence of continental discharges, and ecosystems, among others. In general, there is a scarcity of published works on the structure and composition of species in the supralittoral zone of the Colombian Caribbean.
Ligia baudiniana, T. niveus, H. trichoniscoides, and L. denticulata were recognized as indicator species for the ARCO ecoregion, with T. marcuzzii in the MOR ecoregion, and L. tropicalis in MAG. Ligia baudiniana, known for its ‘runner’ habit, is distributed along all coasts of America and has been found in river transport boats, potentially contributing to its expanded distribution (Com. Per. C.M. López-Orozco). Tylos niveus, a species with limited mobility, benefits from local community transportation of coastal materials favoring its local distribution in ARCO. Halophiloscia trichoniscoides is an endemic species in the Caribbean region (López-Orozco et al., 2022; Vandel, 1973), and was found in all ARCO stations. Littorophiloscia denticulata and L. tropicalis are circumtropical species (Leistikow, 2000; López-Orozco et al., 2022; Taiti & Ferrara, 1986). According to our results, L. tropicalis is distributed along the marine coasts of the ARCO, MOR and MAG ecoregions.
High values of soil temperature and moisture correlated with low abundance of the terrestrial isopod assemblage. In contrast, T. marcuzzii exhibited high abundance and frequency, with increasing values of these two variables. Generally, terrestrial isopod populations are associated with increasing values of these two variables (Solomou et al., 2019; Zimmer, 2005). Rushton & Hassall (1987) highlighted that temperature and humidity influence the growth, survival, and reproduction of these organisms leading to population peaks under optimal conditions (Fingini, 2008). However, Preciado & Martínez (2014) found no relationship between factors such as soil temperature, ambient temperature, and relative humidity with the abundance of the evaluated species, suggesting that soil characteristics may be more influential in determining the abundance of terrestrial isopod species in a given habitat. Considering this, evaluating the response of terrestrial isopod populations in the supralittoral zone of the Colombian Caribbean to these variables, along with other potential determinants, is essential. In addition, it is necessary to include other variables in order to determine their influence, which, in some cases, might be decisive (Gabsi et al., 2024; Hamaïed-Melki et al., 2010; Khemaissia et al., 2012a; Khemaissia et al., 2012b; Khemaissia et al. 2016; Zimmer, 2005).
Terrestrial isopods have been employed in the evaluation and monitoring of environmental impacts stemming from heavy metals, urbanization, and agricultural processes, among other factors (Longo et al., 2013; Paoletti & Hassall, 1999; Solomou et al., 2019; Szlavecz et al., 2018). The observed differences in assemblage structure among the evaluated ecoregions underscore the potential utility of these organisms in devising strategies for the conservation, management, and sustainable utilization of resources within the supralittoral zone of the Neotropical region. Furthermore, the taxonomic composition discovered exhibits unique characteristics that distinguish the evaluated areas, featuring indicator species with specific requirements.
Our results provide evidence for the high species richness of Oniscidea in the supralittoral zone of the Colombian Caribbean. However, given the diverse orographic and physiographic conditions of the coastal zone and the lack of exploration in other ecoregions (Darién, Tayrona, Palomino, and Guajira), knowledge on the taxonomic composition of the terrestrial isopods in the coastal area remains incomplete. Collaborative efforts are needed to understand the biology of species with specific adaptations and low abundance. Moreover, considering the threats to the supralittoral zone, such as erosion, environmental and climate change, and human intervention, species in this area are at risk of disappearing. This scenario is alarming for the group, because their ecosystem roles are not yet known, which may have long-term repercussions on conservation strategies.
Finally, similar challenges are observed in other countries, where knowledge of coastal terrestrial isopod species is nearly nonexistent. Therefore, investing in personnel training and interdisciplinary projects is crucial for a better understanding of the diversity, ecology, and biology of Oniscidea in the coastal areas of the Caribbean region.
Ethical statement: the authors declare that they all agree with this publication and made significant contributions; that there is no conflict of interest of any kind; and that we followed all pertinent ethical and legal procedures and requirements. All financial sources are fully and clearly stated in the acknowledgments section. A signed document has been filed in the journal archives.
a43v72n1-MS1
