


 Inglés (pdf)
 Articulo en XML
 Referencias del artículo
 Enviar articulo por email
 Citado por SciELO
  Similares en
SciELO
Similares en
SciELO  uBio
uBio 
 Permalink
Introduction
While dinoflagellates around the world are associated by harmful algal blooms (HAB’s) (Badylak & Phlips, 2009; Morquecho, 2019), in Puerto Rico, the bioluminescence of the dominant species Pyrodinium bahamense has resulted in a lucrative eco-tourism industry. Bioluminescent bays of Puerto Rico include Laguna Grande de Fajardo on the Northeastern tip, Mosquito Bay on the offshore island of Vieques, and La Parguera on the Southwestern coast (Bahía Fosforescente). They are surrounded by nature reserves under the Department of Environment and Natural Resources (DNER, 2013), managed to protect the fringing mangroves, access channels, water quality, and stimulate adventure tourism (Weaver et al., 1999). Commercial tour operators reported ~34 000 kayaks rented to visit Laguna Grande in 2018 earning approximately $1.7 million (DNER, 2013). Due to the socio-economic benefits of the dominant bioluminescent dinoflagellate P. bahamense, numerous impact assessments for bio bays have been made. Sustained blooms involve a delicate balance of environmental conditions that control the flux of nutrients and biological uptake (O’Connell et al., 2007). Their density fluctuates over months and years due to flushing action around the coastal lagoon’s fringing coral reefs and mangrove vegetation, controlled by sea level, wind-driven currents and waves, sunlight and turbidity, sea temperatures in the range 24-29 °C, salinity, run off and organic content (Sastre et al., 2013; Soler-López & Santos, 2010).
At La Parguera Puerto Rico, Soler-Figueroa & Otero (2014) and Soler-Figueroa & Otero (2016) measured sea temperature, salinity, nutrient concentration, rainfall, wind velocity, and dinoflagellate count at multiple sites during wet and dry seasons. In the wet season (Aug-Nov), they found P. bahamense abundance increased under warmer sea temperature and lower salinity. Sastre et al. (2013) studied dinoflagellates at Laguna Grande Fajardo (hereafter: LGF) and found higher P. bahamense densities in summer and lower densities in winter (Dec-Mar), but erratic fluctuations of Ceratium (Tripos) furca. They found weak correlations between dinoflagellate density and the in-situ marine environment and nutrients (phosphate, nitrate), except for a negative correlation between fluorescence and salinity.
LGF is surrounded by a nature reserve on the Northeast tip of Puerto Rico, with a depth of 3 m (Soler-López & Santos, 2010) and mean annual rainfall ~1 500 mm. Freshwater runoff to LGF is sporadic and secondary to seawater exchange, especially during high tides from August to November. The freshwater flux is confined to infrequent storms and does not represent an effective water-renewal mechanism for LGF. Yet floods and drought do alter salinity, sea temperature, and pH (Sastre et al., 2013; Soler-López & Santos, 2010).
The loss to tourism-related businesses due to the 2018 Florida HAB’s was estimated to be $2.7 billion USD (Alvarez et al., 2024), which implies that HABs and their impact on eco-tourism can be considered as a potential ‘billion-dollar’ disaster for bio bays in Puerto Rico. In 2003 and 2013, low seasons of bioluminescence raised public and ecological concern (Pagán, 2021; Xei, 2013). The DNER (2013) attributed the decreases to lower sea-level/runoff/nutrients in the ecosystem. Conseversly, shifts in marine climate resulting in increased storm events and hurricanes have caused significant shifts in dinoflagellates communities and density in Florida (Fiorendino et al., 2021; Lopez et al., 2021; Phlips et al., 2020). Thus, our study of ocean influences during an active hurricane season on dinoflagellates in LGF was conceived to 1) Quantify temporal changes in bioluminescent dinoflagellate density in a six year monitoring study, 2) Understand how the marine environment modulates those changes, and 3) Determine the wider impacts of a fluctuating climate and extreme events on proxies for dinoflagellate density over two decades.
Material and methods
Dinoflagellate sampling points were established in LGF: Pt.1 in Southwest shallows (0 m depth), pt.2 in the Middle (2 m depth), pt.3 in mid-Northern shallows (0 m), and pt.4 (from 2018) at the Southeast canal entrance (Fig. 1A, Fig. 1B, Fig. 1C). Each point was sampled twice a month from July 2016 to December 2021 just after sunset 19:00 + LST, so to observe bioluminescence on a 0-3 scale: None-to-high. LGF watercolor ranged from 0: dark, 1: pale white, 2: blue hue, 3: bright turquoise, with 1 and 2 requiring water stirring. In addition to such visual observations, three 1 l water samples were collected by hand in the shallows, and with a Van Dorn depth sampler at point 2 (at 2 m). Sampling was disrupted from Oct-Dec 2017 by hurricanes and Mar-Apr 2020 by the COVID-19 pandemic. Water samples were preserved with 20 ml of 2 % formalin and transported to the Climate & Ecological Studies Lab at the Interamerican University of Puerto Rico, San Juan.
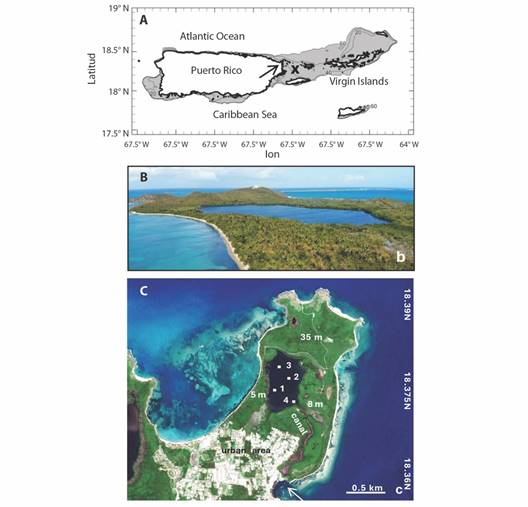
Fig. 1 A. Puerto Rico’s coast with shelf 0-60 m shaded; arrow points to LGF, buoy = x. B. Aerial view of LGF from SW to NE. C. Close-up of Fajardo Peninsula and the coastal lagoon, sampling points, elevation labels, canal exchange with ocean denoted by arrow.
Organisms settled to the bottom of the 1 l bottle (Huber, 2012) and were marked by a line at 20 ml. The remaining water was decanted after 48 hours using an automated 100 ml volumetric pipette and filtered through a 20 μm Nitex nylon mesh to isolate phytoplankton in suspension (Sastre et al., 2013). The unfiltered 20 ml sample and cells retained by the mesh were combined, washed into a 50 ml Falcon centrifuge tube, and stored in our lab. The concentrated plankton samples were swirled in a 50 ml tube for counting, and a 1 ml sub-sample was transferred to a gridded Sedwick-Rafter (S-R) (Huber, 2012). The S-R counting cell was covered with glass, and all identifiable dinoflagellate taxa were counted using a Leica CME or Nikon Eclipse microscope at 100-200X magnification.
Since Sastre et al. (2013) found little correlation between the lagoon environment and dinoflagellate density, open ocean data were collected from a NOAA buoy 41056: 18.26°N & 65.46°W (CariCOOS, 1996). Time series were obtained during the field monitoring for wind velocity, air and sea temperature and salinity. Fresh water inputs to LGF were derived from U.S. Geological Survey (2021) river discharge at Rio Fajardo 5007100. Using ~ 66 months of environmental data, a statistical analysis was conducted by averaging bioluminescent dinoflagellate density in LGF to monthly. Comparative work employed the non-parametric Kruskal Wallis and Tukey Tests, Spearman cross-correlation and multi-variate regression. The non-parametric tests were used because dinoflagellate density did not meet the normality assumption even after attempts of transformation. The Kruskal Wallis Test and Tukey Test is used to compare dinoflagellates density by month, year, and sampling station. Correlation analysis was completed for wind direction, wind speed (m/s), air pressure (hPa), marine air temperature (°C), salinity (‰), sea temperature (°C), Fajardo River discharge (ft3/s) and dinoflagellate density (ind/l).
After review, a second independent analysis was conducted over a wider area and longer period 2002-2022 using satellite and coupled reanalysis fields based on assimilation of in-situ and remote sensing measurements (Balmaseda et al., 2015; Storto et al., 2019). Daily time series were extracted at LGF: 18.39°N & 65.61°W, and maps of the surrounding marine climate were constructed. MODIS and VIIRS 4 km resolution satellite color radiance around LGF (Fig 1B) was extracted in the form of green-band chlorophyll (0.44 μm) and red-band fluorescence (0.67 μm). Other satellite data sets include satellite visible-band 4 km land vegetation color fraction, infrared 4 km GHR sea surface temperature (SST), 25 km resolution EC multi-satellite altimeter sea level, net outgoing longwave radiation (OLR) to represent atmospheric convection, and MODIS radiometer light extinction by atmospheric dust. The Hybrid Coordinate Ocean Model 10 km resolution coupled reanalysis (HYCOM3), (Chassignet et al., 2009) described surface ocean currents, salinity, mixed layer depth (MLD) and Ekman transport. Wavewatch 3 (W3) 25 km reanalysis (Tolman, 2002) was used for surface wave characteristics, based on buoy and satellite assimilation in a multi-spectral model (Chawla et al., 2013).
Marine weather at LGF was characterized by 25 km resolution European Reanalysis (ERA5) and NOAA Coupled Forecasts (CFS2) (Hersbach et al., 2020; Saha et al., 2014) for surface winds, total heat balance and net solar radiation. Environmental impacts of the 2017 hurricanes were studied via hourly gauge sea level, buoy SST, daily wind time series and satellite vegetation color fraction. Currents and salinity were analyzed for 2018-2019 during dinoflagellate blooms in LGF, as Hovmoller plots on a N-S slice 65.6W in 2018-2019, and as maps for 10 Oct. 2019 and 9 Nov. 2020.
Within the longer records, we found that satellite red-band radiance (Jury, 2020) was out-of-phase with our field data, so it was relegated. Instead satellite green-band chlorophyll aligned with dinoflagellate counts, while environmental conditions were represented by sea level and salinity. Pair-wise cross-correlations with satellite and reanalysis variables (cf. Table 4) were calculated to establish environmental influences over 2002-2022 and 2016-2021 respectively. Serial persistence limits the degrees of freedom so |R| > 0.20 (longer record) and > 0.38 (shorter record) reaches 98 % confidence. To understand inter-annual climate influence, 20 year time series were filtered to remove cycles below 18 months (de-seasonal). Detrended cross-correlations were analyzed for sea level, zonal wind, and salinity. Wavelet spectra were calculated to determine significant periodicity. Late summer (Aug-Nov) chlorophyll content was regressed onto fields of ERA5 surface wind, satellite SST and meridional currents around Puerto Rico 14.5-22°N & 70-60°W in the period 2002-2022.
Point measurements from buoys, gauges and stations should be supplemented with coastal weather and ocean fields over a longer time to fully explain the environmental controls on bioluminescence in a coastal lagoon. These methods distinguish our work from most field studies with narrow sampling windows confined to in-situ measurements.
Results
Characteristics of field data: Field data (Table 1, Table 2, Fig. 2A) exhibit wide fluctuations of dinoflagellate density in LGF, with monthly counts ranging from 4 388 cells/l in Jun 2018 to 2.19 106 cells/l in Nov 2019. Statistical tests quantify the large intra-seasonal variability: Kruskal Wallis: H = 105.43, P < .001 (Table 3, Fig. 2B). Annual dinoflagellate minima/maxima were noted in the cool dry / warm wet season. Densities were low in 2016-17 compared with 2018-20 (Fig. 2C), yielding significant inter-annual variability (Kruskal Wallis: H = 182.26 P < .001). Spatial heterogeneity between collection sites in the 50-ha saltwater coastal lagoon was significant (Kruskal Wallis: H = 33.05, P < .001) (Table 4, Fig. 2D).
Table 1 Descriptive statistics of dinoflagellate density (ind/l) by month 2016-2021 at LGF.
| Jan | Feb | Mar | Apr | May | Jun | Jul | Aug | Sep | Oct | Nov | Dec | |
| Mean | 262 523 | 306 823 | 334 224 | 77 687 | 78 500 | 302 931 | 144 706 | 690 132 | 379 409 | 831 808 | 1 062 000 | 736 072 |
| Std. Dev. | 380 777 | 321 594 | 416 978 | 63 775 | 91 233 | 548 597 | 280 487 | 797 234 | 620 360 | 915 352 | 940 367 | 588 353 |
| Min. | 15 667 | 17 944 | 5 474 | 36 727 | 22 556 | 4 833 | 7 328 | 10 000 | 23 556 | 142 278 | 31 000 | 128 000 |
| Max. | 701 050 | 629 300 | 877 300 | 151 167 | 183 778 | 1 124 000 | 646 250 | 1 654 000 | 1 475 000 | 2 160 000 | 2 190 000 | 540 000 |
Table 2 Descriptive Statistics of dinoflagellate density by year at LGF (months sampled).
| 2016 (6) | 2017 (9) | 2018 (11) | 2019 (12) | 2020 (10) | 2021 (10) | |
| Mean | 135 425 | 41 559 | 538 557 | 781 167 | 513 659 | 287 464 |
| Std.Dev. | 235 878 | 48 196 | 795 056 | 665 465 | 468 503 | 237 243 |
| Min. | 7 328 | 5 474 | 4 833 | 22 556 | 29 950 | 103 301 |
| Max. | 598 390 | 151 167 | 2 176 000 | 2 200 000 | 1 591 000 | 857 000 |
Table 3 Tukey test to compare dinoflagellate density by month.
| Months | Months | Mean Diff. | SE | t | P tukey |
| 1 | 11 | -817 016 | 168 621 | -4.845 | < .001 |
| 2 | 11 | -729 254 | 161 995 | -4.502 | < .001 |
| 3 | 10 | -567 362 | 163 138 | -3.478 | 0.026 |
| 3 | 11 | -822 945 | 162 654 | -5.059 | < .001 |
| 4 | 8 | -610 321 | 174 368 | -3.5 | 0.025 |
| 10 | -748 680 | 180 020 | -4.159 | 0.002 | |
| 11 | -1.004e +6 | 179 582 | -5.592 | < .001 | |
| 12 | -655 815 | 179 582 | -3.652 | 0.015 | |
| 5 | 8 | -604 420 | 176 914 | -3.416 | 0.032 |
| 10 | -742 779 | 182 487 | -4.07 | 0.003 | |
| 11 | -998 362 | 182 055 | -5.484 | < .001 | |
| 12 | -649 914 | 182 055 | -3.57 | 0.019 | |
| 6 | 10 | -529 537 | 159 435 | -3.321 | 0.044 |
| 11 | -785 120 | 158 941 | -4.94 | < .001 | |
| 12 | -436 672 | 158 941 | -2.747 | 0.205 | |
| 7 | 8 | -538 008 | 143 392 | -3.752 | 0.01 |
| 10 | -676 367 | 150 213 | -4.503 | < .001 | |
| 11 | -931 951 | 149 688 | -6.226 | < .001 | |
| 12 | -583 502 | 149 688 | -3.898 | 0.006 | |
| 8 | 10 | -359 182 | 156 738 | -2.292 | 0.483 |
| 11 | -614 765 | 156 234 | -3.935 | 0.005 | |
| 9 | 11 | -614 765 | 156 234 | -3.935 | 0.005 |
P-value adjusted for 11 degrees of freedom.
Table 4 Tukey Test comparison of dinoflagellate density by sampling site.
| Station | Mean Diff. | SE | t | P tukey | |
| 1 | 2 | -512 391 | 85 151.3 | -6.017 | < .001 |
| 3 | -496 792 | 85 151.3 | -5.834 | < .001 | |
| 4 | -482 426 | 165 677 | -2.912 | 0.019 | |
| 2 | 3 | 15 599 | 85 230.2 | 0.183 | 0.998 |
| 4 | 29 965 | 165 717 | 0.181 | 0.998 | |
| 3 | 4 | 14 366 | 165 717 | 0.087 | 1 |
P-value adjusted for 4 degrees of freedom.
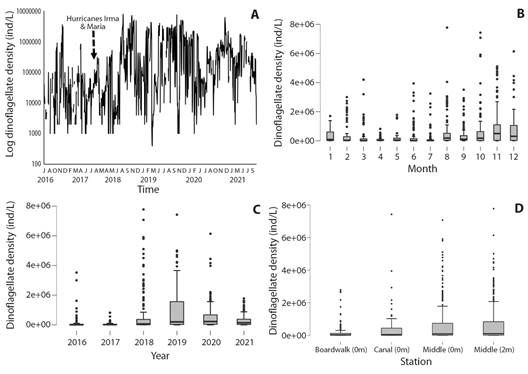
Fig. 2 Variability of dinoflagellate density over six year sampling period by: A. Time series of twice-monthly in-situ dinoflagellate density at LGF. B. Month. C. Year. D. Station. Box-whisker plots with median, upper/lower quartiles and outliers.
Comparison with in-situ environmental variables: Discharge and buoy data time series tended to have skew distributions requiring non-parametric tests. Marine environmental conditions off Fajardo (Fig. 3A, Fig. 3B, Fig. 3C, Fig. 3D, Fig. 3E, Fig. 3F) exhibited noteworthy seasonality: lowest air pressure, weakest average winds; warmest air and sea temperatures and lowest salinity all occurred in the Aug-Nov period. River discharge exhibited large inter-annual fluctuations (Tukey Test: T > 2.3 P < 0.05) unrelated to offshore salinity. Throughout 2016 and early 2017 salinity was high, then declined in 2018 and remained low in subsequent years. Most marine environmental variables were poorly correlated with dinoflagellate density in LGF (Table 5), except salinity (R -0.56), explaining 1/3 of variance (Fig. 4A). Salinity adjustments within LGF may be related to runoff, but current advection may control open ocean conditions (Fig. 4B).
Table 5 Correlation of Fajardo discharge and buoy time series with monthly dinoflagellate density 2016-2021.
| Variable | Spearman Coefficient | Dinoflag. (ind/l) | WDIR (o) | WSPD (m/s) | WGST (m/s) | Pressure (hPa) | airTemp (oC) | seaTemp (oC) | Salinity (‰) |
| WDIR | R-value | -0.218 | -0.538 | ||||||
| P-value | 0.15 | < .001 | |||||||
| Pressure | R-value | -0.204 | -0.466 | 0.625 | 0.619 | ||||
| P-value | 0.179 | < .001 | < .001 | < .001 | |||||
| airTemp | R-value | 0.113 | 0.043 | -0.306 | -0.337 | -0.552 | |||
| P-value | 0.461 | 0.763 | 0.029 | 0.016 | < .001 | ||||
| seaTemp | R-value | 0.121 | 0.095 | -0.417 | -0.445 | -0.635 | 0.979 | ||
| P-value | 0.451 | 0.557 | 0.008 | 0.004 | < .001 | < .001 | |||
| Salinity | R-value | -0.559 | 0.028 | 0.278 | 0.231 | 0.305 | -0.139 | -0.212 | |
| P-value | < .001* | 0.864 | 0.083 | 0.151 | 0.056 | 0.392 | 0.172 | ||
| Discharge | R-value | -0.068 | 0.030 | -0.056 | -0.047 | -0.384 | 0.309 | 0.328 | -0.097 |
| P-value | 0.644 | 0.833 | 0.697 | 0.742 | 0.006 | 0.028 | 0.032 | 0.534 |
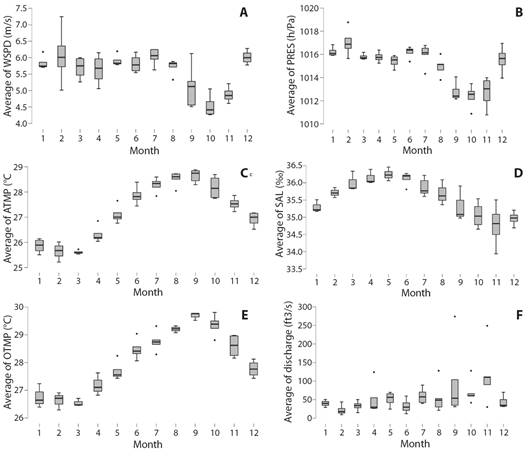
Fig. 3 Box-whisker plots (median, quartiles, outliers) indicating seasonal cycles and inter-monthly variability of: A. Wind speed (m/s). B. Air pressure (hPa). C. marine air temperature (°C). D. salinity (‰). E. Sea temperature (°C). F. Fajardo River discharge (ft3/s).
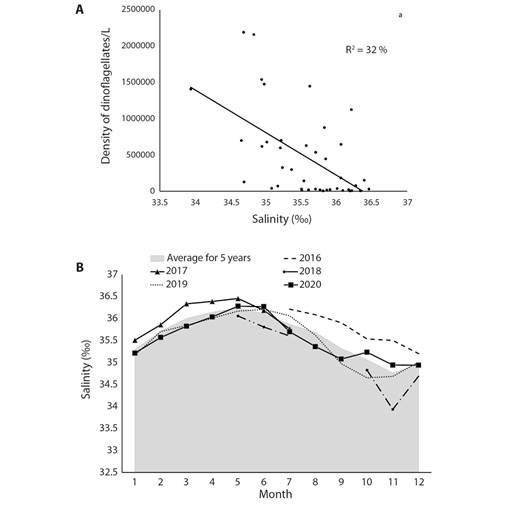
Fig. 4 A. Regression of buoy salinity and dinoflagellate density at LGF. B. Temporal cycles of salinity during the monitoring period, lines indicate monthly salinity per year, shaded is the average.
Wider context with satellite reanalysis data: Mapping the long-term average marine conditions Fig. 5A, Fig. 5B and Fig. 5C we find HYCOM3 salinity gradients between Atlantic 35.9 ‰ and Caribbean 35.4 ‰ waters. Currents sweep Southwestward through the Virgin Islands and turn Northwestward 0.1 m/s near Fajardo. Satellite SST are warmer in the Caribbean (28 °C), leeward of the Antilles Islands. Trade winds prevail at ~ 6 m/s and induce Ekman transport that draws seawater Northward off Fajardo. Time series of daily sea level (Fig. 6A) show rising trends and annual cycling that crests in late October. Higher tides are evident in 2012, 2014, 2015, 2018, 2019, 2021, that tend to flush LGF. Time series of daily SST and salinity (Fig. 6B) show a delayed inverse relationship: warmer sea temperatures are followed by lower salinity. SST shows little trend, while salinity at Fajardo declined after the drought in 2015 and salty spell of 2016-17. Salinity below 34.5 ‰ was evident during late summer (Oct-Nov) of 2019-22, due to an influx of South American river plumes. Time series of daily winds and waves (Fig. 6C) are pulsed by tropical cyclones and trade wind surges. Over the 20-year period, 2014-16 had low waves while 2004-10 and 2019-22 saw high wave heights. Although hurricanes generate peak events at Fajardo (Sep 2017), wave action along this coast is diminished by upstream islands and shallow bathymetry.
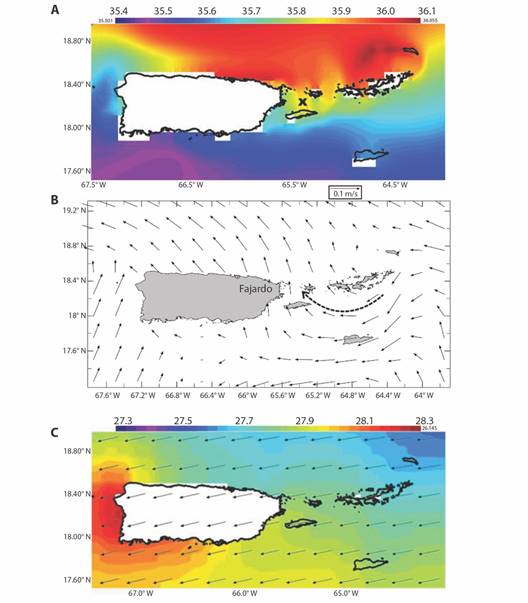
Fig. 5 Long-term mean maps of: A. HYCOM surface salinity (‰). B. Surface currents (largest 0.1 m/s), dashed arrow highlights inflow. and C. GHR satellite sea surface temperature and ERA5 winds (largest vector 7 m/s).
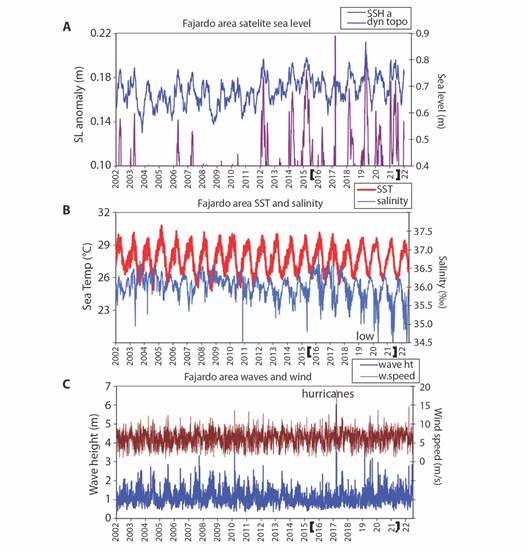
Fig. 6 Daily time series of A. Sea level and anomalous high tides at Fajardo, B. SST and salinity, and C. Wind speed and wave height, identifying key features and storm events, field monitoring bracketed, annual tick marks in July.
Turning our attention to seawater color, the satellite green-band radiance (CHLa) map for Oct 2019 is illustrated in Fig. 7A. High values hug the coast around LGF, and in leeward zones of the Virgin Islands and Puerto Rico. Mean annual cycles are investigated in Fig. 7B, Chlorophyll rises from Jul-Nov (warm wet season) and reaches a minimum in Jan-Apr (cool dry season). Northward currents are bi-modal and peak in summer and winter as trade winds induce Ekman transport. Sea level dips in Mar-Apr and crests broadly from Aug-Nov during infiltration of South American river plumes. Monthly satellite chlorophyll time series and LGF dinoflagellate counts are plotted in Fig. 7C. The green-band radiance shows high values in 2004, 2009-10, and low values from 2012-2017 that correspond with LGF data. Sustained high chlorophyll content in 2019-2022 coincides with dinoflagellate density above 106/l.
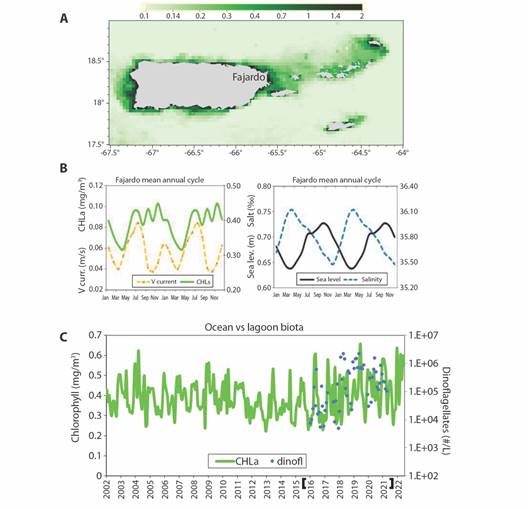
Fig. 7 A. VIIRS satellite chlorophyll map for Oct 2019 (mg/m3) when blooms were recorded in LGF. B. Mean annual cycle of chlorophyll and Northward currents (left) and sea level and salinity. C. Time series of CHLa at Fajardo 2003-2022, field monitoring bracketed on y-axis, annual tick marks on July. (CHLa and salt use right-hand axes in b).
Pair-wise cross-correlations of the Fajardo chlorophyll time series with continuous monthly satellite reanalysis variables 2002-2022 (A) (Table 6) reveals significant associations with SST, atmospheric convection (net OLR) and land vegetation color which reflect how seasonal warming enhances Aug-Nov rainfall and canopy growth. The cross-correlation of LGF dinoflagellates with most environmental variables is weak (B) (Table 6), only sea level is significantly associated, followed by vegetation, solar radiation and salinity. Although satellite chlorophyll and in-situ dinoflagellate counts are weakly associated, they share relationships with many environmental variables.
Table 6 Cross-correlation of: A. Monthly green-band radiance (CHLa) at Fajardo and marine climate variables from coupled reanalysis 2002-2022, B. Correlation of monthly dinoflagellate density and the same variables 2016-2021.
| A | CHLa | CHLa | B | Dinoflag. | Dinoflag. | |||
| MLD | -0.13 | U wind | -0.06 | MLD | 0.01 | U wind | 0.06 | |
| salinity | -0.11 | V wind | 0.09 | Salinity | -0.24 | V wind | -0.03 | |
| SST | 0.27 | Waves | 0.18 | SST | 0.15 | Waves | 0.09 | |
| U curr | 0.18 | net heat | -0.09 | U curr | 0.16 | net heat | -0.13 | |
| V curr | 0.05 | Euph Z | -0.19 | V curr | -0.04 | Euph Z | -0.12 | |
| sea level | 0.17 | dust | 0.17 | sea level | 0.4 | dust | -0.18 | |
| net OLR | -0.27 | Ek V | -0.05 | net OLR | 0.06 | Ek V | -0.22 | |
| Veget | 0.36 | solar | -0.19 | Veget | 0.27 | solar | -0.26 | |
| CHLa | 0.15 |
Bold values have P < .02; acronyms: MLD mixed layer depth, SST sea surface temp, U V vector components, curr. currents, n OLR net outgoing longwave radiation, net heat balance of components, Euph Z euphotic depth or water clarity, optical dust extinction, Ek V Northward Ekman transport, and net solar radiation.
With sea level being significantly correlated with bioluminescent algal blooms at LGF, it is inferred that flushing action by high tides in Aug-Nov is beneficial. However, extreme mechanical stress during storm surges may not be. Having earlier noted high dinoflagellate counts in late 2018 and 2019, we focus on environmental conditions during that era by analysis of salinity and currents.
A case of Northward currents and low salinity is mapped in Fig. 8A. This pattern coincides with bioluminescent dinoflagellate blooms in LGF. Currents in the Atlantic sector is Eastward and decline near Fajardo, where they meet Northward currents coming from the Caribbean sector. A strong salinity gradient is sustained. The canal connecting LGF with the open ocean faces the Caribbean and thus entrains low salinity seawater. Dinoflagellate density during this time reached 5-7 million /l. A hovmoller plot of salinity along the East coast (Fig 8B) shows that pulses of low salinity from the Caribbean in Aug-Nov in 2018 and 2019. Surplus precipitation over evaporation and the Northward spread of river plumes from South America account for these changes.
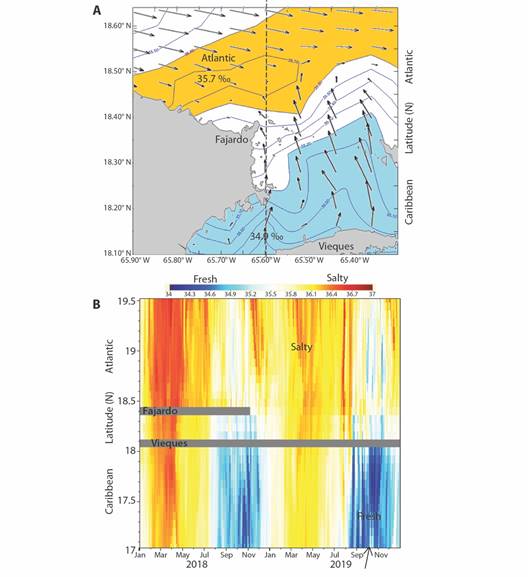
Fig. 8 A. Hycom surface currents (vector largest 0.2 m/s) and salinity (‰) on 10 Oct 2019 during a dinoflagellate bloom in LGF. B. Hycom surface salinity hovmoller plot N-S on 65.6W off Fajardo in 2018-19, arrow identifies map date.
Analysis of inter-annual variability: To understand inter-annual variability, the 20 year records of Fajardo Sea level, wind and salinity were filtered for oscillations above 18 months. Fig. 9A, Fig. 9B and Fig. 9C illustrate time series that exhibit some coherence. Simultaneous cross-correlations between sea level and salinity are -0.74 and between sea level and U wind -0.59. These outcomes say that increased trade winds (-U) draw low saline water from the Caribbean during high tides.
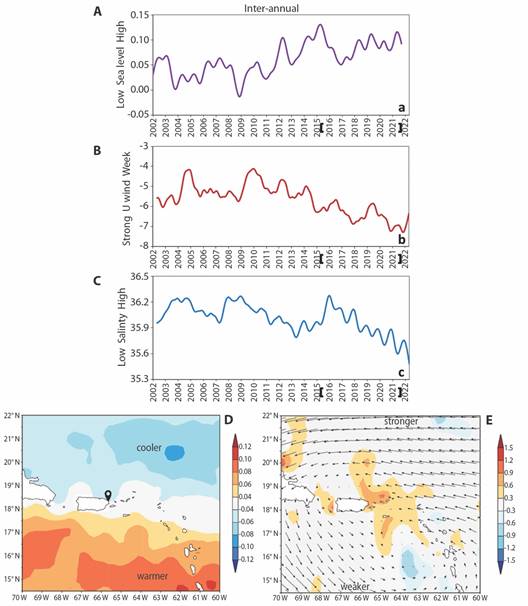
Fig. 9 Inter-annual filtered satellite reanalysis time series at Fajardo: A. Sea level. B. U wind. C. salinity, with field monitoring bracketed, annual tick marks on July. Inter-annual regression of CHLa time series onto Aug-Nov fields 2002-2022: D. SST (shaded /°C) Fajardo , and E. meridional current (shaded + Northward, /m s-1) and wind (vector anomalies, largest 2 m/s).
Wavelet spectral analysis (not shown) found significant oscillations at ~ 3.5 year for sea level and zonal wind, and ~ 7 year periods for CHLa and salinity. These rhythms derive from the Atlantic Walker Circulation (Jury & Nieves Jiménez, 2020). A striking feature in Fig. 9B, Fig. 9C is the downtrend in U wind and salinity since 2016 and sustained high tides since 2018. Increased Northward Ekman transport is linked to faster Atlantic trade winds and account for the uptick in bioluminescent dinoflagellates after 2017.
To characterize spatial patterns of inter-annual variability, the chlorophyll time series was regressed onto Aug-Nov environmental fields 2002-2022 (Fig. 9D, Fig. 9E). A N-S dipole pattern emerges: phytoplankton blooms relate to weaker trade winds / warmer SST in the Caribbean, and stronger trade winds/cooler SST in the Atlantic. Aug-Nov chlorophyll concentrations at Fajardo are stimulated by Northward currents off the East coast of Puerto Rico that entrain Caribbean waters (Fig. 9E). The N-S dipole pattern and trends (cf. Fig. 9B, Fig. 9C) suggest a Northward expansion of trade winds consistent with climate change impacts.
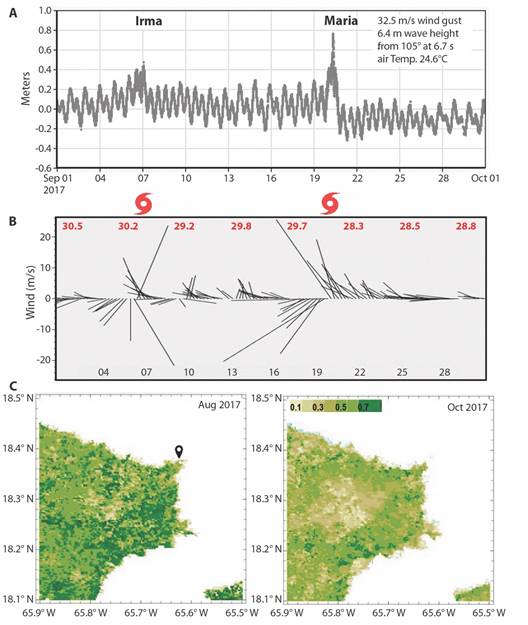
Hurricanes: Northeastern Puerto Rico experienced eight tropical cyclones during the field campaign 2016-2021; hurricanes in 2017 impacted the LGF environment via 6 m waves, 0.8 m tidal surge, and 32 m/s winds that stripped vegetation (Fig. 10A, Fig. 10B, Fig. 10C). Hurricane Maria changed structural and functional features in the lagoon. It dropped local SST from 30.5° to 28.3 °C and salinity from 35.5 ‰ to 34.4 ‰ in Sep 2017, creating thermodynamic conditions for dinoflagellate blooms in LGF - following recovery from initial mechanical stress (Fig. 1D and Fig. 2B).
Discussion
During this study we found widely fluctuating dinoflagellate densities at LGF: rising in late summer and declining in late winter, similar to seasonal patterns of P. bahamense in Tampa Bay, where sea temperatures modulate cyclical blooms. The greatest dinoflagellate densities at LGF coincided with high tides and low salinity from Aug-Nov. While our short-term monitoring uncovered frequent and intense blooms in 2018-2021, (Hinder et al., 2012) found a down-trend of dinoflagellate densities in the Northeast Atlantic due to increasing SST and wind speed. That study challenged the view that algal blooms are on the rise and found that previously abundant dinoflagellates C. furca and Protoperidinium spp. have diminished. Pre-hurricane results at LGF showed a similar effect, when stakeholders reported bioluminescent ‘blackouts’. After the storm surges in 2017, our study found sustained blooms that boosted eco-tourism.
Similarly, Hurricanes of 2017 in Florida’s coastal waterways caused enhanced nutrient loads which drove P. bahamense blooms in the Indian River Lagoon and Lake Okeechobee (Philips, 2020). This study reported blooms immediately after Hurricanes due to exceptionally high rainfall resulting from large inflows of nutrient-rich water to the waterbodies through increases in dissolved inorganic nitrogen, intense re-suspension of muddy flocculent bottom sediments, resulting in high total suspended solids concentrations and increased nutrient concentrations through sediment re-suspension and re-mineralization of nutrients from damaged aquatic vegetation (e.g. seagrasses) and damaged terrestrial biomass in the watershed. These key processes were also observed in LGF following Hurricanes Irma and Maria explaining the P. bahamense in the following years, i.e.2018 and 2019.
Increased sea level and lower salinity favored dinoflagellate growth in the longer-term, and these two are linked (Fig. 11A). Given that plumes of seawater come from the Orinoco and Amazon Rivers; the salinity budget depends on the relative flux of Caribbean versus Atlantic seawater. Tropical climate patterns modulate Fajardo daily sea level, as evidenced by regression onto Aug-Nov fields of netOLR 2002-2022 (Fig. 11B) which show that a dry climate in the East Pacific contributes to high tides which support bioluminescence.
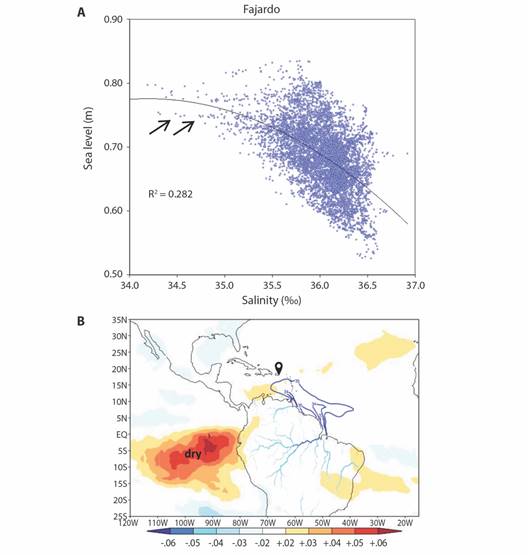
Fig. 11 A. Scatterplot of daily EC sea level and HYCOM salinity 2002-2022 and regression fit; arrows point to conditions favoring bioluminescence in LGF. B. Regression of daily sea level at Fajardo onto Aug-Nov 2002-2022 field of net OLR (/W m-2). South American river discharge and plume edge shown by blue contours > 1000 m3/s (land) and < 35‰ (sea).
The late summer peak in dinoflagellate counts at LGF is like the higher latitudes (Hinder et al., 2012; Marcinko et al., 2013, Lopez et al., 2021). Light winds and mixed layer response to seasonal heating promote algal blooms. Naturally these macro-scale studies do not capture local effects such as the dip in LGF dinoflagellates during mid-summer, when strong Easterly winds bring Saharan dust plumes (Angeles et al., 2010; Jury & Nieves Jiménez, 2020).
The environmental health of tidal lagoons is vital to coastal tourism and ongoing resource management. Our LGF results revealed that: 1) dinoflagellate counts fluctuate widely-often surprising our monitoring team, 2) bioluminescent dinoflagellates are sensitive to small changes in environmental conditions-subtropical islands experience limited seasonality so biota have a narrow physiological range and few opportunities to adapt, 3) hurricanes ‘rake and refresh’ the marine environment for subsequent bioluminescent blooms following recovery-an inference requiring further data, and 4) intra-seasonal fluctuations of LGF dinoflagellate density relate to ocean-atmosphere thermodynamic conditions, the salinity budget and sea level. We recommend continued monthly in-situ monitoring of LGF biota and on-going support for marine observations to guide conservation strategies of this natural resource, amidst a changing climate.
Ethical statement: the authors declare that they all agree with this publication and made significant contributions; that there is no conflict of interest of any kind; and that we followed all pertinent ethical and legal procedures and requirements. All financial sources are fully and clearly stated in the acknowledgments section. A signed document has been filed in the journal archives.

