


 Inglés (pdf)
 Articulo en XML
 Referencias del artículo
 Enviar articulo por email
 Citado por SciELO
  Similares en
SciELO
Similares en
SciELO  uBio
uBio 
 Permalink
Introduction
The creation of biological reserves allows conservation efforts to be prioritized for habitats and species housed in these restricted geographic areas (Hamaide et al., 2006; Pacheco & Vasconcelos, 2007; Rocha-Ortega et al., 2023). These locations are typically situated far from urban areas because they involve the transformation of natural habitats, resulting in biodiversity loss, habitat fragmentation, and pollution (Brassard et al., 2021; Luo et al., 2023; Van-Proosdij et al., 2016; Walters et al., 2019). A current conservation strategy in highly urbanized landscapes is the implementation of green spaces (Liu et al., 2019; Santos et al., 2019). Various studies have reported that urban areas with intact remnants of native vegetation hold excellent potential for biodiversity conservation (Aronson et al., 2017; Luo et al., 2023; MacGregor-Fors et al., 2016; Santos et al., 2019). They often harbor many native species from the surrounding region, providing suitable nesting and feeding sites (Aronson et al., 2014; Brassard et al., 2021; Ives et al., 2016; Lepczyk et al., 2017; Uno et al., 2010). These areas can even become refuges for endemic species and other species of conservation interest at both the regional and global scales (Aronson et al., 2014; Ives et al., 2016; Reyes-López & Carpintero, 2014; Rocha-Ortega et al., 2023). Knowledge of the biodiversity associated with the urban environment can contribute to the development and promotion of methods for its conservation (Uno et al., 2010). Thus, parks designed for recreational purposes for the population can play a crucial role as refuges for fauna in the context of urban expansion (González-García et al., 2009). However, knowledge of how land management and landscape design can influence the different community structures of urban parks is scarce (Luo et al., 2023).
Arthropods are considered suitable models for analyzing biodiversity in urban habitats (MacGregor-Fors et al., 2016; Philpott et al., 2014; Sanford et al., 2008). Among them, ant species are used as indicators and detectors to assess environmental changes resulting from human activities (Andersen et al., 2002; Gómez-Otamendi et al., 2018; Rodríguez de León et al., 2023) and provide information on the degree of conservation or disturbance (Gutiérrez-Martínez, 2014; Tejeda-Cruz et al., 2008). The reason is their high number of evolutionary and ecological interactions with other species (Moreau et al., 2006), wide diversity, abundance, and behavioral plasticity (Agosti & Alonso, 2000).
Studies on the taxonomic and functional diversity of ants in urban environments have been conducted to determine the effects of the structural characteristics of these spaces on ant communities (Brassard et al., 2021; Luo et al., 2023; Reyes-López & Carpintero, 2014; Rosas-Mejía et al., 2020; Santos et al., 2019; Uno et al., 2010). Important predictors of ant species richness in urban and suburban areas include extensive vegetation coverage and a high percentage of canopy cover (Pacheco & Vasconcelos, 2007; Rocha-Ortega et al., 2023; Santos et al., 2019). These variables favor the supply of food resources for ants (Leal et al., 2012; Farajollahzadeh et al., 2023; Mendonça-Santos et al., 2023), allowing areas with these characteristics to potentially serve as reservoirs for native species, as well as other components of fauna and flora. However, these areas generally lack the management and structure to ensure their functions. In 2015, the “El Refugio” State Park (PER), located in the Northeast region of Mexico, was designated as a protected natural area (Periódico Oficial del Estado de Tamaulipas, 2019). It is characterized by the maintenance of areas with intact native vegetation even though it is situated in an urban area. This PNA includes five vegetation structure types, ranging from low deciduous forest to secondary vegetation (Luo et al., 2023; Mora-Olivo & Martínez-Avalos, 2012).
The objective of this study is to evaluate the structure of ant communities in the different vegetation structure types of the PER. Therefore, we pose the following questions: (i) What is the degree of influence of urbanization on the structure of ant communities? (ii) What is the degree to which the vegetation structure type influences the diversity and abundance of ant species? (iii) What is the conservation status of the PER according to ecological indicators? This research formulates the following hypotheses: (i) The structure and composition of ant communities differ between areas with native vegetation and those areas more influenced by urbanization in the “El Refugio” State Park. (ii) Indicator species will reflect the conservation status of this state park. Our study contributes to understanding the conservation status of a PNA within an urban area in the Northeast region of Mexico, potentially leading to proposals for biodiversity conservation.
Materials and methods
Study area: This study was conducted in the protected natural area designated “El Refugio” State Park (PER) (23°43’39” N & 99°07’19” W), which is located within the urban zone of Ciudad Victoria at an altitude of 316 m.a.s.l. in the state of Tamaulipas, Mexico (Instituto Nacional De Estadística y Geografía (INEGI), 2017). The PER covers a total area of 28.1 ha, with 10.16 ha designated as the recovery zone, where natural resources have been severely altered or modified and are subject to a rehabilitation program. Another 10.58 ha constitutes the core zone or restricted-use subzone, an area with good conservation status, and 7 425 ha is used for public activities (Periódico Oficial del Estado de Tamaulipas, 2019).
The study area experiences an average annual temperature of 24 °C and an average annual precipitation of 926 mm. It is characterized by a semihumid warm climate throughout the year and a summer rainfall regime (INEGI, 2017). It features remnants of natural vegetation from the Tamaulipan thornscrub ecosystem (MET), as well as secondary vegetation (VS), lowland jungle (SB), interlaced grassland-Tamaulipan thornscrub (PMET), and grassland area (PAS) (Mora-Olivo & Martínez-Avalos, 2012).
Ant community composition. field sampling: The study was conducted from April to July 2022, aligning with the rainy season in the area. A total of 8 sites, categorized by vegetation type, were visited to analyze ant community structures within the “El Refugio” State Park. These sites were separated by at least 200 m, considering the limited size of the area.
Sampling design: A 100 m transect was established within each site. Subsequently, two methods were employed to determine the spatial and temporal distributions of ant species (Agosti & Alonso, 2000). Pitfall traps were used for sampling active epigeic ant species (foraging on the surface), and bait traps were deployed to detect the temporal (diurnal) division of ant community activity (Devenish et al., 2021).
Pitfall Trapping: Within each 100 m transect, twenty pitfall traps were placed at 5 m intervals along each transect at each site to sample the ant community structure. Each pitfall trap consisted of a 150 ml plastic cup, which was buried flush with the surface. Additionally, 50 ml of soapy water was added to each trap (Agosti & Alonso, 2000), and the traps were exposed for a period of 72 h.
Bait Trap Sampling: Ten bait traps were positioned along each 100 m transect at 10 m intervals to monitor diurnal species activity and temporal variation in the ant community structure during the day (King & Porter, 2005; Parr et al., 2004). Each bait trap consisted of 5 g of a mixture of tuna (Aurrera brand in water with oil®) and honey (Great Value®) placed on a 10 cm² piece of laminated white cardboard.
Bait traps were set at 08:00 h (morning), 12:00 h (noon), and 16:00 h (afternoon). This method is widely used and favors the detection of dominant ant species (Porter & Savignano, 1990). After 1 h, species occurrence (rather than the number of individuals) was recorded by collecting ants from each bait trap. The collected material was stored in absolute alcohol for preservation and subsequent identification. The collected ants were preserved in undenatured 99.8 % absolute ethanol, identified at the species level when possible, and taxonomic keys by Mackay and Mackay (1989) were used for genus, while corresponding keys were used for the species level. For species identification, they were mounted according to international standards (Lattke, 2003). Vaucher specimens were deposited in the Ant Collection of the Laboratorio de Zoología, Instituto de Ecología Aplicada of the Universidad Autónoma de Tamaulipas in Ciudad Victoria, Tamaulipas, México. A copy of the specimens was also deposited in the Entomological Collection of the Center for Zoological Studies at the Universidad de Guadalajara, México.
Environmental variables: Data on average relative humidity and ambient temperature were obtained from the National Meteorological Service-National Water Commission (CONAGUA, 2022).
Habitat characterization: The vegetation structure of the “El Refugio” State Park was measured, establishing types according to the classification: Land Use and Vegetation scale 1:250 000, series VI, which the Instituto Nacional de Estadística y Geografía (INEGI) developed between the period 2014 and 2017 (INEGI, 2017). At each site, vegetation characteristics, including richness and abundance, were measured for association with the ant community composition. Within each 100 m transect, five randomly placed 1 × 1 m quadrats were established for the assessment of herbaceous plants under 30 cm and ground cover. The total number of herbaceous plants within the quadrat and their height were recorded. Similarly, two 2.5 x 5 m quadrats were established for the evaluation of shrubs (height between 0.3 and 3 m), counting the total number of shrubs, their height, and coverage. Finally, a 10 x 10 m quadrat was established, and all trees taller than 3 m in height were counted and identified. The circumference at breast height, canopy coverage, and height of each tree were measured. From these measurements, averages were obtained to create categories of vegetation cover, such as high, medium, and low coverage (Sánchez-Reyes et al., 2021; Uno et al., 2010).
Data analysis. sampling completeness: The completeness of the ant sampling was estimated using rarefaction and extrapolation curves for each vegetation type. This estimation was performed with incidence frequency data in the R program (R Core Team, 2018; version 3.0.1) using the iNEXT package (Chao & Jost, 2012; Chao et al., 2016; Hsieh et al., 2016).
Richness and diversity among vegetation types: The alpha diversity for each vegetation type was calculated with Hill numbers (effective number of species), where N0 represents species richness (completely insensitive to species frequencies), N1 (exponential of Shannon) represents the number of abundant species, and N2 (inverse of Simpson) represents the number of very abundant or dominant species in the sample (Moreno et al., 2011). The similarity of ant species diversity among the different vegetation types was analyzed using the Jaccard index. This analysis was performed with the R program (R Core Team, 2018; version 3.0.1) using the abdiv library and the Jaccard () function, which considers the number of shared species as well as the species present at each site. Dissimilarity was also considered, where one was subtracted from the similarity result.
Indicator value (IndVal): The indicator species for each vegetation type were determined using the indicator species value (IndVal) method proposed by Dufrêne y Legendre (1997), which is based on the degree of specificity (Aij) to a particular environment and the degree of fidelity (Bij) measured by the frequency of occurrence within the same environment. These parameters were independently evaluated for each species with the formula IndValij = Aij x Bij x 100. The indicator value was obtained through Monte Carlo simulations (100 000), representing whether a species is indicative of the site or habitat. A species with a P value < 0.05 and a percentage greater than 50 % was considered an indicator species. A species with a percentage less than 50 % but greater than 25 % was considered a detector species for the vegetation type. This method was performed using the IndVal () function from the labdsv package in R (version 3.0.1).
Associations between environmental and biological variables and multiple correspondence analysis: Microenvironments were determined based on climatic variation (ambient temperature and relative humidity) present in the sampling sites (Table 1). These microenvironments, along with the variable vegetation type, were associated with the occurrence and abundance of ant species according to multiple correspondence analysis through the STATISTICA program (version 12, StatSoft. 1984-2014). The analysis is a modification of the chi-square test, which involves reducing numerical dimensions to a space with multiple dimensions to visualize the relative position of variable categories (Sourial et al., 2010).
Table 1 List of Formicids from “El Refugio” State Park in Ciudad Victoria, Tamaulipas, Mexico.
| Subfamily | Species |
| Dolichoderinae | Dorymyrmex insanus (Buckley, 1866) |
| Forelius mccooki (McCook, 1879) | |
| Forelius damianiGuerrero & Fernández, 2008 | |
| Formicinae | Camponotus planatus Roger, 1863 |
| Camponotus atriceps (Smith, F., 1858) | |
| Myrmecocystus placodops (Forel, 1908) | |
| **Nylanderia austroccidua (Trager, 1984) | |
| Paratrechina longicornis (Latreille, 1802) | |
| Myrmicinae | Atta mexicana (Smith, F., 1858) |
| Cephalotes texanus (Santschi, 1915) | |
| Crematogaster atra Mayr, 1870 | |
| Crematogaster opaca Mayr, 1870 | |
| Cyphomyrmex rimosus (Spinola, 1851) | |
| Monomorium minimum (Buckley, 1867) | |
| Mycetomoellerius turrifex (Wheeler, W.M., 1903) | |
| Mycetosoritis hartmanni (Wheeler, W.M., 1907) | |
| Pheidole constipata Wheeler, W.M., 1908 | |
| Pheidole floridana Emery, 1895 | |
| *Pheidole pelor Wilson, 2003 | |
| **Pheidole sciophila Wheeler, W.M., 1908 | |
| Pogonomyrmex barbatus (Smith, F., 1858) | |
| Solenopsis geminata (Fabricius, 1804) | |
| Solenopsis molesta (Say, 1836) | |
| Tetramorium spinosum (Pergande, 1896) | |
| Trachymyrmex arizonensis (Wheeler, W. M., 1907) | |
| Ponerinae | Leptogenys elongata (Buckley, 1866) |
| **Odontomachus desertorum Wheeler, W. M., 1915 | |
| Pachycondyla harpax (Fabricius, 1804) | |
| Pseudomyrmecinae | Pseudomyrmex caeciliae (Forel, 1913) |
*New record for Mexico, **new record for Tamaulipas.
Relationship between vegetation and species frequency: To analyze the relationship between species and vegetation cover density, a Chi-square test (X²) was performed, a statistical technique used for count or frequency data, mainly in contingency table analyses (López-Roldán & Fachelli, 2015). In this analysis, vegetation density data with high, medium, and low classifications were used according to averages obtained from habitat characterization, and the frequency of ant species incidence was grouped by subfamily. The analysis was performed using the Mosaic () and Assoc () functions from the vcd package in R (version 3.0.1).
Results
Ant community composition: In the total of 400 samples, 18 565 individuals were captured; these individuals belonged to five subfamilies, 22 genera, and 29 species (Table 1). Considering the entire park area, the highest number of species records was from the subfamily Myrmicinae (17), followed by the subfamily Formicinae (5). The subfamily with the lowest richness was Pseudomyrmecinae, with only one species. The genera with the highest number of species were Pheidole (4), Camponotus (2), Crematogaster (2), Forelius (2), and Solenopsis (2). In contrast, Leptogenys and Mycetomoellerius were the rarest genera, as they represented only one individual each. Nylanderia austroccidua, Odontomachus desertorum, and Pheidole sciophila were recorded for the first time in the state of Tamaulipas, and Pheidole pelor were recorded for the first time in Mexico.
The species with the highest frequency were Forelius mccooki (64), Solenopsis geminata (58), and Forelius damiani (50). Species such as F. mccooki and S. geminata were recorded in all the vegetation types within the PER.
Sampling completeness: Rarefaction and extrapolation curves based on the Hill number order suggest that the sampling completeness in the PER was 96 %. Completeness by vegetation type indicated that Tamaulipan thornscrub (MET) achieved 100 % completeness, followed by secondary vegetation (VS) at 96 % completeness and lowland jungle (SB) at 94 % completeness (Fig. 1). Moreover, the vegetation types with lower sampling completeness were grassland-thornscrub (PMET) (92 %) and grassland (PAS) (84.8 %).
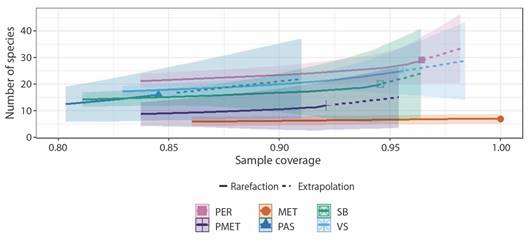
Fig. 1 Rarefaction and extrapolation curves for the five sampled vegetation types in “El Refugio” State Park. PER = “El Refugio” State Park, MET = thornscrub, PAS = grassland, PMET = grassland and thornscrub, SB = lowland jungle, VS = secondary vegetation.
Richness and diversity among vegetation types: Secondary vegetation (VS) exhibited the highest richness (N0) and species diversity (N1) (23), followed by lowland jungle (SB) (19) and grassland (PAS) (16), while Tamaulipan thornscrub (MET) had the lowest richness and diversity (7) (Table 2) and a high percentage of highly dominant species (N2) (40.99 %), unlike what was observed for secondary vegetation (VS) (13.59 %).
Table 2 Alpha diversity: Percentages of abundant and very abundant species in the vegetation types of “El Refugio” State Park (PER).
| MET | PAS | PMET | SB | VG | |
| N0 | 7 | 16 | 12 | 19 | 23 |
| N1 | 50.212301 | 27.8429965 | 25.0848364 | 30.6530205 | 20.0389117 |
| N2 | 40.9920066 | 19.1189966 | 16.6566727 | 22.086269 | 13.5912038 |
N0 = species richness, N1 = number of abundant species, N2 = number of very abundant species.
In the PER, species turnover was observed between the grassland (PAS) and grassland-Tamaulipan thornscrub (PMET) vegetation sites, as the shared species (between 65 % and 58 %) were exclusive to these types of vegetation. This result was followed by secondary vegetation (VS) and grassland-Tamaulipan thornscrub (PMET) with a similarity of 52 %. The greatest dissimilarity occurred between Tamaulipan thornscrub (MET) and secondary vegetation (VS) (69 %) and between low jungle (SB) and Tamaulipan thornscrub (MET) (70 %) (Table 3).
Table 3 Similarity and dissimilarity of Formicidae in different types of vegetation in “El Refugio” State Park.
| MET | PAS | PMET | SB | VS | |
| MET | 1 | 0.4375 | 0.58333333 | 0.3 | 0.30434783 |
| PAS | 0.5625 | 1 | 0.64705882 | 0.45833333 | 0.625 |
| PMET | 0.4166667 | 0.35294118 | 1 | 0.55 | 0.52173913 |
| SB | 0.7 | 0.54166667 | 0.45 | 1 | 0.5 |
| VS | 0.69565217 | 0.375 | 0.47826087 | 0.5 | 1 |
The upper diagonal represents the similarity, and the lower diagonal represents the dissimilarity of ant species among the different vegetation types in the PER.
Indicator value (IndVal): In the PER, only two species with a significant indicator value (P ≤ 0.05) were obtained for the different types of vegetation present at the site. The species F. mccooki was identified as an indicator of secondary vegetation (VS), while T. spinosum was an indicator of grassland (PAS) (Table 4). Species such as P. pelor and A. mexicana were identified as indicator species for lowland jungle vegetation (SB).
Table 4 Indicator Value (IndVal) of ant species indicating and detecting secondary vegetation (VS), grassland (PAS), and lowland jungle (SB) in “El Refugio” State Park.
| Indicator Value | |||
| Vegetation | Species | Ind. Val ≥ 50 % | p ≤ 0.05 |
| VS | *Forelius mccooki | 53.16 | 0.0017 |
| Pogonomyrmex barbatus | 43.46 | 0.0149 | |
| Solenopsis geminata | 36.29 | 0.0432 | |
| Pheidole constipata | 36.05 | 0.0197 | |
| Camponotus atriceps | 29 | 0.0202 | |
| Paratrechina longicornis | 20 | 0.0414 | |
| PAS | *Tetramorium spinosum | 71.16 | 0.0001 |
| Pheidole sciophila | 40.61 | 0.0044 | |
| Dorymyrmex insanus | 30.24 | 0.0406 | |
| SB | **Pheidole pelor | 30 | 0.042 |
| **Atta mexicana | 20 | 0.0182 | |
* = Indicator species, **Detector species.
Associations between environmental and biological variables and multiple correspondence analysis: Environment 1 (A1) was characterized by the presence of secondary vegetation (VS) with an average temperature of 24.7 °C and humidity of 29.3 %. Species with a greater affinity for this type of environment were F. damiani, Odontomachus desertorum, Camponotus planatus, Pogonomyrmex barbatus, Cephalotes texanus, Leptogenys elongata, Pseudomyrmex caeciliae, F. mccooki, and P. longicornis (Fig. 2).
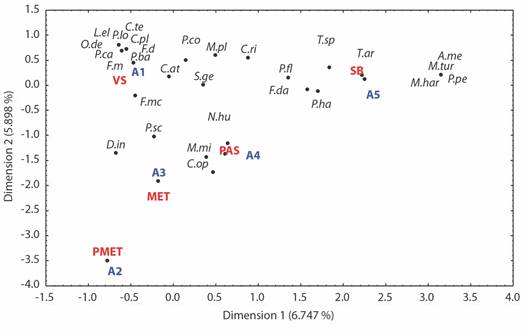
Fig. 2 Multiple correspondence analysis. Relationship of temperature, vegetation, and abundance of ant species in “El Refugio” State Park. SB = lowland jungle, PAS = grassland, MET = Tamaulipan thornscrub, VS = secondary vegetation, PMET = grassland and Tamaulipan thornscrub. A1 = Environment 1 characterized by a temperature of 24.7 °C and humidity of 29.3 %, A2 = temp. 22.5 °C and hum. 32.3 %, A3 = temp. 24.7 °C and hum. 32.3 %, A4 = temp. 25.2 °C and hum. 17.6 %, A5 = temp. 25.6 °C and hum. 26.4 %. A.me = Atta mexicana, C.at = Camponotus atriceps, C.op = Crematogaster opaca, C.ri = Cyphomyrmex rimosus, C.te = Cephalotes texanus, C.pl = Camponotus planatus, D.in = Dorymyrmex insanus, F. da = Forelius damiani, F.m = Forelius mccooki, L.el = Leptogenys elongata, M.pl = Myrmecocystus placodops, M.mi = Monomorium minimun, M.tu = Mycetomoellerius turrifex, M.har = Mycetosoritis hartmanni, N. au = Nylanderia austroccidua, O.de = Odontomachus desertorum, P.ca = Pseudomyrmex caeciliae, P.co = Pheidole constipata, P.ba = Pogonomyrmex barbatus, P.fl = Pheidole floridana, P.lo = Paratrechina longicornis, P.ha = Pachycondyla harpax, P.pe = Pheidole pelor, P.sc = Pheidole sciophila, S.ge = Solenopsis geminata, T.ar = Trachymyrmex arizonensis, and T.sp = Tetramorium spinosum.
In the case of Monomorium minimun, Nylanderia austroccidua, and Crematogaster opaca, there was a significant association with environment 3 (A3), characterized by the presence of grassland (PAS), with an average temperature of 25.2 °C and humidity of 17.6 %. Moreover, the species D. insanus and P. sciophila exhibited greater affinity for the microclimatic conditions of environment 4 (A4), characterized by the presence of thornscrub (MET), an average temperature of 25.6 °C, and humidity of 32.3 %.
Multiple correspondence analysis revealed that the species A. mexicana, P. pelor, T. spinosum, T. arizonensis, P. harpax, P. floridana, C. rimosus, F. damiani, Mycetosoritis hartmanni, and Mycetomoellerius turrifex exhibited greater associations with environment 5 (A5), which consists of lowland jungle vegetation (SB) and has an average temperature of 22.6 °C and relative humidity of 26.4 % (Table 5).
Table 5 Microenvironments (temperature, humidity, and vegetation) of the PER.
| Environments | Vegetation | Average temperature | Relative humidity |
| A1 | VS | 24.7 °C | 29.3 % |
| A2 | PMET | 22.5 °C | 32.3 % |
| A3 | PAS | 25.6 °C | 32.3 % |
| A4 | MET | 25.2 °C | 17.6 % |
| A5 | PAS | 22.6 °C | 26.4 % |
A1= environment 1, A2= environment 2, A3= environment 3, A4= environment 4, A5= environment 5. VS= secondary vegetation, PMET=grassland and Tamaulipan thornscrub, PAS= grassland, MET= Tamaulipan thornscrub, SB= lowland jungle.
Relationship between Vegetation and Species Frequency: The results of the Pearson chi-square test indicate a significant relationship between the variables in the contingency table. The Chi-square statistic (X²) is 60.817 with 6 degrees of freedom and a low P value (3.0715 e-11) (Fig. 3).
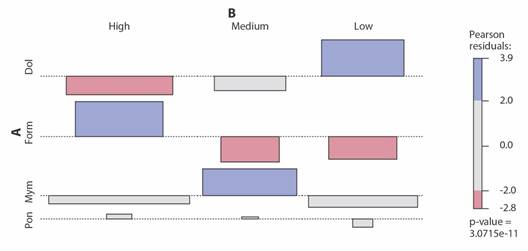
Fig. 3 Associations of subfamilies. A. with vegetation cover size. B. Pon = Ponerinae, Myrm = Myrmicinae, Form = Formicinae, Dol = Dolichoderinae. P value = 3.0715e-11.
The subfamilies Formicinae, Myrmicinae, and Ponerinae showed a significant relationship with high vegetation coverage in secondary vegetation (VS) sites. However, the subfamily Myrmicinae exhibited similar associations among the three types of vegetation coverage densities (Table 6), indicating that they had a similar frequency in all vegetation types. In contrast, the subfamily Dolichoderinae exhibited a significant relationship with low vegetation coverage consisting of grasslands, thornscrub, and a combination of both (PAS, MET, and PMET).
Table 6 Density of vegetation cover in vegetation types of the PER.
| Cover categories | Plant structure | Number of individuals | Average height | Average DAP | Shade cast | Vegetation type |
| High | Herbaceous | 94 | 16.07 cm | VS | ||
| Shrubs | 34 | 1.8305 m | 2 m | |||
| Trees | 16 | 4.622 m | 29.2333 cm | 4.70 m | ||
| Medium | Herbaceous | 85 | 15.9303 cm | SB | ||
| Shrubs | 34 | 1.2079 m | 1.2 m | |||
| Trees | 17 | 4.04 m | 21.66 cm | 4 m | ||
| Low | Herbaceous | 68 | 10.1561 cm | MET, | ||
| Shrubs | 42 | 1.25 m | 1.2 m | PAS, | ||
| Trees | 4 | 2.9166 m | 15.65 cm | 3 m | PMET |
Discussion
Ant Community Composition: In this study, 29 species were found to be rich, representing 3.19 % of the species recorded in Mexico and 12.77 % in Tamaulipas. The specific richness in this study was lower than that in works conducted in urban green areas in other countries, where the richness ranged from 33 to 116 species (Nooten et al., 2019; Pinzón-Triana et al., 2019; Trigos-Peral et al., 2020). In the Northeast region of Mexico, García-Martínez et al. (2019) recorded 32 ant species in a submontane and subtropical urban landscape, and Flores-Maldonado et al. (2021) reported 62 species in the municipality of Victoria. The low species richness in this study could be attributed to the limited area (28.1 ha), as well as anthropogenic impacts and fires affecting the PER, creating microenvironments with scarce vegetation and arid soils. Work carried out in a landscape in Brazil lists the soil ant fauna, demonstrating that the vegetation fauna contributes to the local pool of species (Vicente et al., 2016) and that the local fauna is a refuge for landscape fauna on a macroscale, whether from a park (Vicente et al., 2016) or legal reserves (Dambros et al., 2024; Vicente et al., 2018). Furthermore, Santos-Silva et al. (2016) demonstrate that the diversity of urban parks are major contributors to urban fauna compared to environments with less vegetation and less habitat complexity such as backyards.
The richness of the subfamily Myrmicinae (17 species) was notable; this subfamily is common in ant biodiversity studies because it is characterized by a wide diversity of feeding habits and specific habitat preferences (Aranda et al., 2022; Baccaro et al., 2015; Rojas-Fernández, 2001; Vásquez-Bolaños, 2020). The PER showed a high abundance of species such as Forelius damiani, Forelius mccooki, Solenopsis geminata, Dorymyrmex insanus, and Tetramorium spinosum. This abundance may be attributed to the preferences of these species for open areas with scarce vegetation cover or those that have experienced disturbances, in addition to their tolerance of high temperatures and generalist feeding habits (Creighton, 1930; Guerrero & Fernández, 2008; Mackay & Mackay, 2002; Ward, 2005; Varela-Hernández, 2013). However, species such as Atta mexicana, Mycetomoellerius turrifex, and Mycetosoritis hartmanni exhibited low abundance, likely related to their dietary and microhabitat requirements (Mueller et al., 2023; Rabeling et al., 2007; Wheeler, 1903).
Sampling Completeness: The sampling completeness for the five vegetation types comprising the “El Refugio” State Park protected natural area was 96 %, indicating a good representation of the ant community. For thornscrub (MET) vegetation, a completeness of 100 % was achieved, suggesting that the site’s maximum richness was reached (7 species), while in grassland (PAS), the completeness was 84 % (16 species). Considering that completeness percentages ≥ 80 % are satisfactorily sampled (Arenas-Clavijo & Armbrecht, 2017; García-Cárdenas et al., 2018; Gómez-Otamendi et al., 2018; Márquez-Peña & Domínguez-Haydar, 2023), this study achieved good representativeness.
Richness and Diversity among Vegetation Types: Ants exhibited high sensitivity to vegetation coverage and type in the study area, leading to a decrease in diversity when comparing vegetation types. The site with the lowest species richness was the one composed of thornscrub (MET) site, which had 7 species, in contrast to the secondary vegetation (VS) site, which had 23 species. This result could be attributed to its sparse vegetation cover (MET), as indicated by habitat characterization measurements. This result aligns with the findings of Arenas et al. (2015), who reported 6 ant species in a regeneration area consisting of shrubland, suggesting that vegetation cover influences species richness and diversity. It is also consistent with previous studies by Sanford et al. (2008), Uno et al. (2010), Begum et al. (2021), and Farajollahzadeh et al. (2023), who also noted differences in total species richness among different habitat types. These results imply that habitat type plays a crucial role in determining ant species diversity in the studied area. Jahan et al. (2022) evaluated the effects of vegetation type and habitat disturbance on species richness and found that vegetation and soil conditions can significantly affect ant diversity and overall composition. Low or high species richness and dominance depend on the availability of resources for different nutritional and microenvironmental requirements for each species (Ribas & Schoereder, 2007; Rodríguez de León et al., 2019).
Similarity was recorded between the vegetation types of grassland (PAS) and thornscrub (PMET), which shared 60 % of the registered species between the sites. D. insanus, F. damiani, and F. mccooki were observed as more abundant than the other species, as they share biological characteristics by inhabiting arid habitats with bare soil and sparse vegetation cover. These species tolerate high temperatures and exhibit varied feeding habits (AntWeb, 2023; Guerrero & Fernández, 2008; Mackay & Mackay, 2002). This finding contrasts with the results for secondary vegetation (VS) and thornscrub (MET), which exhibited significant dissimilarity, indicating that higher vegetation cover corresponds to greater species richness and diversity. These results are consistent with those of studies conducted in green areas within urban zones (Luo et al., 2023; Muhammad et al., 2022; Trigos-Peral et al., 2020). This relationship is tied to the conservation status of each vegetation structure, as documented in diversity studies within the family Formicidae (Gómez-Otamendi et al., 2018; Ramírez-Barajas et al., 2019). The high species richness in secondary vegetation could be influenced by factors such as vegetation cover, habitat heterogeneity (McCoy & Bell, 1991; Uno et al., 2010), landscape, and climatic conditions. These factors are crucial for ant biodiversity and communities, as they respond to habitat size, environmental conditions, and available resources (Luo et al., 2023; Márquez-Peña & Domínguez-Haydar, 2023; Uno et al., 2010).
Indicator value (IndVal): The species F. mccooki was identified as an indicator of secondary vegetation in this study. This finding aligns with its biological behavior, as this species is primarily characterized by its generalist aspects in terms of habitats and feeding (Cuezzo, 2000; MacKay & Mackay, 2002). T. spinosum was designated an indicator of grassland. This finding is consistent with the specie’s niche, as it is common in arid and semiarid environments, preferring open areas with low vegetation cover, such as shrublands and grasslands (Alatorre-Bracamontes & Vásquez-Bolaños, 2010; AntWeb, 2023). D. insanus was identified as a detector of grassland, aligning with its ecology. This species is tolerant of high temperatures and is commonly found in open soils with low-profile vegetation cover, allowing it to thrive in environments that have experienced disturbances (AntWeb, 2023; Cuezzo & Guerrero, 2012). It has been previously recorded as an indicator species in agroecosystems with varying degrees of disturbance (Rodríguez de León et al., 2019). The ecology of the ant community can provide a highly informative bioindicator for assessment, especially in urban environments (Luo et al., 2023; Trigos-Peral et al., 2020).
Associations between environmental and biological variables and multiple correspondence analysis: Correspondence analysis allowed us to distinguish three faunistic microenvironments. Environment 1 (A1) was notable, as abundance and diversity were related to greater vegetation cover and better microclimatic conditions, indicating equitability in the ant community structure (Bestelmeyer, 2005; Rodríguez de León et al., 2019). In this environment (A1), the presence of an invasive exotic species, Paratrechina longicornis, was recorded, indicative of anthropogenic disturbance. However, further research is needed to assess its impact in the area and determine its potential effects. Environment 5 (A5), composed of low jungle (SB), presented an average temperature of 25.6 °C and humidity of 26.4 %, varying in vegetation cover. In this microenvironment, Pheidole pelor was recorded, a new record for Mexico with limited information on its biology and ecology. This result could serve as an indication to learn more about this species, acting as a starting point for additional research and gaining a more comprehensive understanding of its ecology. T. spinosum, despite being an indicator for grassland (Rojas & Fragoso, 1994; Rojas et al., 2014), also showed an association with environment 5 (A5), likely due to its correlation with the temperature and humidity in the site. A third group consisting of environments 3 and 4 (PAS and MET) included species such as D. insanus, P. barbatus, and F. damiani, which were previously recorded in other studies on the same type of vegetation structure (Cuezzo & Guerrero, 2012; González-Martínez & Vásquez-Bolaños, 2019; Varela-Hernández, 2013).
Relationship between vegetation density and species frequency: The relationship shown in the Chi-square analysis of vegetation cover size and the presence of ant species may be influenced primarily by the biology and ecology of these species. This is mainly due to the more heterogeneous environment with greater structural diversity, greater number of microhabitats, greater availability of food resources, and consequently, lower intra- and interspecific competition (Oliveira et al., 2014; Pinzón-Triana et al., 2019; Ribas & Schoereder, 2007). This has been reflected in various studies (Luo et al., 2023; Pinzon-Triana et al., 2019), in which a positive relationship with vegetation cover size and diversity was reported. Mamani-Mamani et al. (2012) reported high ant diversity and abundance under different sizes of vegetation cover; notably, the lower the coverage was, the lower the diversity and abundance of ants. This finding aligns with what was recorded in this study, indicating that the observed differences in frequency between ant subfamilies and vegetation cover levels are not random but, rather, reflect a significant relationship between these variables.
Research on protected natural areas (PNAs) within urban areas is important because maintaining monitoring increases knowledge about species communities, providing concrete information about the potential conservation of habitats that have suffered anthropogenic damage. This initial study of ant fauna in the “El Refugio” State Park ANP becomes the basis for future conservation analyses. Our results demonstrate the importance of habitat conservation. In this small area immersed in an urban area, new records were obtained for Tamaulipas and Mexico. These findings highlight the importance of understanding the interactions between flora and fauna in a natural environment.
Ethical statement: the authors declare that they all agree with this publication and made significant contributions; that there is no conflict of interest of any kind; and that we followed all pertinent ethical and legal procedures and requirements. All financial sources are fully and clearly stated in the acknowledgments section. A signed document has been filed in the journal archives.

