


 Inglés (pdf)
 Articulo en XML
 Referencias del artículo
 Enviar articulo por email
 Citado por SciELO
  Similares en
SciELO
Similares en
SciELO  uBio
uBio 
 Permalink
Introduction
Rivers are dynamic and multifunctional systems characterized by the presence of drainage networks, with different courses and a high degree of environmental heterogeneity (Custodio & Chanamé, 2016), which contribute considerably to the economic growth of a country and can be used for different purposes such as fishing, irrigation, transport, power generation, tourism, and recreation (Galarza et al., 2021). Therefore, anthropic pressures on these systems alter their water quality, producing high levels of pollution (Liévano-León & Ospina-Torres, 2007; Meneses-Campo et al., 2019), which affect public health and ecosystem services.
Perú has not been an exception to this problem, which has led to alterations in the natural dynamics of hydrographic basins, and therefore to losses or modifications in the aquatic diversity of these systems (Gamarra et al., 2018). Based on these diversity changes, different methodologies have been developed using a wide variety of organisms, from bacteria to fish (Barbour et al., 1999; Oscoz et al., 2006), among which macroinvertebrate monitoring stands out, for the purpose of reflecting the disturbances occurred in water bodies (López-Mendoza et al., 2019).
Aquatic macroinvertebrates are in close relation with the environment they inhabit. Any change in the environmental conditions is manifested in the structure and composition of the aquatic invertebrate community that inhabits it (Terneus et al., 2012). They reflect environmental changes in relatively short periods, contributing to environmental and ecological analyses of the state of the aquatic system, and are therefore used in environmental assessment studies (Hauer & Lamberti, 2011).
The hydrographic basins of the Peruvian Pacific watersheds are characterized by dry land conditions, which entails water shortage problems for human consumption. These arid and semi-arid ecosystems are of great economic importance for Perú since they are used for many anthropogenic activities (Arana-Maestre et al., 2021). In the last 35 years there have been modifications in minimum runoff in several Pacific basins that are attributed to human activity (Lavado et al., 2012). One of them is River Tambo, located on the Southwestern flank of the Andean Mountain range, which varies between 0-5 800 m above sea level in altitude. It forms at the confluence of the Ichuña and Paltiture Rivers. It flows through the localities of Yunga, Lloque, Quinistaquillas, El Fiscal, Cocachacra, and Deán Valdivia. The lower basin is exclusively used for agriculture. On the high zone of the basin is situated the auric project Chucapaca; in the middle zone, Pampa Minera Cobre, and in the low zone, the cupriferous project Tía María (Carpio-Fernández & Peña, 2020; SENAMHI, 2009); and between Moquegua and Puno, is located the auric mine Florencia-Tucari. Water pollution from mining waste in the Moquegua department and the ecological debt generated by hydrological pollution in River Tambo put the population and agricultural, livestock, and hydrobiological resources settled on the lower part of the basin at risk of contamination (INDECI, 2021).
In view of this situation, the identification and use of macroinvertebrates as bioindicators that reflect the current ecological state and water quality of River Tambo is proposed, and thus generate a useful tool for integrated management of hydric resources by competent authorities such as Autoridad Nacional del Agua (ANA, 2019), municipalities, water commissions, agricultural councils, etc., to be able to detect water quality issues early, providing potentially impacted areas with alternative solutions. The aim of this research is to analyze the structure of aquatic macroinvertebrates in River Tambo, Perú and assess the water quality.
Materials and methods
Study area: The study was carried out on the main course of River Tambo (Fig. 1). The main contributors to its hydrographic network are the rivers Carumas, Coralaque, Ichuña, and Paltuture. The mean altitude of the basin is 3 302 m.a.s.l., with a 7.46 % mean slope, a 1.72 % main course slope, and a 329.18 km length.
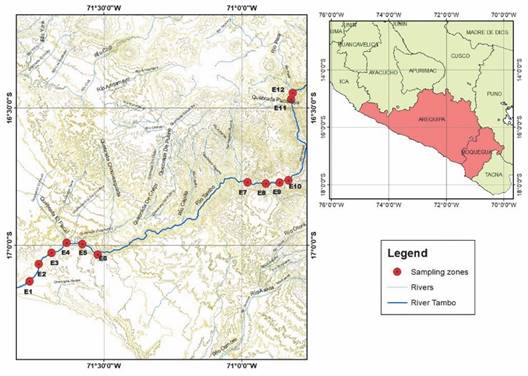
Sampling: Sampling took place between December 2018 and November 2019 (five events) in 12 stations on the main course of the river (Table 1). Due to poor accessibility, it was not possible to sample E1 in August. Stations E1, E2, E3, E11, and E12 showed modifications from their natural course. A 150 m sampling zone was delimited on the river margin, within which sampling spots were selected. Three samples were taken per station, using a 500 µm mesh diameter Surber sampler net. Samples were stored in 500 ml containers and fixed in 4 % formalin.
Table 1 Location of sampling stations in the River Tambo basin, Arequipa, Perú.
| Station | Basin Zone | Coordinates | Altitude (m.a.s.l.) | Characteristics (Substrate) | |
| Latitude | Longitude | ||||
| E1 | Lower | 17°07’51’’ S | 71°46’08’’ W | 43 | Sand |
| E2 | Lower | 17°04’03’’ S | 71°44’00’’ W | 103 | Sand |
| E3 | Lower | 17°01’30’’ S | 71°41’23’’ W | 156 | Sand |
| E4 | Lower | 16°59’23’’ S | 71°38’03’’ W | 227 | Pebbles |
| E5 | Lower | 16°5’940’’ S | 71°34’39’’ W | 282 | Pebbles |
| E6 | Lower | 17°01’57’’ S | 71°31’14’’ W | 378 | Pebbles |
| E7 | Middle | 16°46’09’’ S | 70°58’43’’ W | 1332 | Pebbles |
| E8 | Middle | 16°46’40’’ S | 70°55’06’’ W | 1452 | Rock |
| E9 | Middle | 16°46’15’’ S | 70°51’38’’ W | 1587 | Rock |
| E10 | Middle | 16°45’39’’ S | 70°49’32’’ W | 1663 | Pebbles |
| E11 | Higher | 16°28’02’’ S | 70°40’10’’ W | 2487 | Rock |
| E12 | Higher | 16°26’29’’ S | 70°48’43’’ W | 2594 | Rock |
Identification: In the laboratory, the samples were rinsed with water through a 500 µm sieve and preserved in 70 % alcohol for identification (Domínguez & Fernández, 2009; Roldán-Pérez, 2003). Taxonomic identification was done to family level following the keys by Merritt et al. (2008), Domínguez and Fernández (2009), Prat et al. (2011), and Thorp and Lovell (2015).
Physicochemical variables: The following physicochemical variables were measured in each sampling station directly with a Hanna HI9829 multiparameter probe: dissolved oxygen, pH, conductivity, and temperature.
Data analysis: The structure of the macroinvertebrate community was assessed using richness (number of families) (S), abundance (number of individuals of a family/m2), Simpson’s dominance index (D), Pielou’s evenness (J’), and true diversity (D1) (Moreno, 2001). A multivariate analysis of variance (MANOVA) was used to compare community indices between sampling sites, and Tukey’s test was used for multiple post hoc comparisons. A canonical correspondence analysis (CCA) was performed to assess the relation between macroinvertebrates and physicochemical variables. An analysis of similarities (ANOSIM) (with 9 999 permutations) was used to test for differences in community composition between sampling zones and the statistical significance of the groupings. Similarity percentage analysis (SIMPER) and non-metric multidimensional scaling (nMDS) based on the Bray-Curtis index were used to explore variations in macroinvertebrate taxa composition among the 12 sampling stations. The analyses were carried out on EXCEL® and PAST version 4.13 (Hammer et al., 2001).
River ecological quality: The ecological quality of the river was determined using the ABI index (Andean Biotic Index) (Medina-Tafur et al., 2010). In this index, families of aquatic macroinvertebrates are ordered from least to greatest tolerance to environmental disturbances in 10 groups, with scores that vary between 10 and 1. The score 10 corresponds to the most sensitive families and the score 1 to the most tolerant families. The sum of the scores for all families provides the total ABI index score.
Results
Physicochemical parameters: Superficial water temperature varied between 15.48 ºC (E12) and 24.04 ºC (E4). Values for pH ranged from 7.96 (E6) to 8.61 (E5). Electric conductivity (EC) varied between 2 239.67 and 3 645.11 μS/cm recorded at E7 and E4 respectively. Dissolved oxygen concentration (DO) varied between 5.5 mg/L at E1 and 9.7 mg/L at E8. Finally, total dissolved solids (TDS) ranged between 970.33 ppm (E10) and 2 632.08 ppm (E6) (Table 2).
Table 2 Mean monthly values for physicochemical parameters in River Tambo, Arequipa Region, Perú.
| Station | Temp.(°C) | pH | EC(µS/cm) | DO(mg/L) | TDS (ppm) |
| E1 | 21.65 ± 2.19 | 8.38 ± 0.20 | 2 230.71 ± 743.93 | 7.44 ± 2.76 | 1 110.71 ± 375.00 |
| E2 | 21.61 ± 2.98 | 8.38 ± 0.13 | 2 797.92 ± 1 498.04 | 7.43 ± 2.85 | 1 398.83 ± 748.79 |
| E3 | 22.83 ± 2.84 | 8.52 ± 0.10 | 2 141.96 ± 1 858.80 | 7.44 ± 3.06 | 1 345.92 ± 686.58 |
| E4 | 24.02 ± 3.58 | 8.40 ± 0.30 | 2 943.17 ± 1 573.15 | 8.89 ± 1.36 | 1 471.67 ± 786.70 |
| E5 | 22.87 ± 3.03 | 8.55 ± 0.12 | 2 238.93 ± 755.24 | 9.09 ± 0.75 | 1 115.73 ± 380.24 |
| E6 | 21.88 ± 3.28 | 8.07 ± 0.80 | 2 442.07 ± 1 497.50 | 9.27 ± 1.05 | 2 431.73 ± 2 327.94 |
| E7 | 19.99 ± 2.61 | 8.56 ± 0.08 | 2 101.20 ± 766.35 | 7.18 ± 2.93 | 1 050.60 ± 383.16 |
| E8 | 19.76 ± 2.48 | 8.46 ± 0.08 | 2 089.47 ± 801.99 | 6.74 ± 2.68 | 1 044.53 ± 401.06 |
| E9 | 19.31 ± 2.16 | 8.43 ± 0.11 | 2 035.87 ± 935.76 | 7.02 ± 2.96 | 1 018.20 ± 467.68 |
| E10 | 18.70 ± 2.14 | 8.37 ± 0.12 | 1 964.80 ± 832.06 | 6.62 ± 2.60 | 862.87 ± 532.31 |
| E11 | 16.33 ± 6.32 | 8.61 ± 0.37 | 2 641.27 ± 1 203.69 | 7.20 ± 1.26 | 1 334.33 ± 577.81 |
| E12 | 16.08 ± 4.26 | 8.57 ± 0.32 | 2 609.93 ± 1 433.80 | 7.62 ± 1.64 | 1 349.53 ± 648.48 |
Macroinvertebrates diversity: The three families with the highest presence and total abundance were Chironomidae (8 326 ind/m2), Baetidae (6 209 ind/m2), and Leptohyphidae (4 684 ind/m2). Other families stood out also occurring at every station, but with a lower density, standing out Simuliidae (3 292 ind/m2), Hydroptilidae (2 103 ind/m2), and Elmidae (1 429 ind/m2) (Table 3).
Table 3 Mean abundance of aquatic macroinvertebrates (ind/m2) during the sampled period in River Tambo, Arequipa Region, Perú.
| E1 | E2 | E3 | E4 | E5 | E6 | E7 | E8 | E9 | E10 | E11 | E12 | |
| Platyhelminthes | ||||||||||||
| Dugesiidae | 0 | 0 | 0 | 1 | 1 | 0 | 0 | 0 | 0 | 0 | 0 | 0 |
| Nematoda | 1 | 0 | 1 | 1 | 0 | 1 | 0 | 1 | 0 | 1 | 1 | 0 |
| Annelida | ||||||||||||
| Glossiphoniidae | 0 | 0 | 0 | 1 | 0 | 0 | 0 | 0 | 0 | 0 | 0 | 0 |
| Lumbriculidae | 2 | 9 | 12 | 56 | 19 | 10 | 0 | 0 | 1 | 0 | 3 | 0 |
| Mollusca | ||||||||||||
| Physidae | 0 | 0 | 3 | 7 | 0 | 64 | 22 | 4 | 7 | 45 | 0 | 0 |
| Arthropoda Malacostraca | ||||||||||||
| Palaemonidae | 9 | 7 | 1 | 2 | 0 | 0 | 0 | 0 | 0 | 1 | 0 | 0 |
| Arthropoda Copepoda | ||||||||||||
| Centropagidae | 0 | 0 | 0 | 0 | 0 | 0 | 4 | 0 | 0 | 0 | 0 | 1 |
| Cyclopidae | 0 | 1 | 0 | 1 | 0 | 0 | 0 | 0 | 0 | 0 | 0 | 0 |
| Arthropoda Ostracoda | 0 | 16 | 58 | 44 | 24 | 20 | 11 | 38 | 64 | 24 | 13 | 7 |
| Arthropoda Acari | ||||||||||||
| Limnesiidae | 0 | 0 | 2 | 1 | 3 | 0 | 3 | 3 | 5 | 2 | 7 | 2 |
| Limnozetidae | 0 | 0 | 0 | 1 | 12 | 7 | 0 | 0 | 0 | 0 | 0 | 0 |
| Arthropoda Hexapoda | ||||||||||||
| Baetidae | 17 | 44 | 94 | 96 | 343 | 382 | 613 | 1 003 | 1 425 | 1 427 | 304 | 461 |
| Blephariceridae | 0 | 0 | 0 | 0 | 0 | 4 | 49 | 164 | 351 | 412 | 38 | 13 |
| Ceratopogonidae | 6 | 29 | 1 | 2 | 7 | 2 | 9 | 8 | 7 | 9 | 26 | 7 |
| Chironomidae | 867 | 427 | 1 126 | 1 499 | 644 | 686 | 354 | 414 | 376 | 705 | 946 | 282 |
| Coenagrionidae | 0 | 1 | 1 | 1 | 1 | 1 | 0 | 0 | 0 | 1 | 0 | 0 |
| Dytiscidae | 0 | 0 | 0 | 1 | 1 | 1 | 4 | 3 | 7 | 0 | 1 | 0 |
| Elmidae | 41 | 96 | 156 | 287 | 378 | 190 | 50 | 41 | 76 | 99 | 8 | 7 |
| Gomphidae | 0 | 0 | 0 | 0 | 0 | 0 | 2 | 1 | 1 | 1 | 0 | 0 |
| Gripopterygidae | 0 | 0 | 0 | 0 | 0 | 0 | 0 | 0 | 0 | 4 | 0 | 0 |
| Hydrobiosidae | 0 | 0 | 0 | 0 | 0 | 0 | 0 | 0 | 0 | 0 | 33 | 7 |
| Hydrophilidae | 6 | 28 | 23 | 42 | 68 | 98 | 64 | 64 | 222 | 113 | 0 | 2 |
| Hydroptilidae | 10 | 24 | 105 | 279 | 546 | 193 | 143 | 240 | 210 | 194 | 135 | 24 |
| Leptohyphidae | 55 | 30 | 138 | 131 | 607 | 339 | 1 085 | 680 | 1 383 | 230 | 1 | 5 |
| Libellulidae | 0 | 0 | 0 | 0 | 0 | 0 | 0 | 0 | 0 | 2 | 0 | 0 |
| Limnephilidae | 1 | 1 | 6 | 39 | 100 | 102 | 83 | 55 | 215 | 52 | 19 | 79 |
| Mesovelidae | 2 | 7 | 1 | 27 | 2 | 1 | 5 | 3 | 0 | 1 | 1 | 0 |
| Muscidae | 2 | 2 | 14 | 12 | 7 | 10 | 53 | 51 | 26 | 40 | 83 | 12 |
| Psychodidae | 0 | 0 | 0 | 1 | 0 | 0 | 0 | 5 | 1 | 0 | 2 | 1 |
| Simuliidae | 22 | 25 | 39 | 221 | 119 | 330 | 118 | 352 | 1 224 | 751 | 47 | 44 |
| Stratiomyidae | 0 | 0 | 0 | 0 | 1 | 0 | 0 | 0 | 0 | 0 | 0 | 0 |
| Tabanidae | 0 | 1 | 0 | 0 | 6 | 0 | 0 | 0 | 0 | 0 | 4 | 0 |
The highest richness was registered at stations E9 (December 2018 and November 2019) and E10 (June and August 2019) with 15 families recorded. Stations E1 (May 2019) and E2 (December 2018) showed the lowest richness, with three and six families respectively. The highest dominance values were recorded at station E1 (May and June 2019): 0.93 and 0.84 respectively. Stations from the middle (E7, E8, E9, and E10) and high (E11 and E12) zones of the river showed low dominance values. High evenness values (> 0.5) were recorded at stations E4, E5, E6, and E12 in every month. The highest true diversity was recorded at E3 (December 2018), E6, and E7 (November 2019) with 7.79, 7.68, and 7.98 effective species respectively. Station E1 (May and June 2019) showed the lowest true diversity, with 1.20 and 1.54 effective species respectively (Fig. 2).

Fig. 2 Community structure indices in River Tambo, Arequipa, Perú. A. Richness (N); B. Dominance (D); C. Pielou’s evenness (J); D. True diversity (D1).
The two-way MANOVA test showed significant differences (P < 0.05) in the values of community structure indices, regarding station, month, and the interaction between them (Table 4). According to Tukey’s test, in November 2019 there were significant differences (P < 0.05) in dominance, evenness and true diversity in relation to the other four months; December 2019 and May 2018 recorded a significant difference (P < 0.05) in richness in comparison to the other months. Station E1 differed significantly (P < 0.05) from the other 11 stations in dominance and true diversity values. Evenness was also significantly different (P < 0.05) between E1 and E2 and between them and the rest of the stations. Considering richness values, stations from the middle zone of the river (E7, E8, E9, and E10) are significantly different (P < 0.05) from some of the stations of the lower (E1, E2 and E3) and higher zone of the river (E11 and E12).
Table 4 Two-way MANOVA test for community structure indices in River Tambo, Arequipa Region, Perú.
| DF | F | P | ||
| Month | Richness | 4 | 9.52 | < 0.001 |
| Dominance | 4 | 9.78 | < 0.001 | |
| Evenness | 4 | 5.57 | < 0.001 | |
| True Diversity | 4 | 19.02 | < 0.001 | |
| Station | Richness | 11 | 11.02 | < 0.001 |
| Dominance | 11 | 7.03 | < 0.001 | |
| Evenness | 11 | 4.04 | < 0.001 | |
| True Diversity | 11 | 5.71 | < 0.001 | |
| Month * Station | Richness | 43 | 3.01 | < 0.001 |
| Dominance | 43 | 2.28 | < 0.001 | |
| Evenness | 43 | 2.53 | < 0.001 | |
| True Diversity | 43 | 2.18 | 0.001 | |
Fig. 3 shows the temporal heterogeneity of the aquatic macroinvertebrate community in River Tambo. There were significant differences (R = 0.16, P < 0.05) between the lower and middle, and middle and higher zones. At a temporal level, nMDS showed similar groupings between the 12 stations for May and June 2019, while the distance between points widens in August and November 2019. In December, the difference among the 12 stations was evident, and the polygon formed by their distances was the largest.

Fig. 3 Non-parametric Multidimensional Scaling analysis (nMDS) by month in River Tambo, Arequipa, Perú. December 2018 (light blue), May 2019 (orange), June 2019 (black), August 2019 (yellow), and November 2019 (blue). Stress value = 0.215.
The nMDS analysis, at a temporal and spatial level, showed some grouping in the stations from the lower, middle, and higher zones of the river. Spatially, lower zone stations (E1, E2, E3, E4, E5, and E6) showed heterogeneity between them, while in the higher zone (E11 and E12) there was a lower heterogeneity (Fig. 4). The similarity test (ANOSIM) shows that the macroinvertebrate composition does not differ significantly (R = 0.16, P > 0.05) between stations from the lower (E1, E2, E3, E4, E5, and E6), middle (E7, E8, E9, and E10) and higher (E11 and E12) River Tambo basin, except between E1 and E6 where there were significant differences (P < 0.05). Every month showed significant differences (R = 0.18, P < 0.05), except for August and November.

Fig. 4 Non-parametric Multidimensional Scaling Analysis (nMDS) by sampling station in River Tambo, Arequipa, Perú. Lower zone (red), middle zone (blue), and higher zone (green). December, X; May, *; June, +; August O; November #. Stress value = 0.215.
CCA showed that stations E11 and E12 are related to low temperatures, and stations E1, E2, E3 and E4 to high temperatures, pH, and conductivity values. Stations E7, E8, and E9 associated with low conductivity and high dissolved oxygen values. Whereas Elmidae was related to high temperatures and dissolved oxygen; Leptohyphidae, Simuliidae and Baetidae were related to low conductivity values; Chironomidae and Baetidae to high and low temperatures respectively; and to a lesser extent, Hydroptilidae to temperature and Chironomidae to conductivity (Fig. 5).

Fig. 5 Canonical correspondence analysis (CCA) by sampling stations on River Tambo Arequipa, Perú. Lower zone (red), middle zone (blue) and higher zone (green). EC, electric conductivity; DO, dissolved oxygen concentration; TDS, total dissolved solids.
Regarding family composition between the three zones of the basin, 85 % of total dissimilarity was determined. Generally, Baetidae and Chironomidae contributed individually more than 20 % of this dissimilarity, except in the middle zone, where Leptohyphidae had the highest individual contribution (> 25 %), and in the lower zone, where Baetidae had less than 10 % of individual contribution (Table 5).
Table 5 SIMPER analysis per basin and basin zones of River Tambo Arequipa Region, Perú.
| Family | Contribution % | |||
| Basin | Lower zone | Middle zone | Higher zone | |
| Baetidae | 26.44 | 9.14 | 22.99 | 27.59 |
| Chironomidae | 21.67 | 39.51 | 9.90 | 39.09 |
| Leptohyphidae | 15.35 | 11.13 | 27.37 | |
| Simuliidae | 11.19 | 6.86 | 15.74 | 4.34 |
| Hydroptilidae | 15.58 | 8.08 | 5.80 | 6.13 |
| Elmidae | 5.23 | 12.53 | - | - |
| Blephariceridae | - | - | 6.72 | - |
| Limnephilidae | - | - | - | 6.41 |
| Muscidae | - | - | - | 4.01 |
| Total | 85.46 | 87.25 | 88.53 | 87.57 |
The lowest scores of the ABI index were recorded at station E1 (May 2019, the value was 9) with a poor quality average value (Table 6). The highest index scores were recorded in November at stations E7, E8, E9, and E10, the latter having the highest score recorded and good quality (June 2019, value 76). Stations E11 and E12 showed a good and moderate average quality respectively. The results show an increase in the ABI index upriver from E1 to E10. At station E12, on the high zone of the river, these indices decrease (up to 18 in June 2019) and remain at a moderate quality most of the time (between 20 and 55) (Table 6).
Table 6 Scores of ABI index for the biotic quality of River Tambo, Arequipa Region, Perú.
| Station | DEC-2018 | MAY-2019 | JUN-2019 | AUG-2019 | NOV-2019 | Average | QUALITY |
| E1 | 19 l | 9 l | 28 l | SI l | 37 l | 23 l | Poor |
| E2 | 16 l | 25 l | 42 l | 41 l | 40 l | 33 l | Moderate |
| E3 | 35 l | 36 l | 51 l | 42 l | 43 l | 41 l | Moderate |
| E4 | 51 l | 27 l | 57 l | 35 l | 36 l | 41 l | Moderate |
| E5 | 53 l | 41 l | 49 l | 61 l | 43 l | 49 l | Good |
| E6 | 43 l | 41 l | 51 l | 55 l | 45 l | 47 l | Good |
| E7 | 47 l | 48 l | 63 l | 58 l | 64 l | 56 l | Good |
| E8 | 55 l | 58 l | 36 l | 64 l | 66 l | 56 l | Good |
| E9 | 64 l | 48 l | 44 l | 56 l | 72 l | 57 l | Good |
| E10 | 52 l | 51 l | 76 l | 64 l | 72 l | 63 l | Good |
| E11 | 60 l | 35 l | 43 l | 74 l | 48 l | 52 l | Good |
| E12 | 52 l | 30 l | 28 l | 42 l | 55 l | 41 l | Moderate |
l Very good l Good l Moderate l Poor l Very bad l NI= No information
Discussion
The results of this study show the greatest diversity in the upper and middle parts of the River Tambo. The lower parts have less diversity and richness of taxa due to physical-chemical conditions, anthropic intervention, and type of substrate. The ABI index shows an increase upriver, from E1 to E10, indicating a quality improvement upstream.
Physicochemical parameters in River Tambo showed that dissolved oxygen, temperature, and conductivity are within category 3 standards for water environmental quality, used for irrigation and animal watering (MINAM, 2017). According to our observations, dissolved oxygen is within normal levels at stations E6, E7, E8, and E9 as stipulated in D. S. N°004-2017 (MINAM, 2017). All twelve stations in this study showed high conductivity values. Sediment ingress because of the lack of riverside vegetation at all stations could be an explanation for these high values (Reis-Oliveira et al., 2014; Ternus et al., 2011). According to Rodier (1998) and Meneses-Campo et al. (2019), the River Tambo have high mineralization, since the conductivity is higher than 1 000 µS/cm and these values rise progressively downriver, such as on stations E9, E8, E7, and E6 in this study, located in the middle to low zone of the river. Another possible cause of these high conductivity values may be the ionic concentration result of human activities (Castro et al., 1996). On the other hand, temperature is one of the factors that determine the physical properties and the richness and distribution of macroinvertebrate families (Bustamante-Toro et al., 2008; Custodio & Chanamé, 2016).
Stations E1 and E2, showed the lowest richness and diversity in the whole basin, probably due to the impact caused by the observed destruction of habitats for community settlement and the predominance of sandy substrates (Burdet & Watts, 2009). Regarding stations E11 and E12 on the higher zone, where there was also evidence of course modification, diversity also showed low values, however, the dominant substrate here was rocky. Generally, rivers with sandy substrate harbor few species, with few individuals per species (Arocena, 1998; Boccardi, 2004; Chalar, 1994; Pintos et al., 1992), given that it’s a specialized substrate, unstable in water currents. By contrast, rocky substrates tend to be richer than sandy ones, since they provide more surface for the growth of the biofilm on which various primary consumers feed (Meza-Salazar et al., 2012).
At the stations located in the lower zone of the river, Chironomidae was the most abundant taxon. According to Butakka et al. (2016), this family can inhabit a variety of habitats, from pristine to highly polluted, and from freshwater to hypersaline environments. Likewise, Pinder (1995) and Oviedo-Machado and Reinoso-Flores (2018) state that chironomids can colonize a wide range of macro and microhabitats, such as rapids, pools, submerged wood, sand, gravel, pebbles, and roots, as well as utilize fine sediments to produce tubular refuges. According to Giraldo et al. (2014), at stations with anthropic intervention by agriculture and livestock raising, there is a greater abundance of Diptera families, matching the observations made in this study at stations from the lower zone of the river.
The absence of riverside cover and in some stations the presence of sandy substrates could be responsible for the low representation of Trichoptera and Ephemeroptera in the basin (Principe et al., 2019). Allan et al. (1997) mention that sites deteriorated by deforestation and the change in soil use for productive activities are related to the rise in sedimentation, reduction in the ingress of allochthonous material, and consequently, the loss of habitat heterogeneity. However, at stations located in the middle zone there was a high abundance of Leptohyphidae, Baetidae, Limnephilidae, and Hydroptilidae. Regarding Leptohyphidae and Baetidae (Ephemeroptera), Bücker et al. (2010) and Lorion and Kennedy (2009) found that they may abound in streams in deforested areas subject to agricultural and livestock pressure, in addition to their larvae remaining on rocky substrates, characteristic of this part of the river. For Trichoptera (Limnephilidae and Hydroptilidae), Serna et al. (2015) and Springer (2010) mention that they can construct shelters on substrates such as stones, rocks, gravel, and macrophytes, which allow them to survive in a wider variety of habitats.
The CCA remarked the importance of dissolved oxygen, temperature, and conductivity in the distribution of aquatic macroinvertebrates in River Tambo. In similar studies it’s noted that the physicochemical properties previously mentioned, as well as pH and dissolved solids may explain the dynamics of neotropical lotic systems (Carvacho-Aránguiz, 2012; Mancilla et al., 2009; Morelli & Verdi, 2014), given that most aquatic organisms are sensitive to these factors (Carvacho-Aránguiz, 2012; Domínguez & Fernández, 2009; Meza-Salazar et al., 2012; Quinn & Hickey, 1990; Roldán-Perez, 1996; Toro et al., 2002;). Some families are more sensitive to increases in conductivity, like Leptohyphidae, Simuliidae, and Baetidae (Meneses-Campo et al., 2019), while others are more resistant, like Elmidae and Chironomidae, that showed a positive relation to an increase in temperature. Elmidae is characterized by carrying out gas exchange through the plastron, taking atmospheric oxygen, submerging, and exchanging the gas with the oxygen dissolved in the water, which makes them sensitive to low availability of dissolved oxygen (Arias-Diaz et al., 2007; Brown, 1987). Chironomidae is widely distributed and adapts to different environmental conditions, besides being present in polluted waters (Gutiérrez-Garaviz et al., 2014). Hydroptilidae lacks any relation with the physicochemical parameters considered.
In many neotropical rivers, there is a progressive succession of sensitive taxa by others more tolerant to pollution (Medina-Tafur et al., 2007). According to the results of the ABI index, the high and middle zones of the River Tambo showed a good to moderate quality during the sampled period, which probably allowed for the establishment of an aquatic community similar to what would be found under natural conditions (Domínguez et al., 2020). In the case of the lower part of the river, the water quality is poor according to the index values. This is probably due to the presence of a higher concentration of contaminants as a result of the intense agricultural activity carried out in this part of the river (ANA, 2019), as well as from the discharge of residual effluents from human settlements in the area, which limit the establishment of little tolerant macroinvertebrates, and therefore there is a predominance of those with a high tolerance to organic contamination, like Chironomidae (Liévano-León & Ospina-Torres, 2007; Tobias-Loaiza & Guzmán-Soto, 2022), which has been linked to contamination and eutrophication of freshwater ecosystems (González del Tanago & García-Jalón, 1984).
The biological and physicochemical parameters of a body of water determine the establishment of the macroinvertebrate community (Vannote et al., 1980). It has been reported that, when ecological conditions are good, Plecoptera, Ephemeroptera, and Trichoptera are present (Norris & Hawkins, 2000). However, some Ephemeroptera such as Baetidae and Leptohyphidae, and some Trichoptera such as Hydroptilidae and Hydropsychidae, may be more tolerant (Ríos-Touma et al., 2014). During the present study, in the high and middle zone of the river, the presence of Blephariceridae, Gripopterygidae, Gomphidae, and Hydrobiosidae was recorded. The establishment of these families that are sensitive to organic pollution (with scores higher than 8 in the ABI index) (Leaño-Sanabria & Pérez-Barriga, 2020; Roldán-Pérez, 2016) indicates that the ecological conditions are better upriver. On the contrary, a high abundance of Chironomidae is typical of zones where ecological conditions are not suitable to support an aquatic community similar to that which would be found in natural conditions (Medina-Tafur et al., 2010). This family showed higher abundance at stations E1 and E2, located in the lower zone of the river, close to its mouth in the Pacific Ocean, where the greatest environmental impact on the river is evident.
This study is the first one on aquatic macroinvertebrate communities in the River Tambo and in Arequipa region. The structure and diversity of macroinvertebrates constitute the base information for future monitoring in this basin and the water quality indices obtained are indicative of the health of the ecosystem and valuable tools to evaluate and manage this resource.
Ethical statement: the authors declare that they all agree with this publication and made significant contributions; that there is no conflict of interest of any kind; and that we followed all pertinent ethical and legal procedures and requirements. All financial sources are fully and clearly stated in the acknowledgments section. A signed document has been filed in the journal archives.

