


 Inglés (pdf)
 Articulo en XML
 Referencias del artículo
 Enviar articulo por email
 Citado por SciELO
  Similares en
SciELO
Similares en
SciELO  uBio
uBio 
 Permalink
Revista de Biología Tropical
versión On-line ISSN 0034-7744versión impresa ISSN 0034-7744
Rev. biol. trop vol.57 no.3 San José sep. 2009
Influence of watershed activities on the water quality and fish assemblages of a tropical African reservoir
Moshood K. Mustapha
Dept. of Zoology, University of Ilorin, Ilorin, Nigeria; moonstapha@yahoo.com
Abstract: Agricultural and fisheries activities around the watershed of an African tropical reservoir (Oyun reservoir, Offa, Nigeria) were found to contribute significantly to water quality deterioration of the dam axis of the reservoir, leading to eutrophication of that part of the reservoir. This is evident from the high amount of nitrate (6.4 mg/l), phosphate (2.2 mg/l) and sulphate (16.9 mg/l) in the water body which was higher than most other reservoirs in Nigeria. These nutrients originate in fertilizer run-offs from nearby farmlands and were found in higher concentrations in the rainy season which is usually the peak of agricultural activities in the locality. The eutrophication was more pronounced on the dam axis because it is the point of greatest human contact where pressure and run-off of sediments were high. The eutrophication altered the food web cycle which consequently affected the fish species composition and abundance with the dominance of cichlids (planktivorous group) and decline of some species in the fish population. Best management practices (BMP) to control and reduce the eutrophication and improve water quality and fish assemblages should be adopted and adapted to suit the situation in the reservoir. Rev. Biol. Trop. 57 (3): 707-719. Epub 2009 September 30.
Key words: Reservoir, water quality, fish assemblages, watershed, management.
Africa tropical reservoirs are often constructed for a single purpose like provision of domestic and industrial water supply, irrigation, hydroelectric power generation or fish production. With time, other functions like flood control, navigation, recreation and tourism are superimposed on them, making them assume multipurpose roles. The ability of the reservoir to deliver its function(s) effectively depends largely on its watershed activities. A watershed is the land from which rain and surface water drain into the reservoir. Reservoir characteristics are a reflection of its watershed (Holdren et al. 2001). The watershed land cover is a major determinant of water quality and fish community composition (Miranda 2008). Therefore any alterations in the watershed could consequently affect the water quality and fish assemblages.
Various activities such as farming, fishing, forestry, construction, mining, urban development and land pollution occurring in or near the watershed of a reservoir could bring about water quality problems and disruption in fish species composition. These activities could also affect habitat structure, flow regime, food web and biotic interactions in the reservoir (Karr 1991). The effects these activities produce on water quality and fish assemblages may vary with season, intensity of the activity and magnitude of discharge of the nutrients or sedi ments into the reservoir. The human activities occurring on the watershed of Oyun reservoir include various agricultural practices such as farming with the use of fertilizers and cassava fermentation. Fishing activities like fish landing, scaling, marketing, fishing net and canoe repairs are the other human activities around the watershed of the reservoir. Municipal uses of the reservoir for washing and bathing with phosphate-based detergents and soaps as well as washing of cow dung left by nomadic cattle are some of the other activities occurring in the watershed of the reservoir.
Effective reservoir management and sustainable fish production will depend on effective watershed use and management. A number of watershed management practices known as Best Management Practices (BMP) have been developed and used over the years in many developed countries to protect and sustain both land use and the bodies of water that receive run off from the watershed. These practices however are non-existent or totally ignored in the management of many tropical African reservoirs thereby leading to the deteriorating water quality and inadequate fish assemblages with the absence of local species, dominance of one species over another, as well as decline in commercial species in many of the reservoirs. The relationships between watershed inputs and fish assemblages in many tropical African reservoirs are yet to be documented.
The goal of this paper is to look at various human activities occurring on the watershed of Oyun reservoir (a tropical African reservoir) and their effects on the water quality and fish species composition and abundance of the reservoir. This is with a view to managing the reservoir effectively and for sustainable exploitation of its fishes.
Materials and methods
Study Site Description: Oyun reservoir (Fig. 1) is located in Offa, Kwara State, Nigeria, (8º3005 N, 8º1555 E). It is a dam reservoir on Oyun River, created in 1964, (expanded in 1983, and 1995 with further expansions proposed) by damming the Oyun River. The reservoir was created to supply potable water for domestic and industrial uses to an estimated population of about 300000 people. Subsistence and commercial fishing activities is also carried out on the reservoir. The reservoir has a maximum length of 128 m, maximum width of 50m and maximum depth of 8.0 m, mean depth of 2.6m. The surface area is 6.9 x 10⁵m2 while the water volume is 3.50 x 10⁶m3. The net storage capacity is 2.9 x 10⁶m3. The water retention time is between 3 – 4 months in the rainy season (April – October), while the water residence time in the dry season (November-March) is few days due to high evaporation.
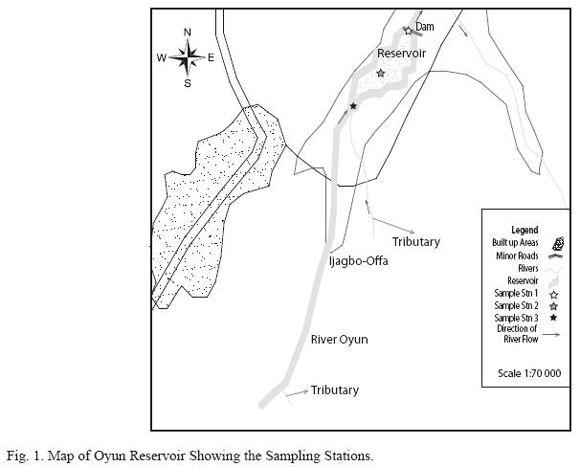
Sampling and Sampling Stations: Duplicate surface water samples were collected from 10 cm depth monthly from three stations for two years between January, 2002 and December 2003 into 50ml plastic water bottles that have been acid-washed prior to water analyses. Station 1 was at the dam axis where a lot of human activities such as washing, bathing, fish landing and cassava fermentation take place. It is the highest point of human and animal contact with the reservoir. Station 2 was at the mid-section of the reservoir which represented the area of lentic water while station 3 was at the head water of the reservoir which represented the lotic section of the reservoir.
Physico-chemical factors: Surface water temperature, pH, electrical conductivity and total dissolved solids were measured in situ using Hanna portable pH/EC/TDS/Temperature combined water proof tester model HI 98129. The following factors selected as water quality parameters were measured using the methods described for each factor as follows.
Transparency was determined by extinction method using the secchi disc by measuring the mean of the depths at which the secchi disc disappears and at which it reappears, dissolved oxygen was determined by Azide modification of the Winkler method, chemical oxygen demand was measured using the dichromate reaction method (Hach 2003), carbon dioxide and alkalinity were determined by titration (APHA 1995). Nitrate-Nitrogen (NO3-N), phosphate (PO4-P) and sulphate (SO42-) were measured according to APHA (1995) standard procedures using Hach spectrophotometer model DR-EL/2. All the chemical analyses were done at the water quality laboratory of Kwara State Utility Board, Ilorin, Nigeria, immediately after the sample collection.
Fish composition and abundance: Fish species composition and abundance were estimated through monthly collection of fish samples between January, 2002 and December, 2003 from the three stations. Gill nets, cast nets and lift nets of various mesh sizes ranging between 5.08cm and 17.78cm were used to sample the fishes from all the stations. A variety of mesh sizes was used to reduce species and size selectivity characteristics of gill nets (van der Mheen 1995). The fishes were identified using keys compiled by Holdeen & Reed (1972) and Reed et al. (1967), sorted into species and families, and each fish was weighed to the nearest 0.1g using the mettler balance.
Statistical analyses: General linear models (GLM) procedure of statistical analysis system 9.1.3 (SAS Institute, 2003) was used to analyze the results. Raw data (physico-chemical and fish) were log transformed Log10(X+1) for normality parametric statistical test requirements. Two-way analysis of variance (ANOVA) at P<0.05 were used to compare the averages and test for significant differences in means of the parameters in the stations, seasons and years. Two-way (ANOVA) was also applied to fish species seasonal catch per unit effort (CPUE) and weight abundance data to determine if there were significant differences between the seasons. The Proc GLM of SAS 9.1.3 was used in ascertaining if monthly abundance of all fish families exhibited any seasonal relationship. Prior to these analyses, the fish data was log transformed for normality.
Results
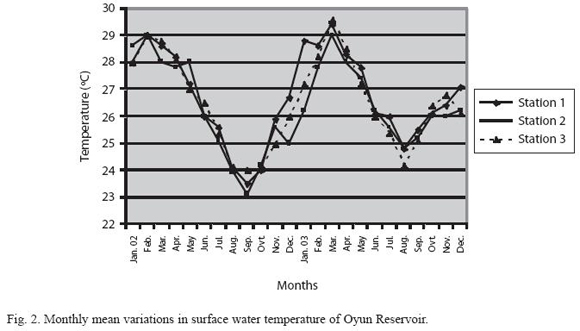
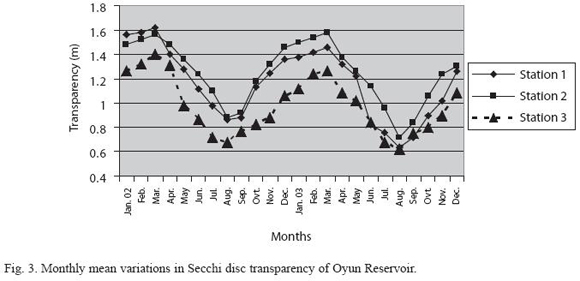
Physico-chemical factors: The mean monthly variation in the surface water temperature of the three stations is presented in Fig. 2. The temperature ranged between the lowest value of 23.10C ± 0.5 obtained from Station 2 in September and highest of 29.60C ±0.1 obtained from station 3 in March, 2003. Dry season temperature was significantly higher than the wet season (F11, 60 = 4.62, p = 0.0001). No significant difference was seen among the stations and in the two years. Secchi disc transparency was highest at station 1 with a mean value of 1.62m ±0.32 obtained in March 2002. Station 3 recorded the least secchi disc transparency value with a mean of 0.62m ±0.8 obtained in August of 2003 (Fig. 3). The dry season, stations 2 and year 2002 had significant higher transparency (F11, 60 = 41.82, p = 0.0001).
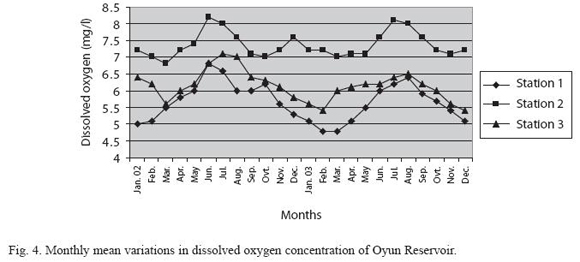
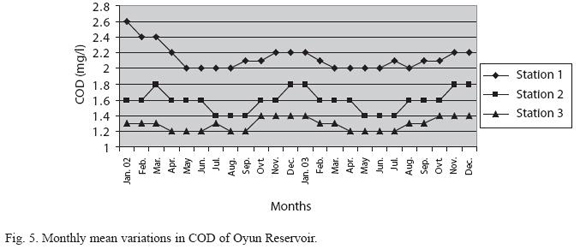
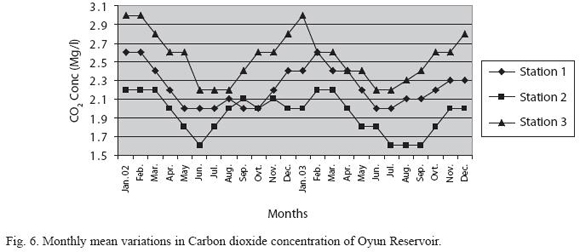
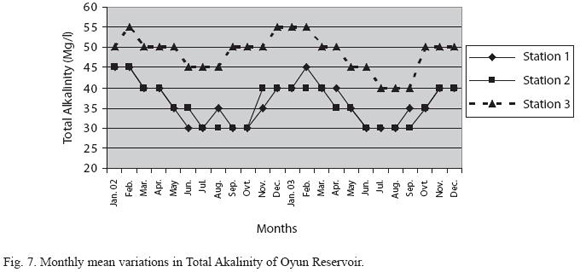
Dissolved oxygen fluctuated between lowest monthly mean of 4.8mg/l ±0.25 obtained in February and March 2003 from Station 1 and highest monthly mean of 8.2mg/l ±0.31 recorded in June 2002 from Station 2 (Fig. 4). Statistical difference was noticed in the Dissolved oxygen concentration among the stations, (with station 2 having the highest concentration) season, (the wet season values were significantly higher than dry season) and years with 2002 having a higher concentration than 2003 (F11, 60 = 42.16, p = 0.0001). Chemical Oxygen Demand (COD) varied between 1.2mg/l ±0.1 and 2.6mg/l ±0.2 and was significantly higher in the dry season with station 1 recording the highest concentration and station 3 recording the lowest concentration in the wet season (Fig. 5). There was no statistical difference in COD between the two years of study (F11, 60 = 88.58, p = 0.0001). Carbon dioxide and total alkalinity showed similar pattern in their concentration among the stations and in the seasons. The two factors were statistically higher in the dry season as well as in Station 3 (F11, 60 = 28.34, p = 0.0001 and F11,60 = 41.83, p = 0.0001). Carbon dioxide ranged between monthly mean of 1.6mg/l ±0.2 to 3.0mg/l ±0.6 (Fig. 6) while total alkalinity fluctuated between monthly mean of 30mg/l ±2.6 and 55mg/l ±3.4 (Fig. 7).
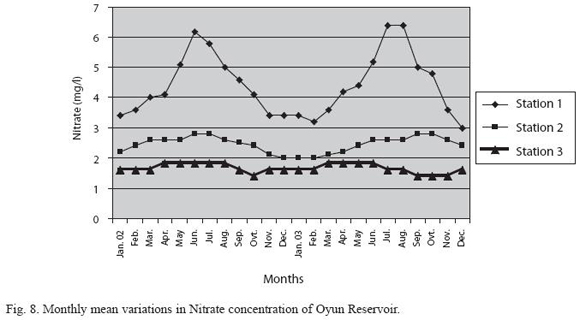
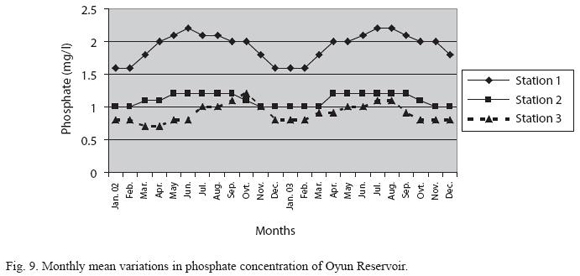
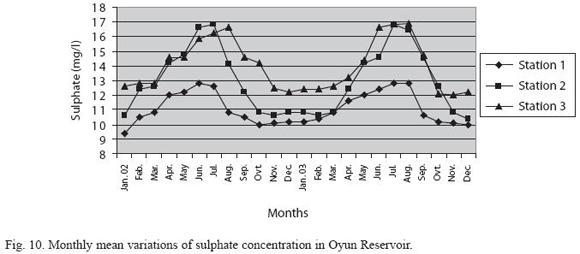
The highest monthly mean concentration of Nitrate recorded was 6.4mg/l ±0.3 obtained from Station 1 at the peak of the rains in August 2003. Adecrease was observed in the dry season with the lowest concentration of 1.4mg/l ±0.1 recorded from Station 3 in October 2003 (Fig. 8). ANOVA shows significant difference in the nitrate concentration during the seasons and within the stations (F11, 60 = 68.54, p = 0.0001). Nitrate was higher in the raining season and the order of magnitude in the concentration among the stations was station 1 > 2 > 3. Phosphate had the least concentration among the ions. It ranged between 0.7mg/l ±0.0 to 2.2mg/l ±0.2 (Fig. 9). Like Nitrate, phosphate concentration was significantly higher in raining season and in station 1 (F11, 60 = 119.01, p = 0.0001). No significant difference occurred between the years of study in Nitrate and phosphate concentrations. The fluctuations in sulphate concentration are shown in Fig. 10. Sulphate concentration was lowest at 9mg/l ±0.2 at the beginning of the study in Station 1, it gradually increased until a maximum concentration of 16.9mg/l ±0.45 was recorded in Station 3. Sulphate was significantly higher in the wet season while the order of higher concentration among the stations was stations 3 > 2 > 1. No difference occurred within the years (F11, 60 = 11.80, p = 0.0001).
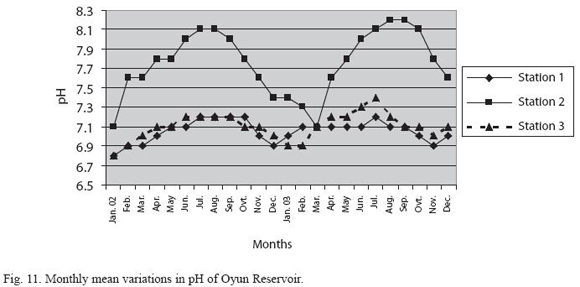
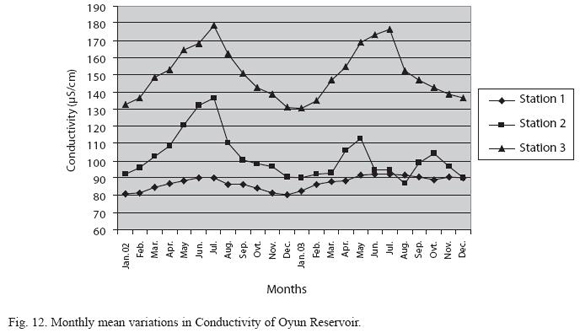
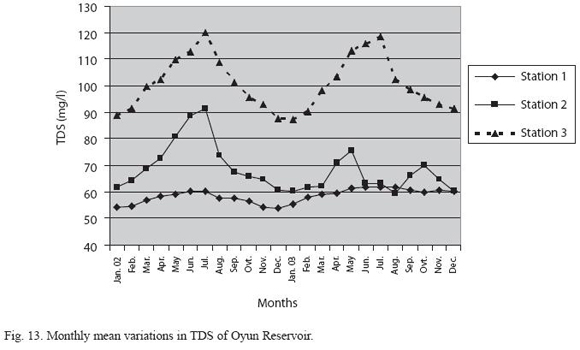
The surface waster pH fluctuated between slight acidity and moderate alkalinity. The lowest monthly mean pH was 6.8 ±0.05 obtained at station 3 during the dry season in January 2002, while the highest was 8.2 ±0.2 obtained from stations 2 in August and September of 2003 (Fig. 11). In the 3 stations, the pH was in the neutral range for most of the study period. No acidic pH was recorded from station 2; it was either neutral or alkaline for most part of the study. ANOvA showed pH to be statistically higher during the wet season than in the dry season and pH of station 2 was significantly higher than the other stations. No difference was noted between the years (F11, 60 = 45.86, p = 00001). The monthly mean variations in electrical conductivity and total dissolved solids (TDS) followed similar trend. There was slight variation in conductivity and TDS in stations 1. The station recorded the lowest value of conductivity (80.4 µs/cm ±0.8) and TDS (53.9mg/l ±0.8) in December 2002 and station 3 recorded the highest variation and concentration of conductivity and TDS with the highest value of conductivity (178.8µs/cm ±2.0) and TDS (119.8mg/l ±2.0) obtained in July 2002 (Figs. 12 and 13). Both electrical conductivity and TDS showed significant differences in their concentrations among the seasons and stations. The two factors were statistically higher during the rainy season (F11, 60 = 63.19, p = 0.0001, = 63.67, p = 0.0001) while the order of significant difference between the stations was station 3 > 2 > 1.
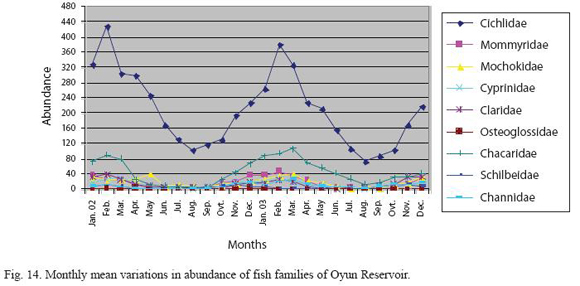
Fish composition and abundance: A total of 7713 fish samples comprising of 18 species belonging to 9 families were recorded from the reservoir (Table 1). The families Cichlidae and Mormyridae were each represented by four species, but Cichlidae dominated the fish species in terms of number and weight with 64.56% and 69.31 % respectively. The families Mochokidae, Cyprinidae and Clariidae were each represented by two species, while Osteoglossidae, Characidae, Schilbeidae and Channidae had one species each. The family Osteoglossidae had the lowest abundance comprising just 0.22%; it also had the lowest weight percentage of 0.82% in the fish population. Among the individual fish species, Tilapia zillii constituting 30.0% and 28.55% by abundance and weight was the dominant species in terms of number and weight, while Heterotis niloticus constituting 0.22% by abundance and Gnathonemus cyprinoides having a weight percentage of 0.29% were the species with the lowest number and weight respectively. Majority of the fish species and families were caught all year round except for Osteoglossidae which was caught for only four months in a year (Fig. 14). The species and families were highly abundant in the dry season between November and May, while in the rains and flood periods, between June and October, there was a decline in their population and diversity. Heterotis niloticus (Family Osteoglossidae), the least abundant species was also found in high numbers during the dry season. Significant higher weight was found in the dry season among the fish population. Low water volume, high transparency and temperature in the dry season might have encouraged high fish catch, while flood and turbid water resulting in low transparency and large water volume which hampered fishing gear efficiency may have caused the low catch ability of fish in the rainy season.
Discussion
Physico-chemical factors: The variations observed in the physico-chemical parameters and fish species composition and abundance of Oyun reservoir could be linked to the various interactions of the human activities on the water shed and competing uses of the reservoir by stakeholders. The various recorded human activities in the watershed of the reservoir include agricultural activities like farming, cassava fermentation, fish landing, scaling, marketing and fishing nets and canoe repair. All these activities were found to be more prevalent in station 1 (the dam axis). The watershed of Oyun reservoir is mainly agricultural with nutrient inputs coming from fertilizer run-off and cassava fermentation which occurs on a large scale around the reservoir, cassava being a staple food in the locality. Thus large amount of particulate organic matter was exported into the reservoir from sediments run-off. The high concentrations of nitrate, phosphate and sulphate during the rains possibly came from the run-off of nitrophosphate and sulphate fertilizers from nearby farmlands into the reservoir. The rainy season is usually the time of high fertilizer applications in the locality (personal observation). Fertilizer application has been reported to be a major disturbance to the watershed (Novotny 2003), while Carpenter et al. (1998) observed that nutrients input from the watershed are a leading cause of eutrophication. Other watershed activities that could have caused the eutrophication include washing and bathing with phosphate based detergents and soaps as well as washing of cow dungs into the reservoir. The nitrate and phosphate concentrations of Oyun reservoir were slightly higher than other reservoirs in Nigeria such as Shiroro (Kolo 1996), Jebba (Adeniji 1991), Ethiope ( Aluyi et al, 2003) and this resulted in cultural eutrophication seen in the reservoir. The eutrophication brought about by high nutrients inputs was termed cultural, because, it was accelerated by human influences and this caused physical, chemical and biological changes to the reservoir. The high conductivity and total dissolved values of the water was a reflection of the high nutrients present in the reservoir, with the two factors having a positive correlation.
Fish composition and abundance: The high sediment run-offs could be responsible for the low fish species abundance in the rainy season through the reduction in light penetration and photosynthesis. This could have altered the food web cycle and food availability to fishes and consequently reduced the fish population. According to Kirk & Gilbert (1990), increase in turbidity driven by the sediments delivered by agricultural watersheds tends to interfere with fish food. High suspended solids which made its way to the reservoir could also have caused the low fish abundance as Total suspended solids TSS have been reported to reduce fish visibility, growth, health and could produce a shift in fish habitat use (Bruton 1985), cover fish spawning sites, smoother their eggs and damage habitat for aquatic insects which are a major food source for the fishes (Holdren et al. 2001).
Many of the watershed activities in the reservoir produced dissolved organic or particulate matter which was washed into the reservoir releasing high amount of carbon, consuming a large concentration of dissolved oxygen, produced high concentration of carbon dioxide and increase the chemical oxygen demand of the water. This is particularly more evident during the dry season when fisheries related activities were at their peak. Thus the low concentration of dissolved oxygen and the high concentration of carbon dioxide and chemical oxygen demand in the dry season could be attributed to this phenomenon. High concentration of carbon dioxide in the dry season might be responsible for the slight acidity of the water (pH 6.8), while total alkalinity acted as a buffer for the pH during most of the time. An important beneficial effect of the allochtonous carbon on fisheries is that population dynamics, predator-prey interactions and the reservoir ecosystems are enhanced (Polis et al. 1997), which could have aided the high fish production in the dry season.
The various human activities in the watershed of Oyun reservoir led to increase in the nutrient levels and inadequate fish assemblages with the preponderance of some species, absence of other species and decline of commercially important species. The human-induced eutrophication which released high amounts of nutrients affected the water quality and species composition and abundance of some species in the reservoir. This is evident in the reduction seen in abundance of commercially important species like Heterotis niloticus and Barbus occidentalis as well as in the absence of some other familiar families and species in the reservoir. In order to arrest further degradation of the water quality and inadequate fish assemblages in the reservoir, various watershed activities that put in high amounts of nutrients and sediments into the reservoir should be halted. Good and safe agricultural practices in the watershed will protect the reservoir water quality and improve the fish diversity and abundance. This could be achieved by protecting the reservoir from run-off of agricultural fertilizers and cow dungs from nearby farmlands, educating the end users of the reservoir on the municipal abuse and misuse of the reservoir and its watershed, as well as in the conservation of the fisheries resources of the reservoir.
These activities identified as contributing to the eutrophication of the reservoir need to be eliminated. Best Management Practices (BMP) which is in use in many reservoirs of developed countries should be adopted and adapted to suit the situation in tropical African reservoirs. We should start to look beyond the traditional in-reservoir management to improve water quality and fish production, but extend the scale of the management to the reservoir catchments area and watershed. This according to Miranda (2008) will enhance the managers ability to impact reservoir fish population and communities.
Acknowledgment
I thank the International Association of Theoretical and Applied Limnology (SIL) for their financial support through the Tonolli Fund for Post Graduate Fellowships in Limnology.
Resumen
Las actividades agrícolas y pesqueras que se desarrollan alrededor del embalse tropical africano de Oyun, Offa, Nigeria, contribuyen de forma significativa al deterioro de la calidad del agua, provocando eutroficación. Esto es evidente a partir de la gran cantidad de nitrato (6.4 mg / l), fosfato (2.2 mg / l) y sulfato (16.9 mg / l), si se compara con otros embalses de Nigeria. Estos nutrientes proceden de fertilizantes utilizados en áreas agrícolas y las concentraciones aumentan en la estación lluviosa cuando aumentan las actividades agrícolas en la zona. La eutroficación es más pronunciada donde existe mayor actividad humana, y altera la cadena trófica y en consecuencia, la composición íctica, con predominio de los cíclidos y disminución de otros peces. Se requiere manejo de la cuenca para reducir la eutrofización y mejorar la calidad del agua y los peces.
Palabras clave: embalse, calidad del agua, grupos ícticos, cuencas hidrográficas, manejo.
Received 09-VI-2008. Corrected 22-II-2009. Accepted 25-III-2009.
References
Adeniji, H.A. 1991. Limnology and Biological production in the pelagic zone of Jebba Lake, Nigeria. Ph.D thesis. University of Ibadan, Ibadan, Nigeria. [ Links ] Aluyi, H.S.A., Atuanya,E.I. & Amoforitse, S.C. 2003. Bacteriological and physico-chemical investigations of Ethiope River, Delta State, Nigeria. Afr. J. of Appl. Zool. & Envt. Biol. 29-36.
APHA (American Public Health Association) 1995. Standard methods for the examination of water and waste water. 19th edition. American Public Health Association, New York, USA. [ Links ]
Brutton, M.N. 1985. Effects of suspensoids on fish. Hydrobiologia 125: 221-241. [ Links ]
Carpenter S.R., N.F. Caranco, D.L. Correll, R.W. Howarth, A.N. Sharpley, & V.H Smith. 1998. Non point pollution of surface waters with Phosphorous and Nitrogen. Ecol Appl. 8: 559-568. [ Links ]
Hach. 2003. Water analysis handbook (Fourth edition), Vol. 2: Hach Chemical Company, Loveland,Colorado, USA. [ Links ]
Holdeen, M. & W. Reed. 1972. West African Freshwater Fish. Longmans Group. London, England. [ Links ]
Holdren, C., W. Jones & J. Taggart. 2001. Managing Lakes and Reservoirs. N. Am. Lake Manage. Soc. and Terrene Inst., in coop. with Off. Water Assess. Watershed Prot. Div. U.S. Environ. Prot. Agency, Madison, Wisconsin, USA. [ Links ]
Karr, J.R. 1991. Biological integrity: A long neglected aspect of water resource management. Ecol. Appl. 1: 66-84. [ Links ]
Kirk, K.L. & J.J. Gilbert. 1990. Suspended clay and the population dynamics of planktonic rotifers and cladocerans. Ecology 71: 1741-1755. [ Links ]
Kolo, R.J. 1999. The asssessment of physico-chemical parameters of Shiroro Lake and its major tributaries. In: Eyo, A.A (ed). Proceeding of the annual conference of the Fisheries Society of Nigeria,Abuja, Nigeria. [ Links ]
Miranda L.E. 2008. Extending the Scale of Reservoir Management. In: M. Allen and S. Sammons (editors). Balancing fisheries management and water uses for impounded river systems. American Fisheries Society. Bethesda, Maryland USA (In press). [ Links ]
Novotny, V. 2003. Water quality: diffuse pollution and water shed management. Wiley, Hoboken, New Jersey, USA. [ Links ]
Polis, G.A., W.B. Anderson. & R.D. Holt. 1997. Toward an integration of landscape and food web ecology: the dynamics of spatially subsidized food webs. Ann. Rev. of Ecol. Syst. 28: 289-316. [ Links ]
Reed, W., J. Burchard, A.J. Hopson. & I. Yaro. 1967. Fish and Fisheries of Northern Nigeria. M.A.N.R. Publ. Nigeria. [ Links ]
SAS Institute. (2003): SAS/Stat Users Guide, version 9.1.3. SAS Institute Inc., Carry, North Carolina, USA. [ Links ]
Van Der Mheen, H. 1995. The use of multi-mesh gill nets for sampling fish stocks in southern Africa. Fisheries Department, FAO, Rome, Italy. [ Links ]

