<?xml version="1.0" encoding="ISO-8859-1"?><article xmlns:mml="http://www.w3.org/1998/Math/MathML" xmlns:xlink="http://www.w3.org/1999/xlink" xmlns:xsi="http://www.w3.org/2001/XMLSchema-instance">
<front>
<journal-meta>
<journal-id>0034-7744</journal-id>
<journal-title><![CDATA[Revista de Biología Tropical]]></journal-title>
<abbrev-journal-title><![CDATA[Rev. biol. trop]]></abbrev-journal-title>
<issn>0034-7744</issn>
<publisher>
<publisher-name><![CDATA[Universidad de Costa Rica]]></publisher-name>
</publisher>
</journal-meta>
<article-meta>
<article-id>S0034-77442014000700008</article-id>
<title-group>
<article-title xml:lang="en"><![CDATA[Assessing the phytoplankton and water quality of Kingston Harbour and Hellshire coast, Jamaica, after the implementation of a waste water treatment facility]]></article-title>
<article-title xml:lang="es"><![CDATA[Evaluación de la calidad de las aguas de la Bahía de Kingston y la costa Hellshire, Jamaica, después de la implementación de una planta de tratamiento de aguas residuales]]></article-title>
</title-group>
<contrib-group>
<contrib contrib-type="author">
<name>
<surname><![CDATA[Liu]]></surname>
<given-names><![CDATA[Helen A.]]></given-names>
</name>
<xref ref-type="aff" rid="A01"/>
</contrib>
<contrib contrib-type="author">
<name>
<surname><![CDATA[Broomfield]]></surname>
<given-names><![CDATA[Sheree A.]]></given-names>
</name>
</contrib>
<contrib contrib-type="author">
<name>
<surname><![CDATA[Duncan]]></surname>
<given-names><![CDATA[Anya F.]]></given-names>
</name>
</contrib>
<contrib contrib-type="author">
<name>
<surname><![CDATA[Grant]]></surname>
<given-names><![CDATA[Leon O.]]></given-names>
</name>
</contrib>
<contrib contrib-type="author">
<name>
<surname><![CDATA[Francis]]></surname>
<given-names><![CDATA[Patrice A.]]></given-names>
</name>
</contrib>
<contrib contrib-type="author">
<name>
<surname><![CDATA[Webber]]></surname>
<given-names><![CDATA[Dale F.]]></given-names>
</name>
</contrib>
<contrib contrib-type="author">
<name>
<surname><![CDATA[Webber]]></surname>
<given-names><![CDATA[Mona K.]]></given-names>
</name>
</contrib>
</contrib-group>
<aff id="A01">
<institution><![CDATA[,The University of the West Indies  ]]></institution>
<addr-line><![CDATA[Mona Kingston 7]]></addr-line>
<country>Jamaica</country>
</aff>
<pub-date pub-type="pub">
<day>00</day>
<month>09</month>
<year>2014</year>
</pub-date>
<pub-date pub-type="epub">
<day>00</day>
<month>09</month>
<year>2014</year>
</pub-date>
<volume>62</volume>
<fpage>241</fpage>
<lpage>248</lpage>
<copyright-statement/>
<copyright-year/>
<self-uri xlink:href="http://www.scielo.sa.cr/scielo.php?script=sci_arttext&amp;pid=S0034-77442014000700008&amp;lng=en&amp;nrm=iso"></self-uri><self-uri xlink:href="http://www.scielo.sa.cr/scielo.php?script=sci_abstract&amp;pid=S0034-77442014000700008&amp;lng=en&amp;nrm=iso"></self-uri><self-uri xlink:href="http://www.scielo.sa.cr/scielo.php?script=sci_pdf&amp;pid=S0034-77442014000700008&amp;lng=en&amp;nrm=iso"></self-uri><abstract abstract-type="short" xml:lang="en"><p><![CDATA[Deteriorating water quality of Kingston Harbour, due primarily to sewage discharge and its effect on nearby Hellshire Coast, has been an issue since the 1970s. The implementation of a new sewage treatment facility in 2007 to receive the harbour&#8217;s waste at Soapberry was expected to make a positive difference. Physico-chemical and biological parameters were used to assess water quality to determine the effect of the facility. Eleven stations used in earlier studies (1990 to 1998) were re-sampled to represent Kingston, Hunts Bay and North East Hellshire coastline over a four week sampling regime between May and June 2011. While temperature, salinity, turbidity, dissolved oxygen and pH remained unchanged between the 1990&#8217;s and 2011, BOD5, faecal coliform and nitrate concentrations indicated that the water quality had improved minimally in Kinsgton and Hellshire,and deteriorated significantly in Hunts. Phytoplankton biomass decreased in Kingston (from 3.84 mg m-3 in 1998 to 2.81 mg m-3 in 2011) and increased significantly in Hunts (from 14.69 mg m-3 in 1998 to 24.17 mg m-3 in 2011). Biomass along Hellshire was similar (2.15 mg m-3 in 1998; 2.45 mg m-3 in 2011). In 1998 the nanoplankton biomass (2.7 to 20&#956;m) dominated throughout the Harbour. In 2011 Hunts Bay was dominated by net-plankton (>20&#956;m), indicative of eutrophic waters.]]></p></abstract>
<abstract abstract-type="short" xml:lang="es"><p><![CDATA[El deterioro de la calidad del agua del puerto de Kingston es debido principalmente a la descarga de aguas residuales y su efecto en los alrededores de la Costa de Hellshire, esto ha sido un problema desde la década de 1970. La implementación de una nueva planta de tratamiento de aguas residuales en 2007 para recibir residuos del Puerto de Kingston en Soapberry se esperaba hiciera una diferencia positiva. Parámetros físico-químicos y biológicos fueron utilizados para evaluar la calidad del agua y determinar el efecto de la planta de tratamiento. Once estaciones que fueron utilizadas en estudios anteriores (1990-1998) se muestrearon nuevamente para representar el puerto de Kingston, Bahía Hunts y la costa North East Hellshire sobre un régimen de muestreo de cuatro semanas entre mayo y junio de 2011. Mientras la temperatura, salinidad, turbidez, oxígeno disuelto y pH se mantuvieron sin cambios entre los años noventa y 2011, BOD5, coliformes fecales y concentraciones de nitratos indicaron que había mejorado la calidad del agua del puerto y la costa mínimamente mientras que la calidad del agua en la bahía Hunts se había deteriorado significativamente. La biomasa del fitoplancton disminuyó en el puerto de Kingston (de 3.84mg m-3 en 1998 a 2.81mg m-3 en el 2011), y aumentó significativamente en bahía Hunts (de 14.69mg m-3 en 1998 a 24.17mg m-3 en el 2011). La biomasa en la costa permaneció similar (de 2.15mg m-3 en 1998 a 2.45mg m-3 en 2011). En 1998 la biomasa de nanoplancton (2.7 a 20&#956;m) dominó a lo largo del puerto. En el 2011 la bahía Hunts era dominada por neto-plancton (>20&#956;m), indicativo de aguas eutróficas.]]></p></abstract>
<kwd-group>
<kwd lng="en"><![CDATA[Soapberry]]></kwd>
<kwd lng="en"><![CDATA[waste water]]></kwd>
<kwd lng="en"><![CDATA[Kingston Harbour]]></kwd>
<kwd lng="en"><![CDATA[Hunts Bay]]></kwd>
<kwd lng="en"><![CDATA[Hellshire]]></kwd>
<kwd lng="en"><![CDATA[eutrophication]]></kwd>
<kwd lng="es"><![CDATA[Soapberry]]></kwd>
<kwd lng="es"><![CDATA[aguas residuales]]></kwd>
<kwd lng="es"><![CDATA[Puerto de Kingston]]></kwd>
<kwd lng="es"><![CDATA[eutrofización]]></kwd>
<kwd lng="es"><![CDATA[Bahía Hunts]]></kwd>
<kwd lng="es"><![CDATA[Hellshire]]></kwd>
</kwd-group>
</article-meta>
</front><body><![CDATA[ <div style="text-align: justify;">     <div style="text-align: center;"><font style="font-weight: bold;"  size="4"><span style="font-family: verdana;">Assessing the phytoplankton and water quality of Kingston Harbour and Hellshire coast, Jamaica, after the implementation of a waste water treatment facility    <br>     <br> </span></font><font style="font-weight: bold;" size="4"><span  style="font-family: verdana;">Evaluaci&oacute;n de la calidad de las aguas de la Bah&iacute;a de kingston y la costa Hellshire, Jamaica, despu&eacute;s de la implementaci&oacute;n de una planta de tratamiento de aguas residuales </span></font><font size="2"><span  style="font-family: verdana;"></span></font><br  style="font-family: verdana;"> </div> <br style="font-family: verdana;">     <div style="text-align: center;"><font size="2"><span      style="font-family: verdana;">Helen A. Liu<sup><a href="#1">1</a><a      name="2"></a>*</sup>,     Sheree A. Broomfield</span></font><a href="#1"><font size="2"><span      style="font-family: verdana;"><sup>1</sup></span></font></a><font      size="2"><span style="font-family: verdana;">,     ]]></body>
<body><![CDATA[Anya F. Duncan</span></font><a href="#1"><font size="2"><span      style="font-family: verdana;"><sup>1</sup></span></font></a><font      size="2"><span style="font-family: verdana;">, Leon O. Grant</span></font><a      href="#1"><font size="2"><span style="font-family: verdana;"><sup>1</sup></span></font></a><font      size="2"><span style="font-family: verdana;">, Patrice A. Francis</span></font><a      href="#1"><font size="2"><span style="font-family: verdana;"><sup>1</sup></span></font></a><font      size="2"><span style="font-family: verdana;">, Dale F. Webber</span></font><a      href="#1"><font size="2"><span style="font-family: verdana;"><sup>1</sup></span></font></a><font      size="2"><span style="font-family: verdana;">     &amp; Mona K. Webber</span></font><a href="#1"><font size="2"><span     ]]></body>
<body><![CDATA[ style="font-family: verdana;"><sup>1</sup></span></font></a><br      style="font-family: verdana;">     </div>     <font size="2"><span style="font-family: verdana;"></span></font>     <hr style="width: 100%; height: 2px;"><font style="font-weight: bold;"      size="3"><span style="font-family: verdana;">Abstract</span></font><br      style="font-family: verdana;">     <font size="2"></font><br style="font-family: verdana;">     <font size="2"><span style="font-family: verdana;">Deteriorating water     quality of     ]]></body>
<body><![CDATA[Kingston Harbour, due primarily to sewage discharge and its effect on     nearby Hellshire Coast, has been an issue since the 1970s. The     implementation of a new sewage treatment facility in 2007 to receive     the harbour&#8217;s waste at Soapberry was expected to make a positive     difference. Physico-chemical and biological parameters were used to     assess water quality to determine the effect of the facility. Eleven     stations used in earlier studies (1990 to 1998) were re-sampled to     represent Kingston, Hunts Bay and North East Hellshire coastline over a     four week sampling regime between May and June 2011. While temperature,     salinity, turbidity, dissolved oxygen and pH remained unchanged between     ]]></body>
<body><![CDATA[the 1990&#8217;s and 2011, </span></font><font size="2"><span      style="font-family: verdana;">BOD<sub>5</sub></span></font><font      size="2"><span style="font-family: verdana;">, faecal coliform and     nitrate concentrations     indicated that the water quality had improved minimally in Kinsgton and     Hellshire,and deteriorated significantly in Hunts. Phytoplankton     biomass decreased in Kingston (from 3.84 mg </span></font><font      size="2"><span style="font-family: verdana;">m<sup>-3</sup></span></font><font      size="2"><span style="font-family: verdana;"> in 1998 to 2.81 mg </span></font><font      size="2"><span style="font-family: verdana;">m<sup>-3</sup></span></font><font     ]]></body>
<body><![CDATA[ size="2"><span style="font-family: verdana;">     in 2011) and increased significantly in Hunts (from 14.69 mg m<sup>-3</sup>     in     1998 to 24.17 mg </span></font><font size="2"><span      style="font-family: verdana;">m<sup>-3</sup></span></font><font      size="2"><span style="font-family: verdana;"> in 2011). Biomass along     Hellshire was similar     (2.15 mg </span></font><font size="2"><span      style="font-family: verdana;">m<sup>-3</sup></span></font><font      size="2"><span style="font-family: verdana;"> in 1998; 2.45 mg </span></font><font     ]]></body>
<body><![CDATA[ size="2"><span style="font-family: verdana;">m<sup>-3</sup></span></font><font      size="2"><span style="font-family: verdana;"> in 2011). In 1998 the     nanoplankton     biomass (2.7 to 20&#956;m) dominated throughout the Harbour. In 2011 Hunts     Bay was dominated by net-plankton (&gt;20&#956;m), indicative of eutrophic     waters.</span></font><br style="font-family: verdana;">     <font size="2"></font><br style="font-family: verdana;">     <font size="2"><span style="font-family: verdana;"><span      style="font-weight: bold;">Key words:</span> Soapberry, waste water,     Kingston Harbour, Hunts Bay, Hellshire, eutrophication.</span></font><br     ]]></body>
<body><![CDATA[ style="font-family: verdana;">     <font size="2"></font><br style="font-family: verdana;">     <font style="font-weight: bold;" size="3"><span      style="font-family: verdana;">Resumen</span></font><br      style="font-family: verdana;">     <font size="2"></font><br style="font-family: verdana;">     <font size="2"><span style="font-family: verdana;">El deterioro de la     calidad del agua del puerto de     Kingston es debido principalmente a la descarga de aguas residuales y     su efecto en los alrededores de la Costa de Hellshire, esto ha sido un     ]]></body>
<body><![CDATA[problema desde la d&eacute;cada de 1970. La implementaci&oacute;n de     una nueva planta de tratamiento de aguas residuales en 2007 para     recibir residuos del Puerto de Kingston en Soapberry se esperaba     hiciera una diferencia positiva. Par&aacute;metros     f&iacute;sico-qu&iacute;micos y biol&oacute;gicos fueron utilizados     para evaluar la calidad del agua y determinar el efecto de la planta de     tratamiento. Once estaciones que fueron utilizadas en estudios     anteriores (1990-1998) se muestrearon nuevamente para representar el     puerto de Kingston, Bah&iacute;a Hunts y la costa North East Hellshire     sobre un r&eacute;gimen de muestreo de cuatro semanas entre mayo y     ]]></body>
<body><![CDATA[junio de 2011. Mientras la temperatura, salinidad, turbidez,     ox&iacute;geno disuelto y pH se mantuvieron sin cambios entre los     a&ntilde;os noventa y 2011, </span></font><font size="2"><span      style="font-family: verdana;">BOD<sub>5</sub></span></font><font      size="2"><span style="font-family: verdana;">, coliformes fecales y     concentraciones     de nitratos indicaron que hab&iacute;a mejorado la calidad del agua del     puerto y la costa m&iacute;nimamente mientras que la calidad del agua     en la bah&iacute;a Hunts se hab&iacute;a deteriorado     significativamente. La biomasa del fitoplancton disminuy&oacute; en el     ]]></body>
<body><![CDATA[puerto de Kingston (de 3.84mg </span></font><font size="2"><span      style="font-family: verdana;">m<sup>-3</sup></span></font><font      size="2"><span style="font-family: verdana;"> en 1998 a 2.81mg </span></font><font      size="2"><span style="font-family: verdana;">m<sup>-3</sup></span></font><font      size="2"><span style="font-family: verdana;"> en el 2011), y     aument&oacute; significativamente en bah&iacute;a Hunts (de 14.69mg </span></font><font      size="2"><span style="font-family: verdana;">m<sup>-3</sup></span></font><font      size="2"><span style="font-family: verdana;">     en 1998 a 24.17mg </span></font><font size="2"><span      style="font-family: verdana;">m<sup>-3</sup></span></font><font     ]]></body>
<body><![CDATA[ size="2"><span style="font-family: verdana;"> en el 2011). La biomasa     en la costa     permaneci&oacute; similar (de 2.15mg </span></font><font size="2"><span      style="font-family: verdana;">m<sup>-3</sup></span></font><font      size="2"><span style="font-family: verdana;"> en 1998 a 2.45mg </span></font><font      size="2"><span style="font-family: verdana;">m<sup>-3</sup></span></font><font      size="2"><span style="font-family: verdana;"> en 2011).     En 1998 la biomasa de nanoplancton (2.7 a 20&#956;m) domin&oacute; a lo     largo del puerto. En el 2011 la bah&iacute;a Hunts era dominada por     neto-plancton (&gt;20&#956;m), indicativo de aguas eutr&oacute;ficas.</span></font><br     ]]></body>
<body><![CDATA[ style="font-family: verdana;">     <font size="2"></font><br style="font-family: verdana;">     <font size="2"><span style="font-family: verdana;"><span      style="font-weight: bold;">Palabras clave:</span> Soapberry, aguas     residuales, Puerto de Kingston, eutrofizaci&oacute;n, Bah&iacute;a     Hunts, Hellshire</span></font><br style="font-family: verdana;">     <br style="font-family: verdana;">     <hr style="width: 100%; height: 2px;"><font size="2"><span      style="font-family: verdana;">Kingston Harbour on     the south east     ]]></body>
<body><![CDATA[coast of the capital of Jamaica (17&ordm;58&#8217;N and 76&ordm;48&#8217;W), is a     multipurpose resource with more than a half a million people and a     variety of industries at its shores (Wade, 1972). These residencies and     industries are the source of large volumes of waste introduced into the     Harbour daily (Webber et al., 2003). Historically, the most significant     point source contributors of organic pollution to the Harbour were the     Greenwich and Western sewage treatment plants discharging 20mgd (Webber     &amp; Wilson-Kelly, 2003). Outflow from the eutrophic Kingston Harbour     has been documented to flow southeasterly to impact the nearby     recreational areas of Hellshire Coast (Webber, Webber &amp; Roff, 1992;     ]]></body>
<body><![CDATA[Webber &amp; Roff, 1996). A new sewage treatment facility, Soapberry,     was constructed and implemented in 2007 to accept and properly treat     the waste from the city of Kingston. It is not however clear whether     the implementation of the Soapberry system has significantly affected     the water quality of Kingston Harbour and resulted in an improvement of     water quality along the Hellshire Coast. A rapid ecological assessment     was therefore conducted. It was designed to:</span></font><br      style="font-family: verdana;">     <font size="2"></font><br style="font-family: verdana;">     <font size="2"><span style="font-family: verdana;">Spatially assess and     ]]></body>
<body><![CDATA[compare the     existing water quality of Kingston Harbour, Hunts Bay and North East     Hellshire Coastline (using physiochemical and biological indices).</span></font><font      size="2"><span style="font-family: verdana;">    <br>     <br> Determine if there was significant improvement or deterioration in water quality when compared to the earlier baseline studies (i.e. prior to the Soapberry waste treatment implementation).</span></font><br  style="font-family: verdana;"> <br style="font-family: verdana;"> <font style="font-weight: bold;" size="3"><span  style="font-family: verdana;">Materials and Methods</span></font><br  style="font-family: verdana;"> <font size="2"></font><br style="font-family: verdana;"> <font size="2"><span style="font-family: verdana;"><span  style="font-weight: bold;">Sample programme: </span>A total of four sampling sessions were conducted during the period of May 21st to June 19<sup>th</sup>,2011, between the hours of 0700hours and 1200hours. Eleven stations (<a href="/img/revistas/rbt/v62s3/a08i1.jpg">Fig. 1</a>) were strategically selected along the North East Hellshire coastline (Stations 1-3), throughout Kingston Harbour (Stations 4&#8211;7) and in Hunts Bay (Stations 8&#8211;11), and based on previous studies by Webber and Roff (1996), Dunbar (1997), Ranston (1998) and Webber &amp; Webber (1998). At each station physicochemical parameters were recorded using a Hydrolab Surveyor with a Datasonde 5 multi-parameter probe and whole water samples were collected at (i) the surface and (ii) 2m above the substrate (&plusmn;0.10oC temperature; &plusmn;0.2ppt Salinity; &plusmn;0.01mg l<sup>-1</sup> LDO; &plusmn;1.0NTU Turbidity; and &plusmn;0.2units pH).</span></font><br  style="font-family: verdana;"> <br style="font-family: verdana;"> <font size="2"><span style="font-family: verdana;"><span  style="font-weight: bold;">Whole water samples:</span> Samples were collected from the surface (fresh water) layer as well as the underlying deeper (more saline layer) using a 6L Niskin bottle. At Hunts Bay, surface samples were collected (i) just below the surface of the water and (ii) deeper samples at 2m above the substrate using a horizontal position Niskin bottle (Ranston, 1998). An aliquot of each water sample was then transferred to 3L plastic bottles and kept in the dark until filtration was possible, generally within four hours of collection. The samples for Biochemical Oxygen Demand (BOD) analysis were collected in 300mL BOD bottles then stored on ice for three (3) hours, prior to analysis. A YSI Model 57 Oxygen meter (&plusmn;0.1mg </span></font><font  size="2"><span style="font-family: verdana;">l<sup>-1</sup></span></font><font  size="2"><span style="font-family: verdana;"> on 0-10 scale) was used to determine the initial dissolved oxygen of each sample. Samples were then incubated for five (5) days at 20oC in total darkness with subsequent re-testing for dissolved oxygen (Eaton, Clesceri &amp; Greenberg, 1995; Webber &amp; Wilson-Kelly, 2003). The </span></font><font size="2"><span  style="font-family: verdana;">BOD<sub>5</sub></span></font><font  size="2"><span style="font-family: verdana;"> for each sample was derived using the formula: </span></font><font size="2"><span  style="font-family: verdana;">BOD<sub>5</sub></span></font><font  size="2"><span style="font-family: verdana;"> = [(Initial DO-Final DO) &times; (1 000mL)]/300mL).</span></font><br  style="font-family: verdana;"> <font size="2"></font><br style="font-family: verdana;"> <font size="2"><span style="font-family: verdana;">The 3L samples were filtered through a size fractioning tower with three filters of known pore sizes (Nitex screening: 20&#956;m, Whatman glassfibre filters (GFD): 2.7&#956;m and Whatman glassfibre filters (GFF): 0.7&#956;m). Samples were gently homogenised prior to filtration. Two pseudo-replicates for each station at each depth were then poured through the fractionating tower. Size fractioning filtration was done within four hours of collection time (Parsons, Maita &amp; Lalli, 1984). Each filter was rolled and then placed in labelled vials and stored in a freezer for later Chlorophyll &#945; analysis. Chlorophyll &#945; was extracted using 90% acetone (Parsons et al.,1984) under dark conditions for 24 hours in a refrigerator (Ranston, 1998). Each extracted sample was read on a Turner Flourometer TD-700. Values were recorded within 12 seconds of cuvettes being placed into the flourometer. Samples that contained high Chlorophyll that could not be read by the flourometer were diluted as outlined in Parsons et al. (1984). Chlorophyll &#945; was calculated using the formula:</span></font><br  style="font-family: verdana;"> <font size="2"></font><br style="font-family: verdana;"> <font size="2"></font>     <div style="text-align: center;"><font size="2"><span  style="font-family: verdana;">mg Chlorophyll &#945; </span></font><font  size="2"><span style="font-family: verdana;">m<sup>-3</sup></span></font><font  size="2"><span style="font-family: verdana;"> = R x (&#957;/V) x Dilution Factor</span></font><br style="font-family: verdana;"> </div> <font size="2"></font><br style="font-family: verdana;"> <font size="2"><span style="font-family: verdana;">(Parsons et al., 1984)</span></font><br style="font-family: verdana;"> <font size="2"></font><br style="font-family: verdana;"> <font size="2"><span style="font-family: verdana;">Where: R = Flourometer reading; &#957; = acetone extraction volume (mL); V = volume of seawater filtered (l)</span></font><br  style="font-family: verdana;"> <font size="2"></font><br style="font-family: verdana;"> <font size="2"><span style="font-family: verdana;"><span  style="font-weight: bold;">Nutrient Analysis: </span>Approximately 250mL of the filtrate from the size fractioning tower for each station was frozen for nutrient analysis. Nutrient samples were analysed on a Lachat QuickChem 8 000 Flow Injection Analyser (&plusmn;0.001mg </span></font><font  size="2"><span style="font-family: verdana;">l<sup>-1</sup></span></font><font  size="2"><span style="font-family: verdana;">), using sulfanilamide colour reagent, ammonium chloride buffer, and a cadmium reduction column. Samples were run with the cadmium column online for total nitrate+nitrite analysis, and offline for phosphate and nitrate analysis.</span></font><br style="font-family: verdana;"> <font size="2"></font><br style="font-family: verdana;"> <font size="2"><span style="font-family: verdana;"><span  style="font-weight: bold;">Bacteriological analysis:</span> Coliform bacterial density was determined as Most Probable Number (MPN) counts using the multiple tubes fermentation technique. A series of dilutions of the samples were prepared; these dilutions were 1.0mL, 0.1mL and 0.01mL. Five aliquots of each were inoculated into the growth medium and were incubated. A positive score was recorded whenever bubbles were formed as a result of fermentation. Lauryl Tryptose broth formed the presumptive phase and <span style="font-style: italic;">Escherichia coli</span> broth medium with Durham inverted tube formed the confirmatory phase (Eaton et al., 1995).</span></font><br  style="font-family: verdana;"> <font size="2"></font><br style="font-family: verdana;"> <font style="font-weight: bold;" size="3"><span  style="font-family: verdana;">Results</span></font><br  style="font-family: verdana;"> <font size="2"></font><br style="font-family: verdana;"> <font size="2"><span style="font-family: verdana;">The one month survey of the water quality of the Kingston Harbour provided important insight into the changes in that body of water. These changes were as a result of the introduction of a diverted sewage discharge over a short time period. The evidence of the spatial changes in key water quality parameters are divided here into physicochemical and biological indices.</span></font><br  style="font-family: verdana;"> <font size="2"></font><br style="font-family: verdana;"> <font size="2"><span style="font-family: verdana;"><span  style="font-weight: bold;">Physiochemical indices:</span> Temperature, salinity, dissolved oxygen; turbidity and pH were all within the expected ranges for coastal nearshore systems and demonstrated the spatial pattern consistent with the findings of Webber &amp; Webber (1998). Lowest salinity and temperature accompanied by highest dissolved oxygen and pH were evident in Hunts Bay, while highest salinity and temperature and lowest pH were observed along the Hellshire Coast. There were also no significant differences in physicochemical indices in the 2011 study when compared to data collected in the surveys from the 1990&#8217;s.</span></font><br  style="font-family: verdana;"> <font size="2"></font><br style="font-family: verdana;"> <font size="2"><span style="font-family: verdana;">
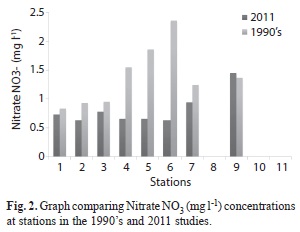
Nitrate-N concentrations were spatially variable with the expected increase from the previously classified mesotrophic Hellshire Coast, into the eutrophic Hunts Bay. The concentrations of nitrates were lowest along the Hellshire coast (0.63 to 0.78mg </span></font><font size="2"><span  style="font-family: verdana;">l<sup>-1</sup></span></font><font  size="2"><span style="font-family: verdana;"> at stations 2 and 3), marginally higher in the Kingston Harbour (0.63 to 0.94mg </span></font><font size="2"><span  style="font-family: verdana;">l<sup>-1</sup></span></font><font  size="2"><span style="font-family: verdana;"> at stations 6 and 7) and highest in Hunts Bay (1.45mg </span></font><font size="2"><span  style="font-family: verdana;">l<sup>-1</sup></span></font><font  size="2"><span style="font-family: verdana;"> at station 9). While nitrate concentrations were much lower in 2011 than in the 1990&#8217;s (<a href="#Fig2">Fig. 2</a>) values in both studies were higher than the NEPA (2009) ambient marine water quality nitrate standard of 0.007-0.014 mg </span></font><font size="2"><span  style="font-family: verdana;">l<sup>-1</sup></span></font><font  size="2"><span style="font-family: verdana;">.    <br>     <br> </span></font>     <div style="text-align: center;"><font size="2"><span  style="font-family: verdana;"><a name="Fig2"></a><img alt=""  src="/img/revistas/rbt/v62s3/a08i2.jpg"  style="width: 300px; height: 232px;"></span></font><br  style="font-family: verdana;"> <font size="2"><span style="font-family: verdana;"></span></font></div> <br style="font-family: verdana;"> <font size="2"><span style="font-family: verdana;"><span  style="font-weight: bold;">Biological indices:</span> Mean phytoplankton biomass (as Chlorophyll &#945;) in the 2011 study increased from the Hellshire Coast (1.8 to 2.19mg </span></font><font size="2"><span  style="font-family: verdana;">m<sup>-3</sup></span></font><font  size="2"><span style="font-family: verdana;"> at Stations 2 and 3) into the Kingston Harbour (1.7 to 3.8mg </span></font><font size="2"><span  style="font-family: verdana;">m<sup>-3</sup></span></font><font  size="2"><span style="font-family: verdana;"> at stations 6 and 7) and reached a maximum in Hunts Bay (12.6 to 33.1mg </span></font><font size="2"><span  style="font-family: verdana;">m<sup>-3</sup></span></font><font  size="2"><span style="font-family: verdana;"> at stations 8&#8211;11). While this spatial pattern was similar to the 1998 studies, t-tests revealed significant difference (p= 0.02) between the two studies. The highest biomass in 1990&#8217;s of 13.5 mg </span></font><font size="2"><span  style="font-family: verdana;">m<sup>-3</sup></span></font><font  size="2"><span style="font-family: verdana;"> was observed in Hunts Bay with lowest values at Hellshire Bay 1.38mg </span></font><font size="2"><span  style="font-family: verdana;">m<sup>-3</sup></span></font><font  size="2"><span style="font-family: verdana;">. Phytoplankton biomass in the Kingston Harbour was however unchanged between 1990&#8217;s and 1998. The single exception was at station 6 where biomass values decreased from 4.17 to 1.70 mg </span></font><font size="2"><span  style="font-family: verdana;">m<sup>-3</sup></span></font><font  size="2"><span style="font-family: verdana;"> between 1998 and 2011. Both surface and deep water phytoplankton biomass in 2011 were greater than in the 1990&#8217;s except at stations 9 and 11 (Hunts Bay) where sub-surface biomass in 1990&#8217;s were greater than 2011 (<a href="/img/revistas/rbt/v62s3/a08i3.jpg">Fig. 3a, b, c &amp; d</a>).</span></font><br style="font-family: verdana;"> <font size="2"></font><br style="font-family: verdana;"> <font size="2"><span style="font-family: verdana;">The nanoplankton biomass size fraction dominated surface waters at all stations in both the 2011 and 1990&#8217;s studies, although the net plankton biomass size fraction accounted for a larger proportion of total phytoplankton biomass in the 2011 samples. This was especially so in Hunts Bay (stations 8-11) which clearly reflected that deep waters were dominated by the net plankton biomass size fraction (<a href="/img/revistas/rbt/v62s3/a08i3.jpg">Fig. 3c &amp; 3d</a>).</span></font><br style="font-family: verdana;"> <font size="2"></font><br style="font-family: verdana;"> <font size="2"><span style="font-family: verdana;">
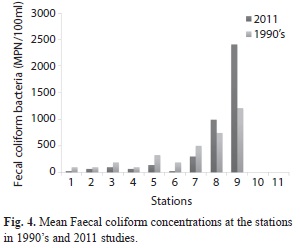
Faecal coliform counts increased from station 1 along Hellshire coast to station 9 in Hunts Bay (<a  href="#Fig4">Fig. 4</a>). Coliform concentration ranged from &lt;20 to 1 200MPN/100mL with highest concentration at station 9, while the lowest concentrations were found at stations 1 to 3 (Hellshire Coast). Apart from station 9 in Hunts Bay all other values were below the World Health Organization (WHO) 1988 standard of 1 000MPN/100 mL (Owili, 2003) but higher than the National Environment and Planning Agency [NEPA], 2009) standard of &lt;2-13MPN/100mL for ambient marine waters. Faecal coliform counts along the North East Hellshire coast and in the Kingston Harbour were generally lower in the 2011 (20 to 300MPN/100 mL) than the 1990&#8217;s (&gt;500MPN/100 mL) while counts in Hunts Bay were higher in 2011 (&gt;2 400MPN/100 mL) than in the 1990&#8217;s (1 200MPN/100 mL).    ]]></body>
<body><![CDATA[<br>     <br> </span></font>     <div style="text-align: center;"><font size="2"><span  style="font-family: verdana;"><a name="Fig4"></a><img alt=""  src="/img/revistas/rbt/v62s3/a08i4.jpg"  style="width: 300px; height: 248px;"></span></font><br  style="font-family: verdana;"> <font size="2"><span style="font-family: verdana;"></span></font></div> <br style="font-family: verdana;"> <font size="2"><span style="font-family: verdana;">The </span></font><font  size="2"><span style="font-family: verdana;">BOD<sub>5</sub></span></font><font  size="2"><span style="font-family: verdana;"> values recorded in both studies ranged from 1 to 52mg </span></font><font size="2"><span  style="font-family: verdana;">l<sup>-1</sup></span></font><font  size="2"><span style="font-family: verdana;">. The lowest </span></font><font  size="2"><span style="font-family: verdana;">BOD<sub>5</sub></span></font><font  size="2"><span style="font-family: verdana;"> value was recorded along the Hellshire Coast at station 3 (2.8mg </span></font><font  size="2"><span style="font-family: verdana;">l<sup>-1</sup></span></font><font  size="2"><span style="font-family: verdana;">) in 2011 and station 1 (1mg </span></font><font size="2"><span style="font-family: verdana;">l<sup>-1</sup></span></font><font  size="2"><span style="font-family: verdana;">) in 1990&#8217;s. While samples from the Kingston Harbour were observed to have much reduced </span></font><font size="2"><span  style="font-family: verdana;">BOD<sub>5</sub></span></font><font  size="2"><span style="font-family: verdana;"> in 2011(4.6 to 4.9mg </span></font><font  size="2"><span style="font-family: verdana;">l<sup>-1</sup></span></font><font  size="2"><span style="font-family: verdana;">) over the 1998 data (10-35mg </span></font><font size="2"><span  style="font-family: verdana;">l<sup>-1</sup></span></font><font  size="2"><span style="font-family: verdana;">), water samples from Hunts Bay were observed to consistently have the highest </span></font><font size="2"><span  style="font-family: verdana;">BOD<sub>5</sub></span></font><font  size="2"><span style="font-family: verdana;"> in both studies 50 to 52mg </span></font><font size="2"><span style="font-family: verdana;">l<sup>-1</sup></span></font><font  size="2"><span style="font-family: verdana;"> (<a  href="/img/revistas/rbt/v62s3/a08i5.jpg">Fig. 5</a>).    <br>     </span></font><br style="font-family: verdana;">     <font style="font-weight: bold;" size="3"><span      style="font-family: verdana;">Discussion</span></font><br      style="font-family: verdana;">     <font size="2"></font><br style="font-family: verdana;">     <font size="2"><span style="font-family: verdana;">Physico-chemical     ]]></body>
<body><![CDATA[parameters and the     phytoplankton community were used to assess the current water quality     in The Kingston Harbour, Hunts Bay and the North East Hellshire     Coastline. The objectives of the study were to spatially compare the     existing water quality of and to determine if there was significant     change in water quality when compared to the earlier baseline studies     (i.e. before the Soapberry Treatment Facility implementation).</span></font><br      style="font-family: verdana;">     <font size="2"></font><br style="font-family: verdana;">     <font size="2"><span style="font-family: verdana;">A specified     ]]></body>
<body><![CDATA[concentration of     nutrients in an environment has the ability to serve as an indicator of     pollution to that environment (James &amp; Adejare, 2010). Nitrate     concentrations at all sample stations were several times greater than     the upper limit established by NEPA. This is due to the nutrient rich     waters which enter the Harbour from sewage treatment as well as river     and storm water inflow (Webber &amp; Wilson-Kelly, 2003) as well as the     nitrate recycling that is thought to take place from the benthos.     Though greater than the NEPA standard, according to Seroka (2004) and     James &amp; Adejare (2010), nitrate values less than 5mg </span></font><font     ]]></body>
<body><![CDATA[ size="2"><span style="font-family: verdana;">l<sup>-1</sup></span></font><font      size="2"><span style="font-family: verdana;"> can still     be indicative of unpolluted waters. Therefore Kingston Harbour nitrate     values are not a good index of water quality. However, lower nitrate     values in the Kingston Harbour and Hellshire coast suggest a reduction     in nutrient input or uptake by the biota resulting in improved water     quality.</span></font><br style="font-family: verdana;">     <font size="2"></font><br style="font-family: verdana;">     <font size="2"><span style="font-family: verdana;">Using the Faecal     coliform bacteria     ]]></body>
<body><![CDATA[counts as the index, Hunts Bay, the Kingston Harbour and the Northern     Hellshire Coast are all still heavily polluted based on NEPA standards     for coastal waters. By WHO standards, the sample area is moderately     polluted with Hunts Bay continuing to be extreme. However at the same     time, Kingston Harbour and the Hellshire Coast coliform counts have     reduced from the initial 1990&#8217;s values indicating some improvement.     These data imply that improperly treated sewage is still entering the     Harbour area and that its waters are not safe for human contact with     human skin. Based on the relative locations of the previous point     sources (now diverted to the Soapberry Treatment Facility) and the     ]]></body>
<body><![CDATA[discharge from that facility into Hunts Bay, it appears that the     improvement in water quality in Kingston Harbour and Hellshire Coast     and reduction in Hunts Bay are associated with the Soapberry Treatment     Facility implementation.</span></font><br style="font-family: verdana;">     <font size="2"></font><br style="font-family: verdana;">     <font size="2"><span style="font-family: verdana;">Biochemical Oxygen     Demand values     obtained for each station surpassed the range (1.16mg </span></font><font      size="2"><span style="font-family: verdana;">l<sup>-1</sup></span></font><font      size="2"><span style="font-family: verdana;">) set out by     ]]></body>
<body><![CDATA[NEPA for ambient marine water. This suggests a general poor water     quality throughout the area. Although all values were in excess of the     national threshold (i.e. NEPA), the spatial differences observed were     not unexpected. That is, with Hunts Bay having the highest </span></font><font      size="2"><span style="font-family: verdana;">BOD<sub>5</sub></span></font><font      size="2"><span style="font-family: verdana;"> and     thus the poorest water quality and the Harbour and Hellshire Coast both     having similar but lower </span></font><font size="2"><span      style="font-family: verdana;">BOD<sub>5</sub></span></font><font      size="2"><span style="font-family: verdana;"> values (2.8 to 4.8mg </span></font><font     ]]></body>
<body><![CDATA[ size="2"><span style="font-family: verdana;">l<sup>-1</sup></span></font><font      size="2"><span style="font-family: verdana;">). This was also     expected since Hunts Bay is almost totally enclosed and receives     inflows from (i) Sandy Gully which is the largest storm water drainage     gully in the City of Kingston, (ii) the Rio Cobre which drains     extensive farming areas of Jamaica as well as (iii) the newly     commissioned Soapberry Treatment Facility. The significantly lower </span></font><font      size="2"><span style="font-family: verdana;">BOD<sub>5</sub></span></font><font      size="2"><span style="font-family: verdana;">     values observed in 2011 compared with the 1990&#8217;s values indicate that     ]]></body>
<body><![CDATA[despite the improvement in water quality in the Harbour and along     Hellshire Coast since the 1990&#8217;s, the levels are still elevated     indicating the presence of organic and inorganic pollution, especially     in Hunts Bay.</span></font><br style="font-family: verdana;">     <font size="2"></font><br style="font-family: verdana;">     <font size="2"><span style="font-family: verdana;">Nutrients, water     clarity,     biochemical oxygen demand, chemical contaminants and bacteria are the     indices frequently employed in determining water quality. Although the     planktonic community is tedious to analyse, it is perhaps the most     ]]></body>
<body><![CDATA[reliable tool in the assessment of water quality and possible changes     due to eutrophication (Webber &amp; Webber, 1998). This can be due to     nutrients being taken up rapidly by the phytoplankton (Satsmadjis,     1985), short generation times, motile existence and reaction with     pollutants such as oils and toxins (Webber &amp; Webber, 1998).</span></font><br      style="font-family: verdana;">     <font size="2"></font><br style="font-family: verdana;">     <font size="2"><span style="font-family: verdana;">Total phytoplankton     biomass values     as Chlorophyll &#945;, were generally higher for all stations located in     ]]></body>
<body><![CDATA[Hunts Bay than for those recorded in Kingston Harbour and Hellshire.     This pattern is similar to that observed in the extensive studies of     the 1990&#8217;s (Ranston, 1998). However, while the pattern remains the     same, the doubling of phytoplankton biomass values observed in Hunts     Bay indicates a significant increase in nutrient, or introduction of     biomass. Thompson &amp; Ho (1981) examined the effects of sewage     discharge on phytoplankton population in Hong Kong. Their results     showed estuarine waters influenced by riverine discharge had     Chlorophyll &#945; values between 2 and 6mg </span></font><font size="2"><span      style="font-family: verdana;">m<sup>-3</sup></span></font><font     ]]></body>
<body><![CDATA[ size="2"><span style="font-family: verdana;"> while values ranged     between     12 and 20mg </span></font><font size="2"><span      style="font-family: verdana;">m<sup>-3</sup></span></font><font      size="2"><span style="font-family: verdana;"> in waters that were     influenced by untreated sewage     effluent. Hunts Bay values are extremely elevated (33.1mg </span></font><font      size="2"><span style="font-family: verdana;">m<sup>-3</sup></span></font><font      size="2"><span style="font-family: verdana;">) compared     with Thompson &amp; Ho (1981) values. This suggests that Hunts Bay is     ]]></body>
<body><![CDATA[even more eutrophic than in the 1990&#8217;s when average values were     approximately 13.5mg </span></font><font size="2"><span      style="font-family: verdana;">m<sup>-3</sup></span></font><font      size="2"><span style="font-family: verdana;">. The pattern was     repeated for subsurface total     biomass with Hunts Bay demonstrating reduced water quality. However     Kingston Harbour and Hellshire Coast had lower total biomass values     indicating improved water quality.</span></font><br      style="font-family: verdana;">     <font size="2"></font><br style="font-family: verdana;">     ]]></body>
<body><![CDATA[<font size="2"><span style="font-family: verdana;">Simmonds (1997) and     Ranston (1998)     found that the waters throughout Kingston Harbour and Hunts Bay were     dominated by the nanoplankton Chlorophyll a size fraction which     accounted for more than 50% of the standing crop. Ranston and Webber     (2003) determined that there was a sporadic enrichment of relatively     higher concentrations of nutrients, which could occasionally support     greater proportions of net plankton biomass throughout Hunts Bay. The     2011 dominance of the net plankton size fraction biomass in both the     surface and the deep values in Hunts Bay suggest that nutrient inputs     ]]></body>
<body><![CDATA[increased significantly since the 1990&#8217;s and resulted in the     proliferation of larger size fraction. In 1998, Ranston suggested that     while Hunts Bay nutrient values were high for both surface and deep     waters, low variability among values suggested that there are     consistently high nutrient inputs but not high enough to support large     proportions of net plankton. Smaller cells can grow faster at lower     nutrient concentrations, whereas larger cells require higher     concentrations to achieve equivalent growth rates (Hopcroft &amp; Roff,     1990). The dominance of net plankton, which are better able to absorb     nutrients when present in large quantities, is an indication of     ]]></body>
<body><![CDATA[nutrient enriched waters in Hunts Bay (Webber &amp; Webber, 1998).     Nanoplankton have greater surface to area volume and can absorb     nutrients more efficiently at lower concentrations than net plankton     (Ranston, 1998). Picoplankton are indicators of oligotrophic waters as     their small size allows them to absorb nutrients when nutrient levels     are low (Ranston et al., 2003).</span></font><br      style="font-family: verdana;">     <font size="2"></font><br style="font-family: verdana;">     <font size="2"><span style="font-family: verdana;">Another possible     explanation for     ]]></body>
<body><![CDATA[the size class shift in the phytoplankton is the possible release of     larger species or chains of phytoplankton cells from the Soapberry     Treatment Facility, especially since the species used in the pond     treatments are large and chain forming (e.g. Scenedesmus sp. and     Spirulina sp.). Such species would both increase the biomass and change     the size fraction dominance. However, Polat and Aka (2007) stated that     the physical and chemical properties of a given environment are very     important in controlling phytoplankton size distribution and further     state that both the large and small size fractions can contribute     similarly to the overall total phytoplankton biomass. Hunts Bay may be     ]]></body>
<body><![CDATA[a one of those areas with special chemical and physical properties     (Ranston &amp; Webber, 2003).</span></font><br      style="font-family: verdana;">     <font size="2"></font><br style="font-family: verdana;">     <font size="2"><span style="font-family: verdana;">The comparison     between this study     and the one conducted by Webber and Webber (1998) provides evidence     that the water quality in the Kingston Harbour has indeed improved over     the 15 year period due to the 73% reduction seen in nitrates, 82%     reduction in Biochemical Oxygen Demand and 50% reduction in     ]]></body>
<body><![CDATA[phytoplankton biomass ( all of which were significant). However despite     these general reductions, areas of the Harbour are still very polluted     with Hunts Bay having reduced water quality since the 1998 study. This     is evident by the higher nitrates (increased by 6%) and Biochemical     Oxygen Demand concentrations (increased by 4%) than previously observed     in 1998. Moreover, Chlorophyll &#945; values at stations in Hunts Bay were     increased by almost 90% over previously recorded 1998 values. There was     also a shift in phytoplankton size class domination towards a more     eutrophic profile in Hunts Bay. Therefore, after the implementation of     a new waste water treatment facility for the city of Kingston, the     ]]></body>
<body><![CDATA[water quality of the Kingston Harbour and the northern Hellshire Coast     has improved, while important parameters indicate a deterioration of     water quality in Hunts Bay.</span></font><br      style="font-family: verdana;">     <font size="2"></font><br style="font-family: verdana;">     <font style="font-weight: bold;" size="3"><span      style="font-family: verdana;">Acknowledgments</span></font><br      style="font-family: verdana;">     <font size="2"></font><br style="font-family: verdana;">     <font size="2"><span style="font-family: verdana;">We thank the staff     ]]></body>
<body><![CDATA[of the     University of the West Indies, Port Royal Marine Laboratory for their     assistance with fieldwork collection. Funding was provided by the     Department of Life Sciences, UWI.</span></font><br      style="font-family: verdana;">     <br style="font-family: verdana;">     <hr style="width: 100%; height: 2px;"><font style="font-weight: bold;"      size="3"><span style="font-family: verdana;">References</span></font><br      style="font-family: verdana;">     <br style="font-family: verdana;">     ]]></body>
<body><![CDATA[<!-- ref --><div style="text-align: left;"><font size="2"><span  style="font-family: verdana;">Dunbar, F. N. (1997). <span style="font-style: italic;">Zooplankton abundance and community structure in Kingston Harbour, a polluted tropical embayment.</span> M. Phil. Thesis, The University of the West Indies, Mona, Jamaica.    &nbsp;&nbsp;&nbsp;&nbsp;&nbsp;&nbsp;&nbsp;&nbsp;[&#160;<a href="javascript:void(0);" onclick="javascript: window.open('/scielo.php?script=sci_nlinks&ref=1771496&pid=S0034-7744201400070000800001&lng=','','width=640,height=500,resizable=yes,scrollbars=1,menubar=yes,');">Links</a>&#160;]<!-- end-ref --><!-- ref --></span></font><br style="font-family: verdana;"> <br style="font-family: verdana;"> <font size="2"><span style="font-family: verdana;">Eaton, A. D., Clesceri, L. S., &amp; Greenberg, A. E. (1995). <span style="font-style: italic;">Standard methods for examination of water and wastewater.</span> 19th Edition. Washington D.C.: American Public Health Association.    &nbsp;&nbsp;&nbsp;&nbsp;&nbsp;&nbsp;&nbsp;&nbsp;[&#160;<a href="javascript:void(0);" onclick="javascript: window.open('/scielo.php?script=sci_nlinks&ref=1771497&pid=S0034-7744201400070000800002&lng=','','width=640,height=500,resizable=yes,scrollbars=1,menubar=yes,');">Links</a>&#160;]<!-- end-ref --><!-- ref --></span></font><br style="font-family: verdana;"> <br style="font-family: verdana;"> <font size="2"><span style="font-family: verdana;">Hopcroft. R. R., &amp; Roff J. C. (1990). Phytoplankton size fractions in a tropical neritic ecosystem near Kingston Jamaica. <span style="font-style: italic;">Journal of Plankton Research, 12</span>, 1069-1088.    &nbsp;&nbsp;&nbsp;&nbsp;&nbsp;&nbsp;&nbsp;&nbsp;[&#160;<a href="javascript:void(0);" onclick="javascript: window.open('/scielo.php?script=sci_nlinks&ref=1771498&pid=S0034-7744201400070000800003&lng=','','width=640,height=500,resizable=yes,scrollbars=1,menubar=yes,');">Links</a>&#160;]<!-- end-ref --><!-- ref --></span></font><br  style="font-family: verdana;"> <br style="font-family: verdana;"> <font size="2"><span style="font-family: verdana;">James, B. K., &amp; Adejare, L. I. (2010). Nutrients and phytoplankton dynamica of a tropical harbour in relation to water quality indices.<span style="font-style: italic;"> Journal of American Science. 6</span>(9), 261-275.    &nbsp;&nbsp;&nbsp;&nbsp;&nbsp;&nbsp;&nbsp;&nbsp;[&#160;<a href="javascript:void(0);" onclick="javascript: window.open('/scielo.php?script=sci_nlinks&ref=1771499&pid=S0034-7744201400070000800004&lng=','','width=640,height=500,resizable=yes,scrollbars=1,menubar=yes,');">Links</a>&#160;]<!-- end-ref --><!-- ref --></span></font><br style="font-family: verdana;"> <br style="font-family: verdana;"> <font size="2"><span style="font-family: verdana;">National Environment and Planning Agency. (2009). <span style="font-style: italic;">Draft Jamaica National Ambient Water Quality Standard - Marine Water.</span> Retrieved from http://www.nepa.gov.jm/standards/water_quality_standard_marine.pdf.    &nbsp;&nbsp;&nbsp;&nbsp;&nbsp;&nbsp;&nbsp;&nbsp;[&#160;<a href="javascript:void(0);" onclick="javascript: window.open('/scielo.php?script=sci_nlinks&ref=1771500&pid=S0034-7744201400070000800005&lng=','','width=640,height=500,resizable=yes,scrollbars=1,menubar=yes,');">Links</a>&#160;]<!-- end-ref --><!-- ref --></span></font><br  style="font-family: verdana;"> <a  href="http://www.nepa.gov.jm/standards/water_quality_standard_marine.pdf"></a><br  style="font-family: verdana;"> <font size="2"><span style="font-family: verdana;">Owili, M. A. (2003). <span style="font-style: italic;">Assessment of Impact of sewage effluents on coastal water quality in Hafnarjordur, Iceland.</span> Retrieved from http://www.unuftp.is/static/fellows/document/monicaprf03.pdf.    &nbsp;&nbsp;&nbsp;&nbsp;&nbsp;&nbsp;&nbsp;&nbsp;[&#160;<a href="javascript:void(0);" onclick="javascript: window.open('/scielo.php?script=sci_nlinks&ref=1771501&pid=S0034-7744201400070000800006&lng=','','width=640,height=500,resizable=yes,scrollbars=1,menubar=yes,');">Links</a>&#160;]<!-- end-ref --><!-- ref --></span></font><br  style="font-family: verdana;"> <br style="font-family: verdana;"> <font size="2"><span style="font-family: verdana;">Parsons, T. R., Maita, Y., &amp; Lalli, C. M. (1984). <span style="font-style: italic;">A manual of chemical and biological methods for seawater analysis. </span>Pergamon Press.    &nbsp;&nbsp;&nbsp;&nbsp;&nbsp;&nbsp;&nbsp;&nbsp;[&#160;<a href="javascript:void(0);" onclick="javascript: window.open('/scielo.php?script=sci_nlinks&ref=1771502&pid=S0034-7744201400070000800007&lng=','','width=640,height=500,resizable=yes,scrollbars=1,menubar=yes,');">Links</a>&#160;]<!-- end-ref --><!-- ref --></span></font><br  style="font-family: verdana;"> <br style="font-family: verdana;"> <font size="2"><span style="font-family: verdana;">Polat, S., &amp; Aka, A. (2007). Total and size fractionated phytoplankton biomass off Karatas, north-eastern Mediterranean coast of Turkey. <span  style="font-style: italic;">Journal Black Sea/Mediterranean Environment, 13</span>, 191-202.    &nbsp;&nbsp;&nbsp;&nbsp;&nbsp;&nbsp;&nbsp;&nbsp;[&#160;<a href="javascript:void(0);" onclick="javascript: window.open('/scielo.php?script=sci_nlinks&ref=1771503&pid=S0034-7744201400070000800008&lng=','','width=640,height=500,resizable=yes,scrollbars=1,menubar=yes,');">Links</a>&#160;]<!-- end-ref --><!-- ref --></span></font><br  style="font-family: verdana;"> <br style="font-family: verdana;"> <font size="2"><span style="font-family: verdana;">Ranston, E. R. (1998).<span style="font-style: italic;"> The phytoplankton community and water quality of a highly eutrophic estuarine bay: Hunts Bay, Kinston Harbour, Jamaica. </span>M. Phil. Thesis, The University of the West Indies, Mona.    &nbsp;&nbsp;&nbsp;&nbsp;&nbsp;&nbsp;&nbsp;&nbsp;[&#160;<a href="javascript:void(0);" onclick="javascript: window.open('/scielo.php?script=sci_nlinks&ref=1771504&pid=S0034-7744201400070000800009&lng=','','width=640,height=500,resizable=yes,scrollbars=1,menubar=yes,');">Links</a>&#160;]<!-- end-ref --><!-- ref --></span></font><br  style="font-family: verdana;"> <br style="font-family: verdana;"> <font size="2"><span style="font-family: verdana;">Ranston E. R., &amp; Webber, D. F. (2003). Phytoplankton distribution in a highly eutrophic estuarine bay, Hunts Bay Kingston Harbour Jamaica. <span style="font-style: italic;">Bulletin of Marine Sciences. 73</span>(2), 307-324.    &nbsp;&nbsp;&nbsp;&nbsp;&nbsp;&nbsp;&nbsp;&nbsp;[&#160;<a href="javascript:void(0);" onclick="javascript: window.open('/scielo.php?script=sci_nlinks&ref=1771505&pid=S0034-7744201400070000800010&lng=','','width=640,height=500,resizable=yes,scrollbars=1,menubar=yes,');">Links</a>&#160;]<!-- end-ref --><!-- ref --></span></font><br style="font-family: verdana;"> <br style="font-family: verdana;"> <font size="2"><span style="font-family: verdana;">Ranston, E. R., Simmonds, R. A., &amp; Webber, D. F. (2003). The phytoplankton distribution in Kingston Harbour, Jamaica. <span style="font-style: italic;">Bulletin of Marine Science, 73</span>(2), 325-342.    &nbsp;&nbsp;&nbsp;&nbsp;&nbsp;&nbsp;&nbsp;&nbsp;[&#160;<a href="javascript:void(0);" onclick="javascript: window.open('/scielo.php?script=sci_nlinks&ref=1771506&pid=S0034-7744201400070000800011&lng=','','width=640,height=500,resizable=yes,scrollbars=1,menubar=yes,');">Links</a>&#160;]<!-- end-ref --><!-- ref --></span></font><br  style="font-family: verdana;"> <br style="font-family: verdana;"> <font size="2"><span style="font-family: verdana;">Satsmadjis, J. (1985). Comparison of indicators of pollution in the Mediterranean. <span  style="font-style: italic;">Marine Pollution Bulletin. 16</span>, 395-100.    &nbsp;&nbsp;&nbsp;&nbsp;&nbsp;&nbsp;&nbsp;&nbsp;[&#160;<a href="javascript:void(0);" onclick="javascript: window.open('/scielo.php?script=sci_nlinks&ref=1771507&pid=S0034-7744201400070000800012&lng=','','width=640,height=500,resizable=yes,scrollbars=1,menubar=yes,');">Links</a>&#160;]<!-- end-ref --><!-- ref --></span></font><br  style="font-family: verdana;"> <br style="font-family: verdana;"> <font size="2"><span style="font-family: verdana;">Seroka, G. (2004). <span style="font-style: italic;">The relationship between dissolved oxygen, nitrate and phosphate concentrations and Chlorophyll-a concentration in Rhode River, a sub-estuary of Chesapeake Bay. </span>Thomas Jefferson High School of science and Technology, VA.    &nbsp;&nbsp;&nbsp;&nbsp;&nbsp;&nbsp;&nbsp;&nbsp;[&#160;<a href="javascript:void(0);" onclick="javascript: window.open('/scielo.php?script=sci_nlinks&ref=1771508&pid=S0034-7744201400070000800013&lng=','','width=640,height=500,resizable=yes,scrollbars=1,menubar=yes,');">Links</a>&#160;]<!-- end-ref --><!-- ref --></span></font><br  style="font-family: verdana;"> <br style="font-family: verdana;"> <font size="2"><span style="font-family: verdana;">Simmonds, R. A. (1997). <span style="font-style: italic;">The phytoplankton community and water quality of a eutrophic embayment: Kingston Harbour, Jamaica.</span> M. Phil. Thesis. The University of the West Indies, Mona.    &nbsp;&nbsp;&nbsp;&nbsp;&nbsp;&nbsp;&nbsp;&nbsp;[&#160;<a href="javascript:void(0);" onclick="javascript: window.open('/scielo.php?script=sci_nlinks&ref=1771509&pid=S0034-7744201400070000800014&lng=','','width=640,height=500,resizable=yes,scrollbars=1,menubar=yes,');">Links</a>&#160;]<!-- end-ref --><!-- ref --></span></font><br style="font-family: verdana;"> <br style="font-family: verdana;"> <font size="2"><span style="font-family: verdana;">Thompson, G. B., &amp; Ho, J. (1981). Some effects of sewage discharge upon phytoplankton in Hong Kong. <span style="font-style: italic;">Marine Pollution Bulletin. 12</span>,168-173.    &nbsp;&nbsp;&nbsp;&nbsp;&nbsp;&nbsp;&nbsp;&nbsp;[&#160;<a href="javascript:void(0);" onclick="javascript: window.open('/scielo.php?script=sci_nlinks&ref=1771510&pid=S0034-7744201400070000800015&lng=','','width=640,height=500,resizable=yes,scrollbars=1,menubar=yes,');">Links</a>&#160;]<!-- end-ref --><!-- ref --></span></font><br  style="font-family: verdana;"> <br style="font-family: verdana;"> <font size="2"><span style="font-family: verdana;">Wade, B. A. (1972). Increasing organic pollution in Kingston Harbour, Jamaica. <span  style="font-style: italic;">Marine Pollution Bulletin, 3</span>(7), 106-110.    &nbsp;&nbsp;&nbsp;&nbsp;&nbsp;&nbsp;&nbsp;&nbsp;[&#160;<a href="javascript:void(0);" onclick="javascript: window.open('/scielo.php?script=sci_nlinks&ref=1771511&pid=S0034-7744201400070000800016&lng=','','width=640,height=500,resizable=yes,scrollbars=1,menubar=yes,');">Links</a>&#160;]<!-- end-ref --><!-- ref --></span></font><br  style="font-family: verdana;"> <br style="font-family: verdana;"> <font size="2"><span style="font-family: verdana;">Webber, D. F., Webber, M. K., &amp; Roff, J. C. (1992). Effects of flood waters on the planktonic community of the Hellshire coast, Southeast Jamaica. <span  style="font-style: italic;">Biotropica, 24</span>,362-374.    &nbsp;&nbsp;&nbsp;&nbsp;&nbsp;&nbsp;&nbsp;&nbsp;[&#160;<a href="javascript:void(0);" onclick="javascript: window.open('/scielo.php?script=sci_nlinks&ref=1771512&pid=S0034-7744201400070000800017&lng=','','width=640,height=500,resizable=yes,scrollbars=1,menubar=yes,');">Links</a>&#160;]<!-- end-ref --><!-- ref --></span></font><br  style="font-family: verdana;"> <br style="font-family: verdana;"> <font size="2"><span style="font-family: verdana;">Webber, D. F., &amp; Roff, J. C. (1996). Influence of Kingston Harbour on the phytoplankton community of the nearshore Hellshire coast, southeast Jamaica. <span  style="font-style: italic;">Bulletin of Marine Sciences. 59</span>(2),245-258.    &nbsp;&nbsp;&nbsp;&nbsp;&nbsp;&nbsp;&nbsp;&nbsp;[&#160;<a href="javascript:void(0);" onclick="javascript: window.open('/scielo.php?script=sci_nlinks&ref=1771513&pid=S0034-7744201400070000800018&lng=','','width=640,height=500,resizable=yes,scrollbars=1,menubar=yes,');">Links</a>&#160;]<!-- end-ref --><!-- ref --></span></font><br  style="font-family: verdana;"> <br style="font-family: verdana;"> <font size="2"><span style="font-family: verdana;">Webber, D. F., &amp; Webber, M. K. (1998). The water quality of Kingston Harbour: Evaluating the use of the planktonic community and traditional water quality indices. <span style="font-style: italic;">Chemistry and Ecology, 14</span>, 357-374.    &nbsp;&nbsp;&nbsp;&nbsp;&nbsp;&nbsp;&nbsp;&nbsp;[&#160;<a href="javascript:void(0);" onclick="javascript: window.open('/scielo.php?script=sci_nlinks&ref=1771514&pid=S0034-7744201400070000800019&lng=','','width=640,height=500,resizable=yes,scrollbars=1,menubar=yes,');">Links</a>&#160;]<!-- end-ref --><!-- ref --></span></font><br style="font-family: verdana;"> <br style="font-family: verdana;"> <font size="2"><span style="font-family: verdana;">Webber, D., &amp; Wilson- Kelly, P. (2003). Characterization of the sources of organic pollution to Kingston Harbour.<span style="font-style: italic;"> Bulletin of Marine Sciences. 73</span>, 257-271.    &nbsp;&nbsp;&nbsp;&nbsp;&nbsp;&nbsp;&nbsp;&nbsp;[&#160;<a href="javascript:void(0);" onclick="javascript: window.open('/scielo.php?script=sci_nlinks&ref=1771515&pid=S0034-7744201400070000800020&lng=','','width=640,height=500,resizable=yes,scrollbars=1,menubar=yes,');">Links</a>&#160;]<!-- end-ref --><!-- ref --></span></font><br  style="font-family: verdana;"> <br style="font-family: verdana;"> <font size="2"><span style="font-family: verdana;">Webber, M. K., Webber, D. F., Ranston, E. ., Dunbar, F. N., &amp; Simmonds, R. A. (2003). Changes in water quality and plankton of Kingston Harbour, Jamaica after 20 years of continued eutrophication. <span style="font-style: italic;">Bulletin of Marine Sciences, 73</span>(2)3 361-378.    &nbsp;&nbsp;&nbsp;&nbsp;&nbsp;&nbsp;&nbsp;&nbsp;[&#160;<a href="javascript:void(0);" onclick="javascript: window.open('/scielo.php?script=sci_nlinks&ref=1771516&pid=S0034-7744201400070000800021&lng=','','width=640,height=500,resizable=yes,scrollbars=1,menubar=yes,');">Links</a>&#160;]<!-- end-ref --></span></font>    <br> <font size="2"><span style="font-family: verdana;"></span></font></div> <font size="2"><span style="font-family: verdana;">    <br> </span></font><font size="2"><span style="font-family: verdana;"><a  name="1"></a><a href="#2">1</a>. Centre for Marine Sciences, Department of Life Sciences, The University of the West Indies, Mona, Kingston 7, Jamaica W.I.; dale.webber@uwimona.edu.jm</span></font><br  style="font-family: verdana;"> <hr style="width: 100%; height: 2px;">     <div style="text-align: center;"><font style="font-weight: bold;"  size="2"><span style="font-family: verdana;">Received 29-IX-2013 Corrected 12-III-2014 Accepted 24-III-2014</span></font></div> <font style="font-weight: bold;" size="2"></font></div>      ]]></body><back>
<ref-list>
<ref id="B1">
<nlm-citation citation-type="">
<person-group person-group-type="author">
<name>
<surname><![CDATA[Dunbar]]></surname>
<given-names><![CDATA[F. N.]]></given-names>
</name>
</person-group>
<source><![CDATA[Zooplankton abundance and community structure in Kingston Harbour, a polluted tropical embayment.]]></source>
<year>1997</year>
</nlm-citation>
</ref>
<ref id="B2">
<nlm-citation citation-type="book">
<person-group person-group-type="author">
<name>
<surname><![CDATA[Eaton]]></surname>
<given-names><![CDATA[A. D.]]></given-names>
</name>
<name>
<surname><![CDATA[Clesceri]]></surname>
<given-names><![CDATA[L. S.]]></given-names>
</name>
<name>
<surname><![CDATA[Greenberg]]></surname>
<given-names><![CDATA[A. E.]]></given-names>
</name>
</person-group>
<source><![CDATA[Standard methods for examination of water and wastewater]]></source>
<year>1995</year>
<edition>19</edition>
<publisher-loc><![CDATA[^eWashington D.C. Washington D.C.]]></publisher-loc>
<publisher-name><![CDATA[American Public Health Association]]></publisher-name>
</nlm-citation>
</ref>
<ref id="B3">
<nlm-citation citation-type="journal">
<person-group person-group-type="author">
<name>
<surname><![CDATA[Hopcroft.]]></surname>
<given-names><![CDATA[R. R.]]></given-names>
</name>
<name>
<surname><![CDATA[Roff]]></surname>
<given-names><![CDATA[J. C.]]></given-names>
</name>
</person-group>
<article-title xml:lang="en"><![CDATA[Phytoplankton size fractions in a tropical neritic ecosystem near Kingston Jamaica]]></article-title>
<source><![CDATA[Journal of Plankton Research]]></source>
<year>1990</year>
<volume>12</volume>
<page-range>1069-1088.</page-range></nlm-citation>
</ref>
<ref id="B4">
<nlm-citation citation-type="journal">
<person-group person-group-type="author">
<name>
<surname><![CDATA[James]]></surname>
<given-names><![CDATA[B. K.]]></given-names>
</name>
<name>
<surname><![CDATA[Adejare]]></surname>
<given-names><![CDATA[L. I.]]></given-names>
</name>
</person-group>
<article-title xml:lang="en"><![CDATA[Nutrients and phytoplankton dynamica of a tropical harbour in relation to water quality indices]]></article-title>
<source><![CDATA[Journal of American Science]]></source>
<year>2010</year>
<volume>6</volume>
<numero>9</numero>
<issue>9</issue>
<page-range>261-275</page-range></nlm-citation>
</ref>
<ref id="B5">
<nlm-citation citation-type="">
<source><![CDATA[Draft Jamaica National Ambient Water Quality Standard - Marine Water.]]></source>
<year>2009</year>
</nlm-citation>
</ref>
<ref id="B6">
<nlm-citation citation-type="">
<person-group person-group-type="author">
<name>
<surname><![CDATA[Owili]]></surname>
<given-names><![CDATA[M. A.]]></given-names>
</name>
</person-group>
<source><![CDATA[Assessment of Impact of sewage effluents on coastal water quality in Hafnarjordur, Iceland.]]></source>
<year>2003</year>
</nlm-citation>
</ref>
<ref id="B7">
<nlm-citation citation-type="book">
<person-group person-group-type="author">
<name>
<surname><![CDATA[Parsons]]></surname>
<given-names><![CDATA[T. R.]]></given-names>
</name>
<name>
<surname><![CDATA[Maita]]></surname>
<given-names><![CDATA[Y.]]></given-names>
</name>
<name>
<surname><![CDATA[Lalli]]></surname>
<given-names><![CDATA[C. M.]]></given-names>
</name>
</person-group>
<source><![CDATA[A manual of chemical and biological methods for seawater analysis]]></source>
<year>1984</year>
<publisher-name><![CDATA[Pergamon Press]]></publisher-name>
</nlm-citation>
</ref>
<ref id="B8">
<nlm-citation citation-type="journal">
<person-group person-group-type="author">
<name>
<surname><![CDATA[Polat]]></surname>
<given-names><![CDATA[S.]]></given-names>
</name>
<name>
<surname><![CDATA[Aka]]></surname>
<given-names><![CDATA[A.]]></given-names>
</name>
</person-group>
<article-title xml:lang="en"><![CDATA[Total and size fractionated phytoplankton biomass off Karatas, north-eastern Mediterranean coast of Turkey]]></article-title>
<source><![CDATA[Journal Black Sea/Mediterranean Environment]]></source>
<year>2007</year>
<volume>13</volume>
<page-range>191-202</page-range></nlm-citation>
</ref>
<ref id="B9">
<nlm-citation citation-type="">
<person-group person-group-type="author">
<name>
<surname><![CDATA[Ranston]]></surname>
<given-names><![CDATA[E. R.]]></given-names>
</name>
</person-group>
<source><![CDATA[The phytoplankton community and water quality of a highly eutrophic estuarine bay: Hunts Bay, Kinston Harbour, Jamaica.]]></source>
<year>1998</year>
</nlm-citation>
</ref>
<ref id="B10">
<nlm-citation citation-type="journal">
<person-group person-group-type="author">
<name>
<surname><![CDATA[Ranston]]></surname>
<given-names><![CDATA[E. R]]></given-names>
</name>
<name>
<surname><![CDATA[Webber]]></surname>
<given-names><![CDATA[D. F]]></given-names>
</name>
</person-group>
<article-title xml:lang="en"><![CDATA[Phytoplankton distribution in a highly eutrophic estuarine bay, Hunts Bay Kingston Harbour Jamaica]]></article-title>
<source><![CDATA[Bulletin of Marine Sciences]]></source>
<year>2003</year>
<volume>73</volume>
<numero>2</numero>
<issue>2</issue>
<page-range>307-324</page-range></nlm-citation>
</ref>
<ref id="B11">
<nlm-citation citation-type="journal">
<person-group person-group-type="author">
<name>
<surname><![CDATA[Ranston]]></surname>
<given-names><![CDATA[E. R.]]></given-names>
</name>
<name>
<surname><![CDATA[Simmonds]]></surname>
<given-names><![CDATA[R. A.]]></given-names>
</name>
<name>
<surname><![CDATA[Webber]]></surname>
<given-names><![CDATA[D. F.]]></given-names>
</name>
</person-group>
<article-title xml:lang="en"><![CDATA[The phytoplankton distribution in Kingston Harbour, Jamaica]]></article-title>
<source><![CDATA[Bulletin of Marine Science]]></source>
<year>2003</year>
<volume>73</volume>
<numero>2</numero>
<issue>2</issue>
<page-range>325-342</page-range></nlm-citation>
</ref>
<ref id="B12">
<nlm-citation citation-type="journal">
<person-group person-group-type="author">
<name>
<surname><![CDATA[Satsmadjis]]></surname>
<given-names><![CDATA[J.]]></given-names>
</name>
</person-group>
<article-title xml:lang="en"><![CDATA[Comparison of indicators of pollution in the Mediterranean]]></article-title>
<source><![CDATA[Marine Pollution Bulletin]]></source>
<year>1985</year>
<volume>16</volume>
<page-range>395-100</page-range></nlm-citation>
</ref>
<ref id="B13">
<nlm-citation citation-type="book">
<person-group person-group-type="author">
<name>
<surname><![CDATA[Seroka]]></surname>
<given-names><![CDATA[G.]]></given-names>
</name>
</person-group>
<source><![CDATA[The relationship between dissolved oxygen, nitrate and phosphate concentrations and Chlorophyll-a concentration in Rhode River, a sub-estuary of Chesapeake Bay.]]></source>
<year>2004</year>
<publisher-name><![CDATA[Thomas Jefferson High School of science and Technology]]></publisher-name>
</nlm-citation>
</ref>
<ref id="B14">
<nlm-citation citation-type="">
<person-group person-group-type="author">
<name>
<surname><![CDATA[Simmonds]]></surname>
<given-names><![CDATA[R. A.]]></given-names>
</name>
</person-group>
<source><![CDATA[The phytoplankton community and water quality of a eutrophic embayment: Kingston Harbour, Jamaica.]]></source>
<year>1997</year>
</nlm-citation>
</ref>
<ref id="B15">
<nlm-citation citation-type="journal">
<person-group person-group-type="author">
<name>
<surname><![CDATA[Thompson]]></surname>
<given-names><![CDATA[G. B.]]></given-names>
</name>
<name>
<surname><![CDATA[Ho]]></surname>
<given-names><![CDATA[J.]]></given-names>
</name>
</person-group>
<article-title xml:lang="en"><![CDATA[Some effects of sewage discharge upon phytoplankton in Hong Kong]]></article-title>
<source><![CDATA[Marine Pollution Bulletin]]></source>
<year>1981</year>
<volume>12</volume>
<page-range>168-173</page-range></nlm-citation>
</ref>
<ref id="B16">
<nlm-citation citation-type="journal">
<person-group person-group-type="author">
<name>
<surname><![CDATA[Wade]]></surname>
<given-names><![CDATA[B. A.]]></given-names>
</name>
</person-group>
<article-title xml:lang="en"><![CDATA[Increasing organic pollution in Kingston Harbour, Jamaica]]></article-title>
<source><![CDATA[Marine Pollution Bulletin]]></source>
<year>1972</year>
<volume>3</volume>
<numero>7</numero>
<issue>7</issue>
<page-range>106-110</page-range></nlm-citation>
</ref>
<ref id="B17">
<nlm-citation citation-type="journal">
<person-group person-group-type="author">
<name>
<surname><![CDATA[Webber]]></surname>
<given-names><![CDATA[D. F.]]></given-names>
</name>
<name>
<surname><![CDATA[Webber]]></surname>
<given-names><![CDATA[M. K.]]></given-names>
</name>
<name>
<surname><![CDATA[Roff]]></surname>
<given-names><![CDATA[J. C.]]></given-names>
</name>
</person-group>
<article-title xml:lang="en"><![CDATA[Effects of flood waters on the planktonic community of the Hellshire coast, Southeast Jamaica]]></article-title>
<source><![CDATA[Biotropica]]></source>
<year>1992</year>
<volume>24</volume>
<page-range>362-374</page-range></nlm-citation>
</ref>
<ref id="B18">
<nlm-citation citation-type="journal">
<person-group person-group-type="author">
<name>
<surname><![CDATA[Webber]]></surname>
<given-names><![CDATA[D. F.]]></given-names>
</name>
<name>
<surname><![CDATA[Roff]]></surname>
<given-names><![CDATA[J. C.]]></given-names>
</name>
</person-group>
<article-title xml:lang="en"><![CDATA[Influence of Kingston Harbour on the phytoplankton community of the nearshore Hellshire coast, southeast Jamaica]]></article-title>
<source><![CDATA[Bulletin of Marine Sciences]]></source>
<year>1996</year>
<volume>59</volume>
<numero>2</numero>
<issue>2</issue>
<page-range>245-258</page-range></nlm-citation>
</ref>
<ref id="B19">
<nlm-citation citation-type="journal">
<person-group person-group-type="author">
<name>
<surname><![CDATA[Webber]]></surname>
<given-names><![CDATA[D. F.]]></given-names>
</name>
<name>
<surname><![CDATA[Webber]]></surname>
<given-names><![CDATA[M. K.]]></given-names>
</name>
</person-group>
<article-title xml:lang="en"><![CDATA[The water quality of Kingston Harbour: Evaluating the use of the planktonic community and traditional water quality indices]]></article-title>
<source><![CDATA[Chemistry and Ecology]]></source>
<year>1998</year>
<volume>14</volume>
<page-range>357-374</page-range></nlm-citation>
</ref>
<ref id="B20">
<nlm-citation citation-type="journal">
<person-group person-group-type="author">
<name>
<surname><![CDATA[Webber]]></surname>
<given-names><![CDATA[D.]]></given-names>
</name>
<name>
<surname><![CDATA[Wilson- Kelly]]></surname>
<given-names><![CDATA[P.]]></given-names>
</name>
</person-group>
<article-title xml:lang="en"><![CDATA[Characterization of the sources of organic pollution to Kingston Harbour]]></article-title>
<source><![CDATA[Bulletin of Marine Sciences]]></source>
<year>2003</year>
<volume>73</volume>
<page-range>257-271</page-range></nlm-citation>
</ref>
<ref id="B21">
<nlm-citation citation-type="journal">
<person-group person-group-type="author">
<name>
<surname><![CDATA[Webber]]></surname>
<given-names><![CDATA[M. K.]]></given-names>
</name>
<name>
<surname><![CDATA[Webber]]></surname>
<given-names><![CDATA[D. F.]]></given-names>
</name>
<name>
<surname><![CDATA[Ranston]]></surname>
<given-names><![CDATA[E. .]]></given-names>
</name>
<name>
<surname><![CDATA[Dunbar]]></surname>
<given-names><![CDATA[F. N.]]></given-names>
</name>
<name>
<surname><![CDATA[Simmonds]]></surname>
<given-names><![CDATA[R. A.]]></given-names>
</name>
</person-group>
<article-title xml:lang="en"><![CDATA[Changes in water quality and plankton of Kingston Harbour, Jamaica after 20 years of continued eutrophication]]></article-title>
<source><![CDATA[Bulletin of Marine Sciences]]></source>
<year>2003</year>
<volume>73</volume>
<numero>2</numero>
<issue>2</issue>
<page-range>3 361-378</page-range></nlm-citation>
</ref>
</ref-list>
</back>
</article>
