]]>
Limnological evaluation of the fisheries potentials and productivity of a small shallow tropical African reservoir
Moshood K. Mustapha
Department of Zoology, University of Ilorin, Ilorin, Nigeria; moonstapha@yahoo.com
Abstract: Morphometrics and physico-chemical parameters of Oyun reservoir, Offa, Nigeria (a small shallow tropical African Reservoir) were used to estimate the potential fish yield of the reservoir according to the morpho-edaphic index (MEI). Physico-chemical characteristics of the water body were sampled monthly from three stations between January 2002 and December 2003 with standard methods. Estimates of the potential fish yield were obtained using the physico-chemical characteristics of the reservoir and the relationship Y = 23.281 MEI 0.447, where Y is the potential fish yield in kg/ha, MEI is the morpho-edaphic index (given in μS/cm and estimated by dividing the mean conductivity by the mean depth). The reservoir mean depth and conductivity values were 2.6m and 113.10μS/cm respectively, while its potential fish yield was estimated at 125.72 kg/ha. This estimate was higher than other small shallower and larger African reservoirs. The reservoir high ionic content, high nutrient and dissolved oxygen levels, good pH, low level of pollution and shallow depth were responsible for the high estimate of the fish yield. In order to realize this high potential fish yield and sustainable exploration of the fisheries, effective management of the reservoir to curb eutrophication should be adopted, while other management practices such as stocking and conservation of desirable and indigenous fish species, implementation of fishing regulations and adoption of best management practices should be implemented. Rev. Biol. Trop. 57 (4): 1093-1106. Epub 2009 December 01.
Key words: potential fish yield, morpho-edaphic index, conductivity, mean depth, reservoir.
Shallow reservoirs are numerous in Tropical Africa, but the study of their limnology and fisheries potentials are scanty despite their high potentials for fish production as compared with large reservoirs. According to Jackson & Marmulla (2001), tropical and sub-tropical reservoirs are known to be more productive than temperate reservoirs and shallow smaller reservoirs are generally more productive than large reservoirs due to their high primary production. Marshall & Maes (1994) estimated that yields from tropical shallow; managed reservoirs averaged 30-150 kg/ha/year; while deep reservoirs averaged 10-50kg/ha/year. The estimated yield from African shallow tropical reservoir was far more than that of Asia (Lu 1986, Suguna 1995), Latin America and the Caribbean (Jackson 1985, Suguna 1997), North America and Europe (Jenkins 1982, Lelek 1989).
]]> Several limnological parameters such as conductivity, total dissolved solids, water quality, phytoplankton and reservoir morphometry have been used in estimating potential fish yields from reservoirs. The most widely accepted method was the morpho-edaphic index (MEI) developed by Ryder (1965). The MEI is calculated by dividing the value of total dissolved solids (mg/L) by the mean depth (m) of the water body. Jenkins (1982) successfully applied this methodology to North American reservoirs, while Reiger et al. (1971), Henderson & Welcome (1974) and Adeniji (1991) applied it to African lakes and reservoirs by substituting with conductivity which compares favourably with TDS, Schlesinger & Reiger (1982) expanded the model to incorporate temperature effects and subsequently enhanced its global applicability. Recently, Janjua et al. 2008 predicted a high fish production from Shahpur dam, Pakistan, using MEI derived from physico-chemical parameters, while Kantoussan et al. (2007) used it as indicator in evaluating fish yield in two tropical lakes of Mali, West Africa.The simplicity of the MEI and its generally good predictive capabilities has resulted in its application worldwide subject to regional modifications. Generally, the MEI demonstrates that as nutrients in the water increase and depth decreases, fish production increases (Jackson & Marmula 2001). Based on this hypothesis, African tropical shallow reservoirs which are known to be highly productive will consequently have high fish yield.
The objective of this paper is to determine the potential fish yield of Oyun reservoir using the morpho-edaphic index (MEI) and the limnological parameters as index of survival, productivity and management of the reservoir and its fisheries.
Materials and methods
Study site: Oyun reservoir is a tropical man-made reservoir located in Offa, Kwara State, Nigeria, longitude 8°30’05’’ N and latitude 8°15’55’’ E. It was created by damming the perennial Oyun River in 1964 but greatly expanded in 1995 with another expansion being proposed. The reservoir was constructed primarily to supply domestic water to the people of Offa and environs. It also supplies water to industries located within the area and provide water for general municipal uses. Subsistence fishing activities are carried out on the reservoir. The reservoir is eutrophic (Mustapha 2008) with diverse species of littoral plant occupying the shoreline length. The morphometric characteristics of the reservoir are listed in Table 1.
Limnological sampling: Physico-chemical characteristics of the water body were sampled monthly from three stations between January 2002 and December 2003. Triplicate surface water samples were collected in 1L plastic bottles and analyzed for dissolved oxygen, chemical oxygen demand, nitrate, phosphate, calcium, magnesium, total hardness, carbon dioxide, total alkalinity, sulphate and silica according to the standard methods for the examination of water and waste water (APHA 1998) and Hach (2003) procedures. Analytes requiring photometric measurement were determined using Hach spectrophotometer model DR/2500 according to Hach (2003) procedures. Temperature, pH, conductivity and total dissolved solids were measured in-situ using Hanna portable combo waterproof pH/ EC/TDS/Temperature Tester model HI 98130. Transparency was evaluated using a standard 20cm diameter Secchi disc having black and white quarters.
Potential fish yield: Estimates of the potential fish yield were obtained using the physico-chemical characteristics of the reservoir and the relationship Y=23.281 MEI 0.447 (Marshall 1984). Where Y is the potential fish yield in kg/ha, MEI is morpho- edaphic index, which is given in μs/cm and in estimated by dividing the mean conductivity by the mean depth (Ryder et al. 1974). Statistical analyses of the results were done using the GLM procedure of statistical analysis system 9.1.3 (SAS Institute 2003). Monthly mean differences in stations, seasons and years were assessed by LSD using two-way ANOVA with test of significance at P<0.05.
Results
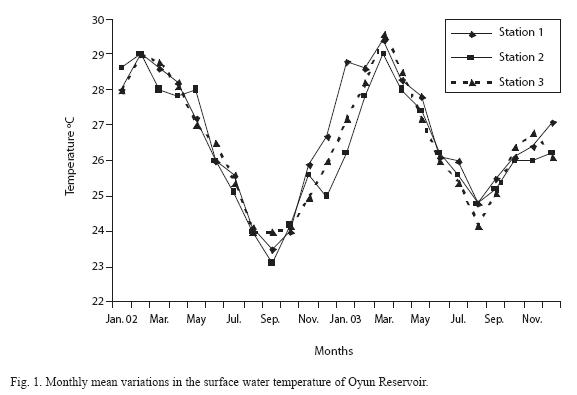
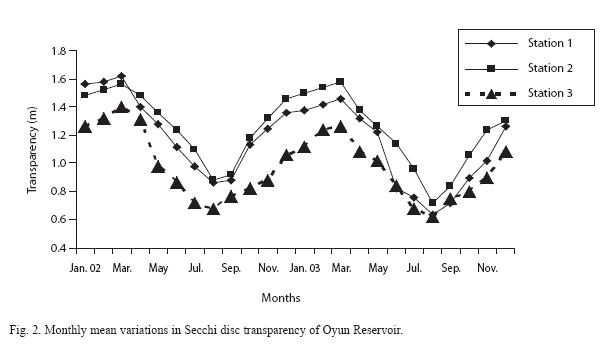
Physico-chemical factors: The mean monthly variations in the surface water temperature of the three stations are presented in Fig. 1. The temperature ranged between the lowest value of 23.1°C±0.5 obtained from Station 2 in September and highest of 29.6°C±0.1 obtained from Station 3 in March, 2003. Dry season temperature was significantly higher (P<0.05) than the wet season. No significant difference was seen among the stations and during the two years survey. Secchi disc transparency was highest at Station 1 with a mean value of 1.62m±0.32 obtained in March 2002. Station 3 recorded the least secchi disc transparency value with a mean of 0.62m ±0.8 obtained in August of 2003 (Fig. 2). The dry season, Station 2 and year 2002 had significant higher transparency (P<0.05).
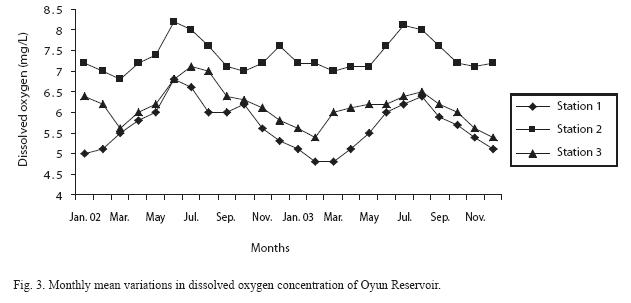
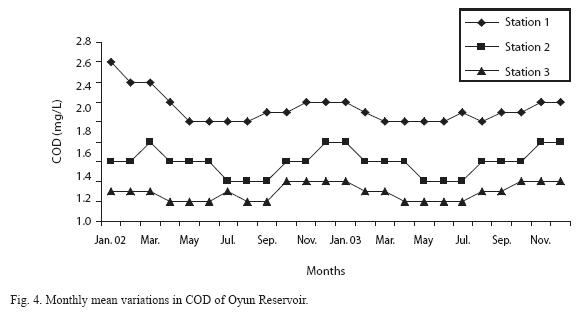
Dissolved oxygen fluctuated between lowest monthly mean of 4.8mg/L±0.25 for February and March 2003 at Station 1, and highest monthly mean value of 8.2mg/L±0.31 recorded in June 2002 at Station 2 (Fig. 3). The dissolved oxygen concentration showed statistical differences (P<0.05) among the stations (with Station 2 having the highest concentration), season (the wet season values were significantly higher than dry season) and years (2002 had a higher concentration than 2003). Chemical Oxygen Demand (COD) varied between 1.2mg/L±0.1 and 2.6mg/L±0.2. COD was significantly higher during the dry season, with Station 1 recording the highest concentration, and Station 3 recording the lowest concentration in the wet season (Fig. 4). There was no statistical difference in COD between the two years of study.
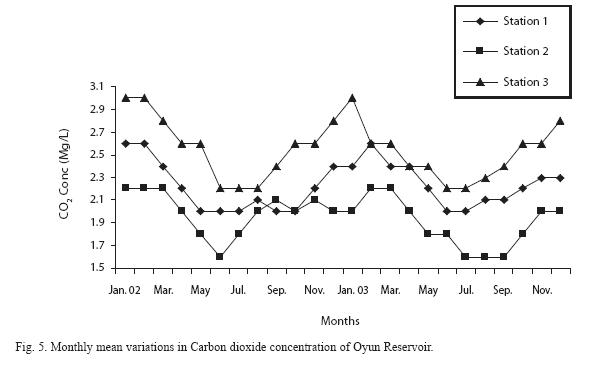
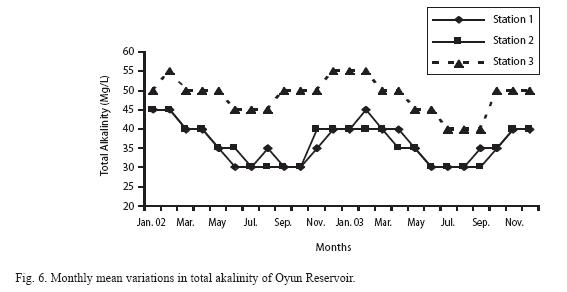
Carbon dioxide and total alkalinity concentrations showed similar patterns hmong the stations and seasons; both factors were statistically higher during the dry season as well as in Station 3. Monthly mean values of carbon dioxide ranged between 1.6mg/L±0.2 to 3.0mg/L±0.6 (Fig. 5), while total alkalinity fluctuated between 30mg/L±2.6 and 55mg/ L±3.4 (Fig. 6).
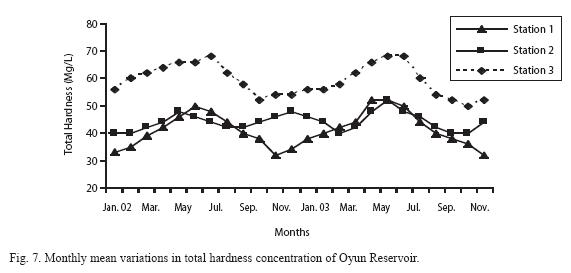
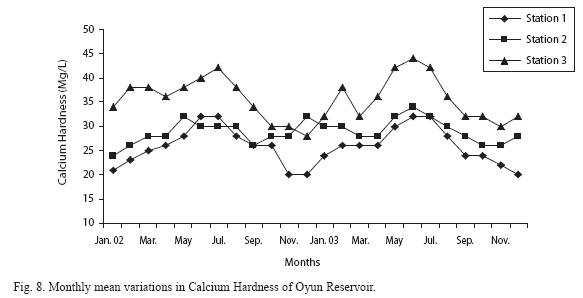
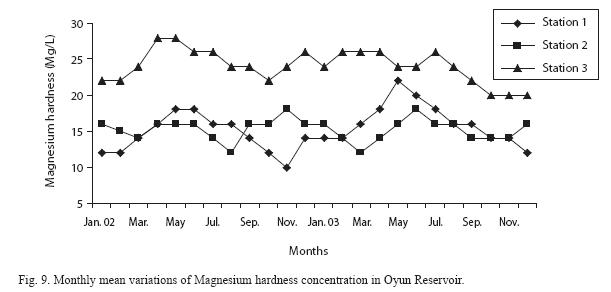
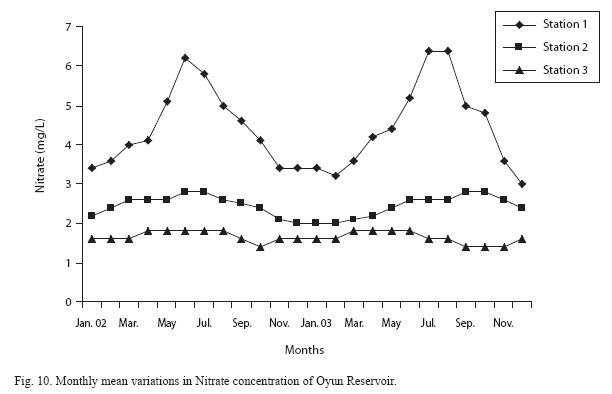
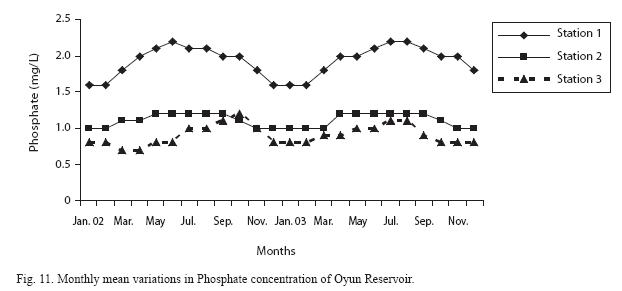
Total hardness value in the reservoir, which is the sum of calcium and magnesium hardness concentrations, was found to be significantly higher in the wet season. This was the same for calcium and magnesium ions. Station 3 showed significantly higher concentration of total calcium and magnesium hardness than the other stations. The mean monthly range of the total hardness (32mg/L±0.5– 68mg/L±1.4), calcium hardness (20mg/L±0.1–44mg/L±1.8) and magnesium hardness (10mg/L±0.4–28mg/L±0.6) are presented in figures 7, 8 and 9 respectively. There was no significant difference in the concentration of these ions among the two years. The highest monthly mean concentration of nitrate recorded was 6.4mg/L±0.3 obtained from Station 1 at the rain peak in August 2003. A decrease was observed in the dry season with the lowest concentration of 1.4mg/L±0.1 recorded from Station 3 in October 2003 (Fig. 10). ANOVA at P<0.05 shows significant difference in nitrate concentration during the seasons and within the stations. Nitrate was higher in the rainy season and the order of magnitude in the concentration among the stations was: Station 1>2>3. Phosphate had the least concentration among the ions. It ranged between 0.7mg/L±0.0 to 2.2mg/L±0.2 (Fig. 11). Like nitrate, phosphate concentration was significantly higher during the rainy season and in Station 1 (P<0.05), but no significant differences occurred between the years of study in their concentrations.
]]>
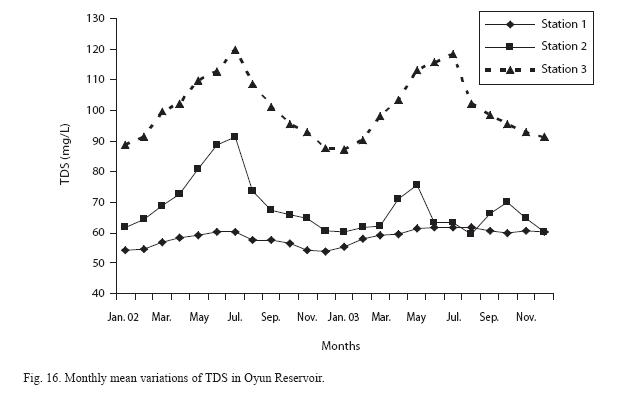
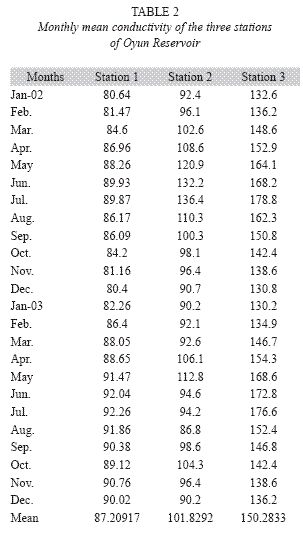
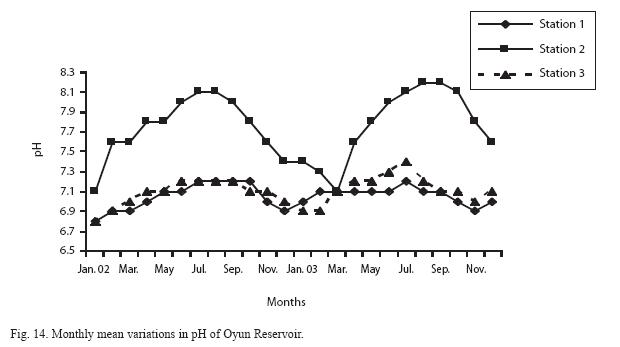
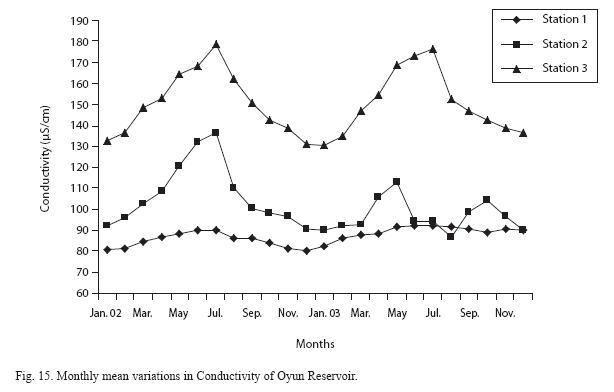
The surface water pH fluctuated between slight acidity and moderate alkalinity. The lowest pH value was 6.8±0.05 for Station 3 during the dry season in January 2002, while the highest was 8.2±0.2 obtained from Station 2 in August and September of 2003 (Fig. 14). In the 3 stations, the pH was in the neutral range for most of the study period. No acidic pH was recorded from Station 2; it was either neutral or alkaline for most part of the study. ANOVA (P<0.05) showed pH to be statistically higher during the wet season than in the dry season and Station 2 pH was significantly higher than the other stations. No difference was noted between the two years. The monthly mean variations in electrical conductivity and total dissolved solids (TDS) followed similar trends. There was slight variation in conductivity and TDS in Station 1. The station recorded the lowest value of conductivity (80.4μs/cm ±0.8) and TDS (53.9mg/L±0.8) in December 2002, and Station 3 recorded the highest variation and concentration of conductivity and TDS with the highest value of conductivity (178.8μs/ cm±2.0) and TDS (119.8mg/L±2.0) obtained in July 2002 (Figs. 15 and 16). Both electrical conductivity and TDS showed significant differences in their concentrations among the seasons and stations. The two factors were statistically higher during the rainy season while the order of significant difference between the stations was Station 3>2>1.
Potential fish yield: The estimated potential fish yield of Oyun Reservoir (Y) from the morpho-edaphic indices (MEI) was 125.72kg/ ha. This was obtained from the relationship.
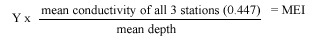
Where Y=23.281 ]]>
23.281 x 113.1072 (0.447)=125.72 kg/ha
2.6
The mean conductivity of the three stations is presented in Table 2.
]]>
Discussion
Reservoir morphometrics: The morphometrics of Oyun Reservoir shows the reservoir to be shallow using Kalff (2003) classification of reservoirs. This reservoir is located in the tropical Guinea savannah zone having two marked seasons of rain (April–October) and dry (November–March) and where there is high rate of evapo- transpiration. The shallowness of the reservoir coupled with its high nutrient status probably explains why its morphoedaphic index (MEI) and potential fish yield were high.
The reservoir shallow nature allowed nutrients to accumulate, circulate and utilized by planktonic organisms and macrophytes resulting in high primary production of the reservoir. High primary production has been noted to be responsible for the high productivity of shallow reservoirs (Jackson & Marmula 2001). The absence of stratification due to shallowness of the reservoir also enabled nutrients to be available all year round for the biotic organisms.
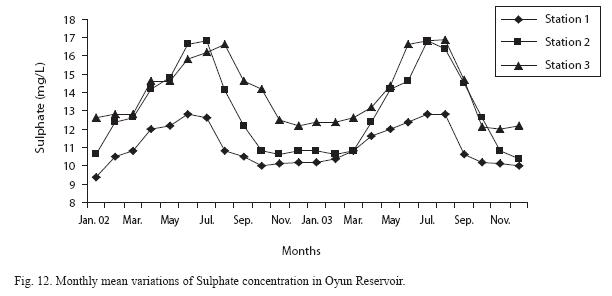
Physico-chemical factors: The nutrient status of the reservoir was high and within the range recommended for freshwater quality by APHA (1998). The reservoir was well oxygenated and the pH was ideal for the growth and survival of fishes. It is also not polluted with the COD levels being low. The relative high nitrate and phosphate concentrations especially in the rainy season could be attributed to the run off of nitro-phosphate fertilizers from nearby farmlands thereby resulting in eutrophication. The higher nitrate, phosphate and sulphate concentration could have aided the production of algae which brought about high productivity of the reservoir. The nutrients concentration seasonal variations observed could be due to chemical denudation due to high dilution from heavy rains and flood coupled with reservoir circulation. This contributed to the high concentration of the nutrients in the rainy season. Utilization of the nutrients by biotic organisms such as algae, macrophytes and other fauna may have brought the reduction seen in the concentration of the ions. Influence of the seasonal could also be attributed to the variations seen in both temperature and transparency of the reservoir. Lower transparency in the wet season could be due to washing of silts, debris and organic matter which comes with rains into the reservoir. This time (rainy season) also corresponds to the time of low temperature. The setting of the debris in the dry season may be the reason for the high transparency at this time.
The ionic content of Oyun reservoir was high as reflected with the conductivity and total dissolved solid (TDS) values recorded. The mean conductivity of the reservoir (113.10us/ cm) was higher than most shallow reservoirs in Nigeria. The high content could be due to weathering of underlying rocks and soil, runoffs from surrounding water and high rainfall which carries most of the dissolved salts into the reservoir.
In all, the physico-chemical properties of the reservoir reflect its good water quality and promoted the high potential fish yield recorded. This agrees with the observations of Ranta & Lindstrom (1998) in Finnish Lakes.
Potential fish yield: The high potential fish yield of 125.75kg/ha could be attributed to the high conductivity value and low mean depth of the reservoir using the morphoedaphic index of Ryder (1965) as modified by Henderson & Welcome (1974). The reservoir is highly productive using the MEI (Fisheries Management Plan 2009). Jackson & Marmula (2001) reported that fisheries potentials of smaller shallower reservoirs that have reasonable high concentration of dissolved solids are usually higher. The estimated fish yield of Oyun Reservoir was higher than other small shallow reservoirs in Africa such as Busunu (2.62kg/ha), Achibunyi (75.05kg/ha) Mahama (90.19kg/ha) (Abban et al. 1994), Botanga (86.98kg/ha), Libga (97.19kg/ha) (Quarcoopome et al. 2008) in Northern Ghana, Bakolori (50kg/ha) (Ita et al. 1982), Kubani (38kg/ha) (Balogun & Aduku 2005), Jebba (40kg/ha) in Nigeria (Adeniji 1991). The estimated potential fish yield from the reservoir could be compared favourably with the estimates of 30–150kg/ha given by Marshall & Maes (1994) for shallow managed reservoirs in tropical Africa.
The high potential fish yield of Oyun reservoir confirmed the reports that shallow reservoirs are highly productive than deep reservoirs. This is so because estimates from large deep tropical African reservoirs such as Kariba 60kg/ha (Machena 1995), Nasser/Nubia 36–39kg/ha (Rashid 1995), Kainji 3.5–4.7kg/ ha (Balogun & Ibeun 1995) and Volta 12kg/ ha (Ryder et al. 1974) were lower than Oyun reservoir and other small shallow reservoirs of tropical Africa.
In order to ensure and meet this high potential fish yield in catch, the reservoir should be managed effectively. The management measures that could be adopted include regular monitoring of the water quality and quantity, fish stock assessment, prevention of eutrophication, sedimentation and other watershed abuses that could lead to water quality deterioration and inadequate fish assemblages, implementation of fishing regulations, stocking and conservation of desirable and indigenous fish species as well as adoption of best management practices (BMP) for the reservoir.
]]> AcknowledgmentsMy utmost gratitude goes to Association of African Universities (AAU) for the award of small grants for theses and dissertations which significantly helped in the completion of this research and publication.
Resumen
La morfometría y parámetros físico-químicos del Embalse Oyun, Offa, Nigeria (un pequeño y somero embalse tropical Africano), fueron utilizados con la finalidad de estimar el rendimiento pesquero potencial, de acuerdo con el índice morfo-edáfico (IME). Las características físico-químicas del cuerpo de agua fueron evaluadas mensualmente en tres estaciones, entre enero 2002 y diciembre 2003, con métodos estandarizados. Las estimaciones del rendimiento pesquero potencial se obtuvieron utilizando las características físico-químicas del Embalse y la relación Y = 23.281 MEI 0.447, donde Y es el rendimiento pesquero potencial en kg/ha, e IME es el índice morfo edáfico (dado en μS/cm y calculado al dividir la conductividad mediav por la profundidad promedio). Los valores medios de profundidad y conductividad del Embalse fueron 2.6m y 113.10μS/cm respectivamente, mientras que el rendimiento pesquero potencial se estimσ en 125.72 kg/ha. Este estimado fue superior al reportado para otros embalses más pequeños y menos profundos, así como para otros más grandes de Africa. Las condiciones de altos contenidos de iones, nutrientes y niveles de oxígeno disuelto, así como el pH adecuado, bajos niveles de contaminación y la poca profundidad, pudieron haber contribuido con esa alta productividad. Con el fin de garantizar un alto potencial de rendimiento y la sostenibilidad de las pesquerías en el Embalse, se recomienda una gestión eficaz, para reducir la eutrofización, así como la implementación de otras prácticas de manejo, tales como la aplicación de regulaciones pesqueras y la adopción de buenas prácticas de gestión, que promuevan el mantenimiento del stock y la conservación de especies autóctonas.
Palabras claves: rendimiento pesquero potencial, índice morfo-edáfico, conductividad, profundidad media, embalse.
Received 20-XII -2008. Corrected 27-IV -2009. Accepted 27-V-2009.
References
Abban, E.K., P.K. Ofori-Danson & F.K.Y. Amenvenku. 1994. Fish and fisheries of a reservoir as index of fishery and aquaculture potential of reservoirs. In: E.K. Abban, P.K. Offori-Danson and C.A. Biney (eds.). Fisheries and aquaculture development assessment of impoundments in West Gonja District, Northern Ghana. Institute of Aquatic and Biology, Technical Report No. 136. [ Links ]
Adeniji, H.A. 1991. Limnology and biological production in the pelagic zone of Jebba Lake, Nigeria. PhD Thesis. University of Ibadan, Ibadan, Nigeria. [ Links ]
APHA (American Public Health Association) 1998. Standard methods for the examination of water and waste water. 20th edition. American Public Health Association Inc. New York, USA. [ Links ]
Balogun, J.K. & U.J. Aduku. 2005. Predicting the fisheries potentials of inland reservoirs and lakes: a case study of Kubani reservoir, p. 893-896. In P.A Araoye (ed.). Proceedings of the 19th conference of the Fisheries Society of Nigeria, November 29th to December 3rd 2004, Ilorin, Nigeria. [ Links ]
Balogun, J.K. & M.O. Ibeun. 1995. Additional information on fish stocks and fisheries of Lake Kainji (Nigeria), p. 1-18. In R.C.M. Crul & F.C. Roest (eds.). Current status of fisheries and fish stocks of four largest African reservoirs. CIFA Tech. Pap. No. 30. FAO, Rome, Italy. [ Links ]
Hach. 2003. Water analysis handbook. Hach Chemical Company. Loveland, Colorado, USA. [ Links ]
Henderson, H.F. & R.L. Welcomme. 1974. The relationship of morpho-edaphic index and numbers of fishermen in African inland fisheries. CIFA Occasional Paper, Paper 1. FAO, Rome, Italy. [ Links ]
Jackson, D.C. 1985. Final Report on inland fisheries and fisheries administration in the Dominican Republic. SEA-BID Contract No. 585/SF-DR-ATP. Inter-American Development Bank, Washington DC, USA. [ Links ]
Jackson, D.C. & G. Marmulla. 2001. The influence of dams on river fisheries, p. 1- 44. In G. Marmula (ed.). Dams, fish and fisheries, opportunities, challenges and conflict resolution. FAO Fish Tech. Pap No. 419, FAO Rome, Italy. [ Links ]
Janjua, M.Y., T. Ahmad & D. Gerdeau. 2008. Comparison of different predictive models for estimating fish yields in Shahpur Dam, Pakistan. Lake Reserv. Manage. 13: 319-324 [ Links ]
Jenkins, R.M. 1982. The morpho edaphic index and reservoir fish production. Transactions of the American Fisheries Society 111: 133-140. [ Links ]
Kalff, J. 2003. Limnology: inland water ecosystems. Prentice Hall Upper Saddle River, New Jersey, USA. [ Links ]
Kantoussan, J., E.C. Ecoutin, M. Simmer, G. Fontelle, O.T. Thiaw & R. Lae. 2007. The relevance of speciesbased indicator as a tool for evaluating the structure of exploited fish assemblages: a comparison study of two tropical lakes in Mali, West Africa. Lake Reserv. Manage. 12: 135-145. [ Links ]
Lelek, A. 1989. The Rhine River and some of its tributaries under human impact in the last two centuries, p. 469-487. In D.P. Dodge (ed.). Proceedings of the International Large River Symposium Canadian Special Publication of Fisheries and Aquatic Sciences. Ottawa, Canada. [ Links ]
Lu, X. 1986. A review of reservoir fisheries in China. FAO Fisheries Circular No. 803. Rome, Italy. [ Links ]
Machena, C. 1995. Recent Development in the Fisheries of Lake Kariba (Zambia/Zimbabwe), p. 41-79. In R.C.M. Crul & F.C. Roest (eds.). Current Status of Fisheries and fish stocks of the four largest African Reservoirs. Kainji, Kariba, Nasser/Nubia and Volta. CIFA Technical Paper No. 30. FAO, Rome, Italy. [ Links ]
Marshal, B.E. 1984. Predicting ecology and fish yields in African reservoir from preimpoundment physicochemical data. CIFA Technical Paper No 12. FAO Rome, Italy. [ Links ]
Marshall, B. & M. Maes. 1994. Small water bodies and their fisheries in Southern Africa. CIFA Technical Paper No 29. FAO Rome, Italy. [ Links ]
Mustapha, M.K. 2008. Limnology and fish assemblages of Oyun reservoir, Offa, Nigeria. PhD Thesis. University of Ilorin, Ilorin, Nigeria. [ Links ]
Quarcoopome, T., F.Y.K Amevenku & O.D. Ansa-Asare. 2008. Fisheries and limnology of tworReservoirs in Northern Ghana. W. Afr. J. Appl. Ecol. 12: 75-92. [ Links ]
Ranta, E. & K. Lindstrom. 1998. Fish yield versus variations in water quality in the lakes of Kuusamo, Northern Finland. Ann. Zool. Fenn. 35: 95-106. [ Links ]
Rashid, M.M. 1995. Some Additional information on limnology and fisheries of lakes Nasser (Egypt) and Nubia (Sudan), p. 81-109. In R.C.M. Crul & F.C. Roest (eds.). Current status of fisheries and fish stocks of the four largest African reservoirs. Kainji, Kariba, Nasser/Nubia and Volta. CIFA Technical Paper No. 30. FAO, Rome, Italy. [ Links ]
Reiger, H.A., A.J. Cordone & R.A. Ryder. 1971. Total fish landings from freshwaters as function of limnological variables of East-Central Africa. Fish stock in African inland waters. Working Paper No. 3. FAO Rome, Italy. [ Links ]
Ryder, R.A. 1965. A method for estimating the potential fish production of North temperate lakes. Trans. Am. Fish. Soc. 94: 214-218. [ Links ]
Ryder, R.A., S.R. Kerr, K.H Loftus & H.A. Reiger. 1974. The morphoedaphic index, a fish yield estimator– review and evaluation. J. Fish. Res. Board Can. 31: 663-688. [ Links ]
SAS Institute. 2003. SAS/Stat user’s guide. Version 9.1.3. SAS Institute Inc. Carry, North Carolina, USA. [ Links ]
Schlesinger, D.A. & H.A. Reiger. 1982. Climatic and morphoedaphic indices of fish yields from natural lakes. Trans. Am. Fish. Soc. 111: 141-150. [ Links ]
Sugunan, V.V. 1995. Reservoir fisheries of India. FAO Fish Tech. Pap. No. 345. Rome, Italy. [ Links ]
Sugunan, V.V. 1997. Fisheries management of small water bodies in seven countries in Africa, Asia and Latin America. FAO Fisheries Circular No. 933. Rome, Italy. [ Links ]
Internet references
]]>Fisheries Management Plan. 2009. Fisheries Management Plan for Fisheries Management Zone 17. 2010-2020. Ministry of Natural Resources. Peterborough, Aurora and Bancrofts Districts, Ontario, Canada.(Downloaded: April 10, 2009, www.mnr.gov.on.ca/264324.pdf). [ Links ] ]]>
 ]]>
]]>
 ]]>
]]>
 ]]>
]]>