50 %, % IRIi was higher than % RIi with an opposite trend (up to 130 times) for values of % A < 50 %. % IRIi overestimated the relative importance of prey for high values of % A, while it underestimated the relative importance of prey for low values of % A, showing a nonlinear relationship to % A. The variables used in the Cortés graphic method are insufficient to evaluate predator feeding strategy (generalization versus specialization). Therefore, we suggest including other variables, such as population and individual trophic niche breadth and a suitable field sampling record. An extended sampling record is necessary to classify prey as rare or dominant according to Cortés classification. The indexes of relative importance and graphic method are complementary. Compound indexes that comprise mass, number, and occurrence provide a more accurate description of diet and allow comparative studies. The graphic analysis is easy to interpret and helps in the evaluation of prey importance and predator feeding strategy. Rev. Biol. Trop. 54 (4): 1227-1239. Epub 2006 Dec. 15]]>
50 %, el % IRIi resultó mayor al obtenido para el % RIi, con una tendencia opuesta (hasta 130 veces) para valores de % A por debajo del 50 %. El % IRIi sobreestimó la importancia relativa de las presas para valores altos de % A, mientras que subestimó la importancia relativa de las presas para valores bajos de % A y mostró un comportamiento no lineal a medida que varió el % A. Las variables empleadas en el método gráfico de Cortés son insuficientes para evaluar la estrategia alimentaria del depredador (generalismo-especialismo). De este modo, se sugiere incluir otras variables como el ancho de nicho trófico poblacional e individual así como un adecuado registro de campo. Es necesario un amplio registro de campo para clasificar a las presas como escasa o dominante de acuerdo a la clasificación de Cortés. Los índices compuestos que incluyen las variables: masa, número y aparición proporcionan una descripción más precisa de la dieta y permiten realizar estudios comparativos. El análisis gráfico es fácil de interpretar y ayuda a evaluar aspectos como la importancia de la presa y la estrategia alimentaria del depredador]]>
Alimentación del pez insectívoro neotropicalCreagrutus bolivari(Pisces: Characidae) según los métodos gráfico y de importancia relativa
Mario Ortaz1, Pablo Borjas von Bach1 & Rubén Candia2
1 Instituto de Biología Experimental, Univ. Central de Venezuela. maortaz@hotmail.com
2 Instituto de Zoología Tropical, Univ. Central de Venezuela.
Abstract: The diet of the neotropical insectivorous fish Creagrutus bolivari(Pisces: Characidae) according to the “graphic” and “relative importance” methods. The diet of a neotropical fish species (Creagrutus bolivari) was studied using different methods: the Cortés 1997 graphic method and two relative importance indexes, one designed by George and Hadley in 1979 (% RIi) and another proposed by Cortés in 1997 (% IRIi). Only discrete prey (aquatic and terrestrial invertebrates) were used in the diet analysis. The occurrence (% A), number (% N) and weight (% G) frequencies were estimated for each food item. A total of 240 specimens (size range from 25.3 to 64.7 mm standard length) were analyzed. For values of % A > 50 %, % IRIi was higher than % RIi with an opposite trend (up to 130 times) for values of % A < 50 %. % IRIi overestimated the relative importance of prey for high values of % A, while it underestimated the relative importance of prey for low values of % A, showing a nonlinear relationship to % A. The variables used in the Cortés graphic method are insufficient to evaluate predator feeding strategy (generalization versus specialization). Therefore, we suggest including other variables, such as population and individual trophic niche breadth and a suitable field sampling record. An extended sampling record is necessary to classify prey as rare or dominant according to Cortés’ classification. The indexes of relative importance and graphic method are complementary. Compound indexes that comprise mass, number, and occurrence provide a more accurate description of diet and allow comparative studies. The graphic analysis is easy to interpret and helps in the evaluation of prey importance and predator feeding strategy. Rev. Biol. Trop. 54 (4): 1227-1239. Epub 2006 Dec. 15.
Key words: diet analysis, index of relative importance, Neotropical fish, Characidae, Creagrutus.
El análisis de dieta a través de la evaluación del contenido estomacal ha sido una práctica frecuente en estudios de tramas tróficas y algunos investigadores consideran que el análisis del contenido estomacal es la manera adecuada de evaluar aspectos de la ecología alimentaria de las especies en condiciones naturales, lo cual es fundamental para el desarrollo de estrategias para el manejo sostenido de los ecosistemas acuáticos (Amundsen et al. 1996, Segatti y Luciana 2003). En estudios de ecología alimentaria de peces, se estiman frecuentemente dos variables: la frecuencia de aparición y la abundancia relativa de las presas. La frecuencia de aparición consiste en registrar el número de estómagos que contienen un tipo de presa, referido al número total de estómagos con alimento (Hyslop 1980). La abundancia relativa de la presa (volumen, masa o número), se estima como su contribución particular con relación a todos los tipos de presas consumidas de modo que se expresa como una proporción usualmente en porcentaje (Hynes 1950, Frost 1954, Bagenal 1978, Hyslop 1980, Amundsen et al. 1996).
La frecuencia de aparición es la manera más ]]>
proporciona información acerca del espectro alimentario de una población, sin embargo, no proporciona indicios de la importancia relativa de cada tipo de presa en la dieta de un consumidor (Hyslop 1980, Cortés 1997). La frecuencia numérica proporciona un estimado cuantitativo de un tipo de presa y muestra ]]>
indicios de la intensidad de alimentación, sin embargo, sobreestima la importancia relativa de las presas pequeñas en aquellos consumidores que depredan un amplio intervalo de tamaños de presas. Adicionalmente, con esta variable no se puede estimar la importancia relativa de aquellas presas que no aparecen como unidades ]]>
como es el caso del material vegetal y del detritus. La frecuencia gravimétrica proporciona un estimado del valor nutricional de las presas y si se relaciona, a distintas escalas temporales, el peso del alimento consumido con el peso del pez, se pueden conocer los lapsos de actividad alimentaria (Knight ]]>
et al. 1992). Sin embargo, el peso puede sobreestimar la importancia relativa de aquellas presas con una gran proporción de estructuras no digeribles (George y Hadley 1979, Hyslop 1980).
Una descripción ]]>
de un tipo de alimento en la dieta de una especie debe incluir una medida de su peso, cantidad y aparición. Debido a que cada una de estas variables proporciona diferentes aproximaciones de la estrategia alimentaria de un depredador, se han desarrollado una serie de ]]>
(Segatti y Luciana 2003). Uno de ellos es el Índice de Importancia Relativa (IRI) de Pinkas et al. (1971). En este índice, la frecuencia de aparición (% A) de cada tipo de presa se multiplica por la suma de las frecuencias gravimétrica (% G) y numérica (% N). Debido a que este
índice no se expresa en términos porcentuales, se hace difícil la comparación de los valores de IRI estimados para distintos tipos de presa. Para evitar esto, Cortés (1997) lo expresó en término porcentual (% IRIi), de modo que cada valor representa una frecuencia relativa. ]]>
George y Hadley (1979) emplearon otro Índice de Importancia Relativa (RI) el cual está basado en un Índice de Importancia Absoluta (AI). En este caso AI se obtiene de la suma de las frecuencias numérica, de aparición y gravimétrica de cada tipo de presa ]]>
frecuencia relativa porcentual.
De lo anterior se observa que la diferencia entre % IRIi y % RIi radica en la manera de estimar IRIi y Aii, respectivamente. En el primer caso, IRIi se obtiene al multiplicar el % A por la
suma del % G y % N. En el segundo caso, Aii se obtiene al sumar % A, % G y % N.
La representación gráfica de los datos de dieta se ha usado como un método alternativo en estudios de ecología trófica debido a que resulta fácil de interpretar (Costello 1990,
Cortés 1997). Cortés (1997), propuso una modificación del método de Costello (1990), que incluye los datos de % A, % G y % N en la misma representación gráfica. Cada punto en la gráfica representa la aparición y abundancia (en masa y número) de cada tipo de presa. Cada punto localizado cerca del 100 % A, 100 % N y ]]>
Por el contrario, cada punto localizado cerca del origen de los tres ejes representa a una presa rara. Las líneas diagonales entre los ejes de la gráfica indicarían la importancia de la presa en la dieta del consumidor (dominante vs rara) y la estrategia alimentaria del consumidor (generalista vs ]]>
puntos localizada cerca del 100 % A indicaría una dieta generalizada y una con bajos valores de % A una dieta especializada. Sin embargo, dependiendo de la frecuencia de depredación sobre una escala temporal (diaria o anual), y del ancho de nicho trófico del consumidor, este panorama puede ser diferente al planteado ]]>
Cortés (1997). Al respecto, ¿una presa con un bajo valor de % A, % N y % G pero que aparece a lo largo de todo el año en la dieta de un consumidor debe considerarse rara? Lo anterior significa que no necesariamente un alto valor de % A es la única condición de una dieta generalizada ya ]]>
como elancho de nicho trófico. Un ejemplo extremo es el koala, el cual se alimenta sólo de hojas de ciertas especies de Eucalyptus, de modo que su ancho de nicho trófico es estrecho y, sin embargo, el % A del tipo de alimento que consume (hojas de
Eucalyptus) es alto.
El objetivo del presente trabajo consistió en comparar los índices de importancia relativa de George y Hadley (1979) y Cortés (1997), con los datos de dieta de C. bolivari y ]]>
resoluciones taxonómicas (orden y familia). Adicionalmente, se empleó el método gráfico de Cortés (1997) y se discutió su aplicabilidad como estimador de la importancia de las presas y de la estrategia alimentaria de esta especie.
]]>
Materiales y métodos
Se analizó la dieta de una especie de carácido del género Creagrutus (Creagrutus bolivari), el cual incluye a una variedad de especies de peces de tamaño adulto pequeño que se distribuyen desde Panamá hasta Paraguay y son especies típicas de ríos de piedemonte, las cuales son omnívoras con tendencia a la insectivoría (Géry 1977, Lowe-McConnell 1987, Taphorn 1992, Anthony et al. 1994, Harold y Vari 1994, Ortaz 2001). Los ejemplares analizados se colectaron en el canal principal de un río de montaña boscosa ubicado en la región centro norte de Venezuela (10º14’25’’ - 10º32’40’’ N; ]]>
67º52’54’’ W), sujeta a la influencia de los vientos alisios del noreste y de la convergencia intertropical (Huber 1986, PDVSA 1993). Los especímenes se colectaron con una frecuencia mensual entre junio de 1992 y marzo de 1993 para un total de ocho colectas que incluyeron meses secos y lluviosos. Las muestras se mantuvieron
adecuadamente preservadas hasta su procesamiento por Borjas (2001). Se escogió a esta especie para el análisis por tener una dieta amplia, además de disponer de un número significativo de individuos analizados (n = 240 individuos con tallas que variaron entre 25.3 y 64.7 mm de longitud estándar) que provinieron
de un amplio registro de campo. Se examinó el contenido estomacal bajo lupa. Este análisis se realizó sólo para las presas discretas las cuales constituyeron la fracción mayoritaria de la dieta de esta especie (Ortaz 1992, Borjas 2001).
Las presas consumidas (insectos ]]>
e invertebrados terrestres) se identificaron a dos niveles de resolución taxonómica (orden y familia) (Usinger 1956, Merrit y Cummins 1984, Roldán 1996). El peso (peso húmedo) de cada tipo de presa se estimó con una balanza de 0.1 μg de precisión. Los resultados del análisis de dieta ]]>
(% N), gravimétrica (% G) y de aparición (% A) para cada tipo de presa. El % N se estimó como la proporción porcentual entre el número de individuos de un tipo de presa y el número total de individuos de todos los tipos de presa. El % G se estimó como la proporción porcentual
entre el peso de un tipo de presa y el peso de todas las presas. El % A se estimó como la proporción porcentual entre el número de estómagos en los que apareció un tipo de presa y el número total de estómagos con alimento.
Con los estimados de % A, % N y % G
para cada tipo de presa consumida, se calcularon los índices relativos %RIi y % IRIi propuestos por George y Hadley (1979) y Cortés (1997), respectivamente. Adicionalmente, se representaron en una misma gráfica los valores de % A, % N y % G para cada tipo de presa consumida, lo cual se realizó para las presas identificadas a ]]>
Resultados
Índices de Importancia Relativa: Los resultados globales mostraron que
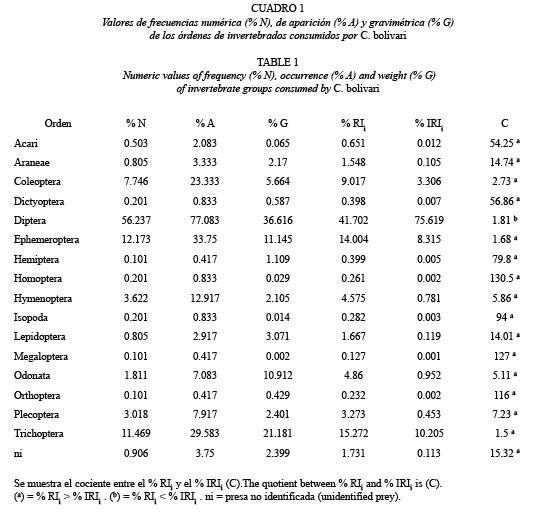
C. bolivari posee una dieta amplia con base a la variedad de presas consumidas. Se identificaron doce órdenes de insectos, dos órdenes de arácnidos y el orden Isopoda (Cuadro 1). En cuanto a las familias consumidas, sólo se identificaron las
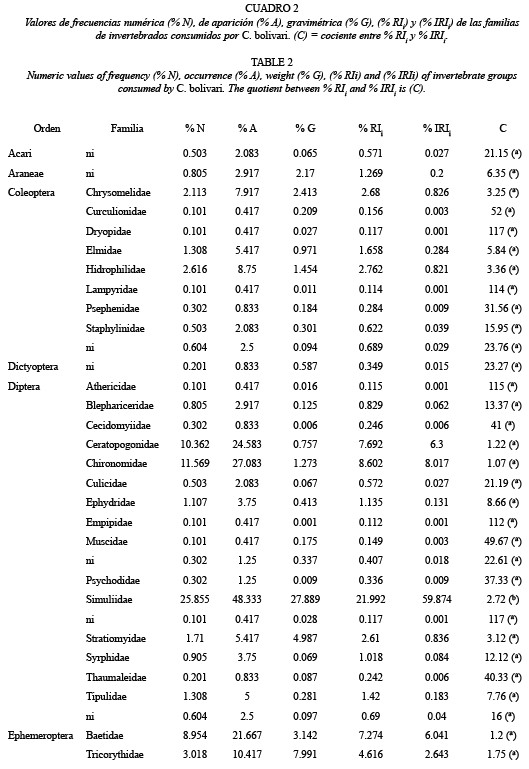
pertenecientes a los insectos, que incluyó un total de 41 familias de las cuales 15 pertenecieron al orden Diptera (Cuadro 2).
Los valores de importancia relativa de los datos agrupados de las ocho colectas y de los órdenes con las mayores frecuencias
mostraron la siguiente tendencia: Diptera > Trichoptera > Ephemeroptera > Coleoptera > Odonata > Hymenoptera > Plecoptera, la cual fue similar independientemente del índice empleado. Sin embargo, los valores resultaron diferentes entre índices.
]]>
En los Diptera, que fue el orden con las mayores frecuencias de % A, % N y % G, el valor de % IRIi fue 1.81 veces mayor que el %RIi. Por el contrario, en el resto de los órdenes, el resultado fue opuesto, y los valores de % IRIi fueron entre 1.5 y 7.23 veces menores que los correspondientes al %RIi (Cuadro 1).
En los casos en que el % A fue mayor de 20 % (Coleoptera, Diptera, Ephemeroptera y Trichoptera), el valor absoluto estimado para el cálculo del % IRIi de éstas presas fue un orden de magnitud mayor que el estimado para el cálculo del %RIi y a medida que el % A se acercó al 20 %, como fue el caso de Coleoptera, la diferencia entre ambos índices incrementó.
En las presas en las que el % A fue menor del 20 % (Hymenoptera, Odonata y Plecoptera), si bien las diferencias entre los valores absolutos para el cálculo de los índices relativos no fueron de un orden de magnitud, las diferencias entre ambos estimadores resultaron mayores que en el caso anterior (entre 5 y 7 veces).
Se observó otro grupo de valores, correspondientes a órdenes consumidos en bajas frecuencias (< 10 %), en los cuales los valores de % IRIi fueron entre 14 y 131 veces menores que los obtenidos para el %RIi. En este grupo, a excepción de Acari, se obtuvo un incremento en la diferencia entre ambos índices relativos a medida que disminuyó el % A. A su vez, dentro de este grupo, se observaron valores como los obtenidos para Araneae, Lepidoptera y ni, en los cuales las pequeñas variaciones en el % A, % N y % G no generaron grandes diferencias en el cociente %RIi / % IRIi. Por el contrario, en otros órdenes consumidos en los cuales no varió el % A, como fue el caso de Dictyoptera-Homoptera- Isopoda (% A = 0.83) y Hemiptera-Orthoptera- Megaloptera (% A = 0.42), el cociente %RIi / % IRIi fluctuó considerablemente debido a la variación en el % G.
Para una mayor resolución taxonómica, las diferencias entre ambos índices incrementaron a medida que los valores de % A, % N y % G disminuyeron (Cuadro 2). En este caso, la diferencia entre ambos fue mayor (entre 1.07 y 117 veces), que la obtenida para el análisis a nivel de orden. Sólo en dos presas (Simuliidae y Leptoceridae), el valor del % IRIi fue mayor que el correspondiente al %RIi. En el caso de Simuliidae, esto se debió a los altos valores de las frecuencias estimadas tal como ocurrió para los Diptera en el análisis a nivel de orden. En el caso de Leptoceridae, se debió al efecto del relativo alto valor del % G para esta presa lo cual se deduce al observar lo obtenido en Baetidae en la cual los valores de % A y % N fueron parecidos y sólo varió en mayor magnitud el % G. Como ocurrió en el análisis a nivel de orden, en casi la totalidad de las presas, a excepción de Simuliidae y Leptoceridae, los valores del % IRIi fueron menores que los correspondientes al %RIi.
Se observaron varios sub-grupos en los cuales, los valores del % A y % N fueron similares entro ellos y sólo varió el % G, lo cual produjo dentro de cada sub-grupo, una mayor variación en los estimados del % IRIi, con unas diferencias de hasta 95 %, en comparación a los estimados del %RIi. Estos sub-grupos fueron los siguientes: Syrphidae -Invertebrado (ni); Araneae-Blephariceridae; Corduliidae- Diptera (ni) - Coleoptera (ni); Lepidoptera (ni)-Staphilinidae-Culicidae-Acari (ni); Coenagrionidae-Diptera (ni)-Psychodidae; Pyralidae-Dictyoctera (ni)-Libellulidae- Isopoda (ni)-Thaumalidae-Aphidae; Glossomatidae-Odonata (ni)-Corixidae- Or thoptera-Curcul ionidae-Gomphidae- Muscidae-Plecoptera (ni)-Arctiidae - Dryopidae - Diptera (ni)-Athericidae y Lampyridae- Corydalidae-Empididae.
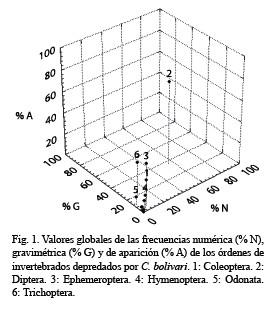
Análisis gráfico de la dieta de C. bolivari: En la representación tridimensional propuesta por Cortés (1997) y aplicada a los órdenes de invertebrados consumidos por C. bolivari se apreciaron tres conjuntos de puntos. El primero estuvo representado por los Diptera que constituyó el ítem más frecuente. El segundo estuvo constituido por presas en las cuales al menos una de las frecuencias estimadas fue mayor del 10 %. Esto incluyó a Trichoptera, Ephemeroptera, Coleoptera, Hymenoptera y Odonata. El tercer grupo estuvo constituido por el resto de los órdenes depredados cuyas frecuencias de consumo resultaron bajas (< 10 %) (Fig. 1).
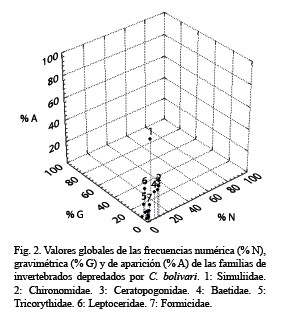
La representación a nivel de familia mostró igualmente la existencia de tres grupos de valores. El primer estuvo constituido por Simuliidae con unas frecuencias por encima de 25 %. El segundo lo conformaron Baetidae, Chironomidae, Ceratopogonidae, Formicidae, Leptoceridae y Tricorythidae. En este grupo al menos una frecuencia fue mayor del 10 %. El tercer grupo, que fue el más numeroso, estuvo constituido por el resto de las familias depredadas cuyas frecuencias fueron muy bajas (Fig. 2). Como en el caso anterior, en un extremo, una presa (Simuliidae) resultó ser la más depredada y a lo largo de los ocho muestreos evaluados y en el otro extremo aparecieron con recurrencia una serie de presas en la dieta de este carácido pero en baja frecuencia. Dentro de estos extremos se detectó un grupo de presas con una condición intermedia pero igualmente recurrentes.
]]>
Discusión
Al evaluar la dieta de una especie analizando de manera aislada las frecuencias numérica, gravimétrica y de aparición se pueden producir errores de interpretación, debido a que cada una de estas variables proporciona indicios distintos (Cortés 1998). Un ejemplo de esto se observó en los datos obtenidos en el presente trabajo ya que si se hubiese evaluado sólo las frecuencia numérica y de aparición de presas como Trichoptera, Ephemeroptera, Odonata e Hymenoptera, se concluiría que la importancia relativa de los Trichoptera y Ephemeroptera sería igual por tener valores de % A y % N parecidos. Sin embargo, la contribución en peso de los Trichoptera casi duplicó la correspondiente a los Ephemeroptera. Otro caso fue Odonata e Hymenoptera, la primera con la mitad del % N estimado para Hymenoptera y sin embargo su % G fue cinco veces mayor.
Lo anterior indica que no resulta obvio suponer que una alta frecuencia numérica implicaría por tanto una alta frecuencia gravimétrica por el simple efecto aditivo, lo cual resalta la importancia del peso individual de cada presa. Sólo en el caso de Diptera, hubo coincidencia en la tendencia de las tres variables evaluadas.
Los resultados mostraron la importancia de cuantificar el espectro alimentario (% A), la intensidad de depredación (% N) y el valor nutricional (% G) de las presas consumidas, las cuales se pueden agrupar en índices como los de importancia relativa. Sin embargo, algunos consideran que estos índices son redundantes ya que adicionan poca información nueva con relación a los componentes que lo conforman (MacDonald y Green 1983, Hansson 1998). Adicionalmente, su aplicación estaría restringida a especies que consumen presas discretas o a aquellas en las que estas son las más importantes.
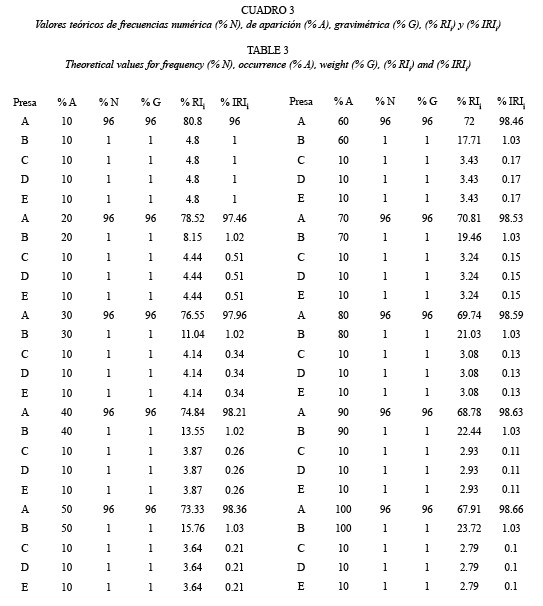
Los resultados mostraron que el % IRIi, fue mayor que el % RIi para valores de % A > 50 %. Este fue el caso de Diptera cuyo % IRIi fue 1.8 veces mayor que el % RIi. Por el contrario, en aquellas presas con valores de % A < 50 %, es decir la mayoría de los órdenes depredados por C. bolivari, el % IRIi, resultó menor que el % RIi y la diferencia entre ambos incrementó (hasta 130 veces), a medida que disminuyó el % A. Sin embargo, para valores bajos y parecidos de % A, la variación en las otras frecuencias generaron grandes diferencias.
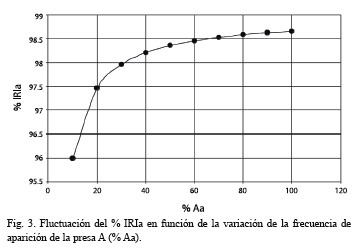
El % IRIi no sólo sobreestimó y subestimó la importancia relativa de las presas con altos y bajos valores de % A, respectivamente, sino que mostró un comportamiento no lineal a medida que varió la fracción multiplicadora (% A). Esto se pudo observar en un caso hipotético en el que se estimó el % IRIi para dos tipos de presas: presa A = más importante; presa B = menos importante. En este caso, el % A de las presas A y B varió de manera constante, cada 10 % (Cuadro 3). En el Cuadro 3 se observa que el % IRIi varió de manera no lineal a medida que varió el % A y la mayor variación ocurrió a valores bajos (Fig. 3).
El emplear una mayor resolución taxonómica en la identificación de las presas que conforman la dieta de un consumidor, permite identificar cuál es el grupo más importante y proporciona una visión más detallada del espectro alimentario de una especie. Hansson (1998), en un ejemplo hipotético, demostró que al emplear diferentes resoluciones taxonómicas se produce una sobreestimación de la importancia relativa del ítem que representa la resolución taxonómica menos detallada. Algo similar se obtuvo en el presente estudio ya que al comparar los valores de % N, % G y % A de los órdenes de insectos consumidos con las familias consumidas, se observó una disminución en la separación de los puntos (frecuencias) para la resolución más fina (familia en este caso). Si bien, la resolución taxonómica que debería emplearse en estudios tróficos es la de especie, cuya definición inclusive resulta ambigua (Aguilera y Silva 1997), esto requeriría de un adecuado conocimiento taxonómico.
Cortés (1997) planteó que una especie es generalista si el % A de las presas consumidas es alto, independientemente de su importancia numérica y/o gravimétrica. Por el contrario, una especie será especialista si el % A de las presas consumidas es bajo, de modo que su criterio sólo considera la variación del % A y no incluye otro como la amplitud del nicho trófico. Supongamos que un consumidor se alimenta sólo de un tipo de presa y el % A de ésta es elevado. ¿Podría considerarse a este consumidor como generalista? Por el contrario, si una especie consume una gran variedad de tipos de presas y el % A de cada una es bajo, ¿sería ésta una especie especialista? Lo anterior significa que debe incorporarse a la propuesta de Cortés (1997), otra variable como el ancho de nicho trófico y considerar la variación dentro de fenotipos (VDF) y entre fenotipos (VEF) en el consumo de las presas (Pianka 1994, Bridcut y Giller 1995, Amundsen et al. 1996).
]]>
En el caso de C. bolivari, los resultados sugieren que la especie puede considerarse generalista por la gran variedad de tipos de presas consumidas, es decir muestra a nivel poblacional, un nicho trófico amplio. Sin embargo, muestra preferencia ]]>
por los altos valores de % A, % N y % G, lo que indicaría una estrategia especialista hacia el consumo de esta presa en particular. Los resultados también sugieren la existencia del componente VEF, por los bajos valores de % A de una serie de presas en las cuales también fueron bajos ]]>
Los bajos valores de % A obtenidos para una serie de presas, no necesariamente indicaría especialización por parte de sus consumidores, ya que éste podría ser el caso si sólo en dichos consumidores no aparecen ]]>
varias de estas presas.
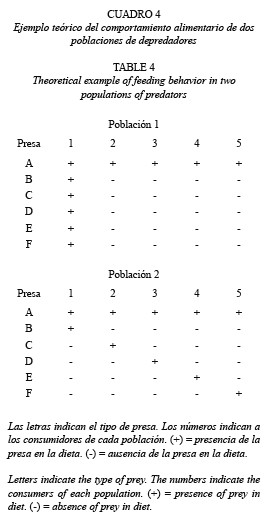
En el Cuadro 4 se muestra un ejemplo hipotético que ilustra este planteamiento. Los números representan a los consumidores de cada población, las letras a las presas, y los símbolos ]]>
(-) de la presa en la dieta de cada individuo. En este ejemplo, el % A de todas las presas, a excepción de A, es bajo e idéntico para ambas poblaciones, es decir 20 % para las presas B, C, D, E y F y 100 % para la presa A. Sin embargo, en la población 1, todas las presas con bajo % A aparecen simultáneamente y ]]>
individuo. Por el contrario, en la población 2, cada una de estas presas con bajo % A aparece en distintos individuos. Si se considera la especialización como el consumo de distintas presas por diferentes depredadores, sólo los individuos de la población 2 entrarían en esta categoría ]]>
de la población 1 a excepción del individuo 1, consumen sólo un tipo de presa (presa A), ésta es compartida por todos los consumidores.
Al realizar este análisis en C. bolivari, ]]>
se encontró que las presas con bajo % A, no aparecieron en los mismos individuos consumidores, es decir los resultados fueron parecidos al ejemplo correspondiente a la población 2. Al respecto, esto indicaría efectivamente la existencia de especialización por parte de una fracción ]]>
Amundsen et al. (1996) sugirieron que las gráficas que incluyen las frecuencias de aparición y de abundancia de las presas se puede detectar la presencia de los componentes VDF y VEF del nicho ]]>
alto VEF correspondería a presas con bajo % A y gran abundancia en la dieta, mientras que un alto VDF correspondería a presas con alto % A y baja abundancia en la dieta. Sin embargo, no necesariamente éste es el único requisito para detectar la presencia del componente VEF,
ya que puede darse el caso de una población depredadora en la cual sólo algunos de sus miembros depredan a determinadas presas, es decir el % A de éstas es bajo, pero sin embargo la intensidad de consumo también es baja, tal y como ocurre en C. bolivari, hacia el consumo de una gran variedad de presas.
Cortés (1997) planteó que, dependiendo del % A, % N y % G, las presas pudieran clasificarse como raras (si los valores son bajos) o dominantes (si los valores son altos)Sin embargo, dicho autor no considera otro criterio como ]]>
escala temporal, de las presas en la dieta del consumidor, independientemente de sus valores de frecuencias. Esto se observó claramente en C. bolivari, la cual si bien consumió una serie de presas y en bajas frecuencias, éstas siempre estuvieron presentes en todo el ]]>
evaluado, de modo que ¿hasta que punto dichas presas pudieran clasificarse como un componente ocasional en la dieta de esta especie? Lo mismo puede ocurrir con las presas denominadas dominantes, las cuales podrían poseer altos valores de frecuencias en la dieta de un consumidor pero sólo aparecer en un ]]>
determinado. En el caso de C. bolivari, esto no ocurrió, ya que la presa con la más alta frecuencia (Diptera) fue depredada en todo el lapso evaluado. Lo anterior indica la importancia de tener un amplio registro temporal de la dieta de un consumidor para aproximarse a una clasificación más acertada de las presas ]]>
Agradecimientos
A Cesar Diaz y Wilmer Texara por su ayuda prestada en los trabajos de campo. A Maria E. Rocha por la ayuda en la redacción del ]]>
de Rancho Grande adscrita al MARN por el apoyo logístico.
Resumen
Se estudió la ]]>
(Creagrutus bolivari) usando diferentes métodos: el método gráfico de Cortés (1997) y dos índices de importancia relativa (George y Hadley, 1979 (% RIi) y Cortés, 1997 (% IRIi)). Sólo las presas discretas (invertebrados acuáticos y terrestres) se emplearon en el análisis de dieta. Se ]]>
ara cada ítem, las frecuencias de aparición (% A), numérica (% N) y gravimétrica (% G). Se analizó un total de 240 ejemplares (intervalo de talla desde 25.3 hasta 64.7 mm de longitud estándar). Para valores de % A > 50 %, el % IRIi resultó mayor al obtenido para el % RIi, con una tendencia opuesta (hasta 130 veces) para valores de ]]>
del 50 %. El % IRIi sobreestimó la importancia relativa de las presas para valores altos de % A, mientras que subestimó la importancia relativa de las presas para valores bajos de % A y mostró un comportamiento no lineal a medida que varió el % A. Las variables empleadas en el método gráfico de Cortés son insuficientes para evaluar la estrategia alimentaria del depredador ]]>
este modo, se sugiere incluir otras variables como el ancho de nicho trófico poblacional e individual así como un adecuado registro de campo. Es necesario un amplio registro de campo para clasificar a las presas como escasa o dominante de acuerdo a la clasificación de Cortés. Los índices compuestos que incluyen las variables: ]]>
aparición proporcionan una descripción más precisa de la dieta y permiten realizar estudios comparativos. El análisis gráfico es fácil de interpretar y ayuda a evaluar aspectos como la importancia de la presa y la estrategia alimentaria del depredador.
]]>
Palabras clave: análisis de dieta, índice de importancia relativa, peces neotropicales, Characidae, Creagrutus.
Referencias
]]>
Aguilera, M & J.F. Silva. 1997. Especies y Biodiversidad. Interciencia 22: 299-306.
[ Links ]Anthony, S.H., R.P. Vari, A. Machado-Allison & F. Provenzano. 1994. Creagrutus hysginus (Teleostei: Characiformes), a new species of characid from northeastern Venezuela, Sucre State. Copeia 4: 975-979.
[ Links ]Amundsen, P.A., H.M. Gabler & F.J. Staldvik. 1996. A new approach to graphical analysis of feeding strategy from stomach contents data modification of the Costello (1990) method. J. Fish. Biol. 48: 607-614.
[ Links ]Bagenal, T. 1978. Methods for assessment of fish production in freshwater. IBP Handbook, No 3. Blackwell, Oxford, Inglaterra. 365 p.
[ Links ]Borjas von Bach, P. 2001. Empleo de dos métodos para el análisis de la dieta de Cregrutus bolivari (Pisces: Characidae) y estimación de su variación temporal. Tesis de Licenciatura. Universidad Central de Venezuela, Caracas, Venezuela. 76 p.
[ Links ]Bridcut, E. & P. Giller. 1995. Diet variability and foraging strategies in brown trout (Salmo trutta): an analysis from subpopulations to individuals. Can. J. Fish. Aquat. Sci. 52: 2543-2552.
[ Links ]Cortés, E. 1997. A critical review of methods of studying fish feeding based on analysis of stomach contents: application to elasmobranch fishes. Can. J. Fish. Aquat. Sci. 54: 726-738.
[ Links ]Cortés, E. 1998. Methods of studying fish feeding: reply. Can. J. Fish. Aquat. Sci. 55: 2708.
[ Links ]Costello, M.J. 1990. Predator feeding strategy and prey importance: a new graphical analysis. J. Fish. Biol. 36: 261-263.
[ Links ]Frost, W.E. 1954. The food of the pike, Esox lucius. L., in Windermere. J. Anim. Ecol. 23: 339-360.
[ Links ]George, E.L. & W.F. Hadley. 1979. Food and habitat partitioning between rock bass (Amblopites rupestris) and smallmouth bass (Micropterus dolomieui) young of the year. Trans. Am. Fish. Soc. 108: 253-261.
[ Links ]Géry, J. 1977. Characoids of the World. TFH, Ciudad de Neptune, Nueva Jersey, EEUU. 672 p.
[ Links ]Hansson, S. 1998. Methods of studying fish feeding: a comment. Can. J. Fish. Aquat. Sci. 55: 2706-2707.
[ Links ]Harold, A.S. & R.P. Vari. 1994. Systematics of the trans-andean species of Creagrutus (Ostariophysi: Characiformes:Characidae). Smiths. Cont. Zool. Washington, No 551: 1-31.
[ Links ]Huber, O. 1986. La Selva Nublada de Rancho Grande, Parque Nacional Henri Pittier. Acta Científica Venezolana, Caracas, Venezuela. 288 p. [ Links ] Hynes, H.B.N. 1950. The food of freshwater sticklebacks (Gasterosteus aculeatus and Pygosteus pungitius) with a review of methods used in studies of the food of fishes. J. Anim. Ecol. 19: 36-58.
[ Links ]Hyslop, E.J. 1980. Stomach contents analysis: a review of methods and their application. J. Fish. Biol. 17: 411-429.
[ Links ]Knight, R.L. & F.J. Margraf. 1982. Estimating stomach fullness in fishes. N. Am. J. Fish. Manage. 2: 413-414.
[ Links ]Kwak, J.T., M.J. Wiley., L.L. Osborne & R.W. Larimore. 1992. Application of diel feeding chronology to habitat suitability analysis of warmwater stream fishes. Can. J. Fish. Aquat. Sci. 49: 1417-1430.
[ Links ]Lowe-McConnell, R.H. 1987. Ecological Studies in Tropical Fish Communities. Cambridge, Londres, Inglaterra. 382 p.
[ Links ]McDonald, J.S. & R.H. Green. 1983. Redundancy of variables used to describe importance of prey species in fish diets. Can. J. Fish. Aquat. Sci. 40: 635-637.
[ Links ]Merrit, R.G. & K.W. Cummins. 1984. An Introduction to the Aquatic Insects of the North America. Kendall/ Hunt, Iowa, EEUU. 722 p.
[ Links ]Ortaz, M. 1992. Hábitos alimenticios de los peces de un río de montaña neotropical. Biotropica. 24: 550-559.
[ Links ]Ortaz, M. 2001. Diet seasonality and food overlap among fishes inhabiting the upper Orituco stream in northern Venezuela. Rev. Biol. Trop. 49: 191-198.
[ Links ]PDVSA. 1993. Imagen Atlas de Venezuela: una visión espacial. Arte, Caracas, Venezuela. 271 p.
[ Links ]Pianka, E.R. 1994. Evolutionary ecology. Harper-Collins, Nueva York, EEUU. 397 p.
[ Links ]Pinkas, L., M.S. Oliphant & I.L. Iverson. 1971. Food habits of albacore, bluefin tuna and bonito in California waters. Calif. Fish. Game. 152: 1-105.
[ Links ]Roldán, P.G. 1996. Guía para el Estudio de los Macroinvertebrados Acuáticos del Departamento de Antioquia. Universidad de Antioquia, Bogotá, Colombia. 217 p.
[ Links ]Segatti, N.H. & R.D. Luciana. 2003. Métodos para la evaluación de la alimentación natural de peces: ¿Qué estamos usando? Interciencia 28: 100-104.
[ Links ]Taphorn, D. 1992. The Characiform fishes of the Apure river drainage, Venezuela. Biollania (Edición Especial) 4: 1-536.
[ Links ]Usinger, R. 1956. Aquatic Insects of California with keys to North American Genera and California Species. California, California, EEUU. 508 p.