


 Inglés (pdf)
 Articulo en XML
 Referencias del artículo
 Enviar articulo por email
 Citado por SciELO
  Similares en
SciELO
Similares en
SciELO 
 Permalink
Introduction
Global warming has been caused and accelerated by harmful pollutants. Therefore, the planet's temperature is expected to be 1.1 °C higher by 2011-2020 when compared to the 1850-1900 period (IPCC, p. 4). The leading drivers propelling this perceptible outcome are energy use, good manufacturing, cutting down forests, transportation, food production, strengthening energy supply, and society's lifestyles and consumption patterns.
Amid this disquieting context, humanity's prospects seem dismal. Nonetheless, there appears to be a light at the end of the road. Nowadays, Costa Rica is considered an environmental success due to its recent history of reforestation and its environmental regulations and incentives. Does this mean this country can be considered one of a kind in the environmental realm? It is ambitious to see this small nation in such a way, but it would be interesting to analyze its environmental reality to determine why it has gained such a reputation. What has Costa Rica done differently in terms of its environmental future?
In the 1940s, 75% of Costa Rica's territory was rainforest. With the arrival of loggers in the 1950s and 1960s, the country shifted parts of its forest cover to grow crops and livestock. Such production trend continued during the 1970s and 1980s. By then, Costa Rica was experiencing one of the highest deforestation rates in Latin America (Earth.org, 2023, para. 4), which led to around half of its rainforest cover to be destroyed by 1987. As a reaction to such an unsustainable economic development model, the country was able to shift its course by implementing conservation-oriented forests and ecosystem policies.
Costa Rica protected its national parks system in 1969 and implemented a tree plantation subsidy policy since 1979 (Watson et al., 1998). These policies motivated the country's decision-makers to extend conservation efforts by establishing the 1996 Forest Law and banning the cutting down of forests throughout the entire country (Earth.org, 2023, para. 4). The following year, 1997, saw the creation of a very strategic policy, which established Payments for the Environmental Services program, which created an economic incentive per hectare for basic forest protection (Steed, 2003, p. 174). Application of such policies helped Costa Rica reverse deforestation through painstaking work, achieving a forest cover of up to approximately 53% of its total land area by 2023 (Garg, 2023). Have these achievements been transformed into lower emissions of greenhouse gas emissions despite the pressure of economic growth?
In the last two decades, Costa Rica has also demonstrated a very good proactive global leadership in biodiversity and natural resource conservation and protection, confronting climate change, and promoting sustainable development. The country's leadership has been striving to become carbon neutral by 2050 in alignment with the Paris Climate Agreement and the United Nations (UN) Development Goals. In 2019, the country also received the UN's Champion of the Earth award for its efforts to combat climate change (UN Environmental Programme, 2019). It is also worth noting that Costa Rica recently, in 2021, led 'the High Ambition Coalition for Climate Change to achieve the protection and conservation of 30% of marine and coastal spaces by 2030' (Garg, 2023).
Such accomplishments by this small country are worth noting. But at the same time, it raises interesting questions as to how realistic it is for Costa Rica to be an environmentally friendly country in practice. For instance, in 1990, Costa Rica's ecological footprint per person reached an equilibrium regarding its biocapacity per person. Since then, the country has experienced an ecological deficit per person, expected to be -1.0 global hectares in 2022 (Global footprint network, 2023, Costa Rica). An ecological deficit happens when 'the footprint of population exceeds the capacity of the area available to that population' (Global footprint network, 2023, Glossary). Does it mean that Costa Rica is losing ground to mainstream economic development? Is Costa Rica's economic growth causing more emissions of carbon dioxide emissions and more environmental damage?
These contrasting facts give rise to this essay's research thesis: Could mainstream economic growth, expressed as GDP per capita, lead Costa Rica to lessen its environmental degradation? As the inverted U-shaped EKC seems to provide an interesting theoretical framework to address this research question, then this research paper's main objective is to test whether the EKC is suitable for challenging its principal premise that when economic growth (expressed in GDP per capita) reaches a certain threshold, the economy's impact on environmental degradation decreases. This paper is organized in the following sections: a. literature review where the environmental curves' most important versions and interpretations are presented and discussed; b. a methodology section is explained by which a mixed method is undertaken, with both a qualitative component (the theory's contrasting epistemological interpretations as well descriptive statistics) and a quantitative one (a time series econometric analysis with emissions of CO2 per capita as its dependent variable, is contrasted against economic growth expressed in GDP per capita and other relevant variables); c. interpretation and analysis of results with their robustness and logic explained in detail; and finally d. a conclusions and recommendations section.
Literature review
The dilemma created by the relationship between economic growth and environmental degradation seems to be a relatively recent line of research, especially when considering the hypothesized inverted U-shaped EKC. The number of studies generated to address this relationship is still alive today and is a debate that has gained intensity in the last two decades. Nonetheless, the studies which focus on demonstrating such a relationship in Costa Rica are very limited.
In 1955, Simon Kuznets wrote his influential essay called Economic growth and income inequality. He hypothesized that the inverted U-shaped EKC determines that as per capita income of a country increases in the initial development phases, so does income inequality. This trend continues until it reaches a threshold, after which income inequality declines. Later, it started to be used to analyze economic growth's influence on environmental deterioration.
The first time the inverted U-shaped EKC was applied with environmental application was in the 1992 World Development Report (The World Bank, 1992). In this pioneering publication, the EKC undertook an analysis of 47 cities in 31 countries, raising the question of whether economic growth increases sulfur dioxide emissions. The obtained result was like the one hypothesized with the original version of the inverted U-shaped EKC. Thus, as economic growth increases, sulfur dioxide emissions increase to a certain tipping point in which the trend begins to change, and an opposite relationship takes place thereafter. Almost simultaneously, other seminal authors, such as Grossman and Krueger (1991), wrote an analysis of the environmental damage that the North American Free Trade Agreement could cause.
As noted by the author Dinda (2004), the logic supporting the EKC, is the transition from an agricultural society to industrial production in urban areas. As incomes increase and as time is allowed to pass by, economic growth pushed by industrial production would eventually make pollution decline. Ultimately, industrial production is phased out, with a high technology and service-oriented economy. As this transition happens, society shifts its demands towards achieving a clean climate, and thus a reduction of environmental degradation is expected.
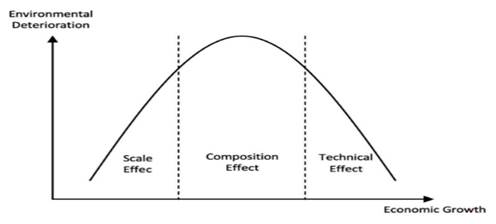
Such transformations contemplated in a country's EKC also have theoretically 'proximate causes' (Stern, 2004) based on scale, technological, and composition effects. Firstly, the scale effect considers that more economic growth causes more pollution because more output requires more inputs, which is also dependent on more natural resources (Grossman, 1991). As noted in Graph N° 1, the scale effect takes place in the initial stage in which agricultural production begins to be transformed into a more industrial one, but also a more service oriented society. As higher economic growth is experienced, an offsetting of the scale effect begins as competitive advantage and efficiency is required in the production processes. It also goes hand in hand with a demand from society for more services. The phasing out of the scale effect begins to occur.
The composition effect begins to catalyze the transformation of the output mix, which means that the market starts demanding not only consumer goods, but also services. When the market, in general, both the private and the public sectors, shifts to a more services-intensive consumption pattern, there is a shift in the composition of goods and services demanded. This change works alongside a market with a higher income level, which requires more research and development and a greater availability of professional services for a society with a greater level of needs and development. Consequently, dependence on industrial production is minimized, as the composition of goods and services that society requires changes. Society may experience an increase in economic growth without increasing environmental deterioration (Vukina, et al. 1999). The EKC reaches a tipping point and then begins to decline.
How is it possible that the EKC begins to change its trend? Along with the composition effect, the technical/technological one begins to propel a very influential transformation to more efficient production processes with increasing returns to scale, which also lead firms to produce more cheaply, and societies to invest more in research and development. New technology leads to greater efficiency, to less dependence on natural resources and creates a diminishing effect on pollution levels.
Source: Kuznets (1955) and AlKhras (2022)
Figure N° 1. Environmental Kuznets Curve: Phases of environmental deterioration
As societies become wealthier due to greater economic growth and as their advancement transforms their economies from agricultural to intensive ones in services, they start demanding a cleaner environment. Their willingness to pay for less environmentally damaging products and services increases as their income per capita increases. Stringent environmental regulation becomes popular not only with the general population but also with the political movements representing them in Congress and in civil society as well (Hettige, et al. 2000). This raises an interesting dilemma of whether a society already needs to be rich to be able to reach such a level of environmental awareness. Beckerman (1992) made the controversial argument that the only possible path for countries to achieve a clean environment 'is to become rich' (p. 491).
Several studies have been published trying to demonstrate the EKC hypothesis. Several of them, the most notable ones, are discussed briefly. The first one to note is the study by Cederborg and Snobohn (2016) by which they apply a database of 69 industrial and 45 poor countries using a cross-sectional framework. Their findings are very concrete and concluded that there is a correlation between economic growth and environmental degradation. As per capita income goes up, this leads to increasing greenhouse emissions, with no turning point in this relationship. The market mechanism is not enough to reverse this prediction according to the authors. Another notable study by Selden and Song (1994) used a sample of 30 countries based on a time series analysis. They concluded that in countries with low population densities, there will be laxed stringent environmental regulations and more greenhouse gas emissions related to transportation. They discovered that environmental pollution could decline at sufficiently high levels of income. Additionally, Panayotou (1993) wrote a very influential paper by which he undertook an analysis of several relevant dependent variables influenced by income per capita. He concluded that at higher levels of development, the pressure that information-based industries and other service industries linked with more environmental regulation and awareness as well as better technology and more green investments could level off gradually environmental degradation. As noted, the conclusions on the EKC vary from author to author, but the database and econometric approach is hardly the same every time.
As part of the critique sustained by academia towards the EKC hypothesis, two other very influential schools of thought have been proposed to understand the relationship between economic growth and environmental degradation: the Brundtland environmental Curve hypothesis and the Environmental Daly Curve hypothesis.
The World Commission on Environment and Development (WCED) proposed the Brundtland curve hypothesis in 1978 in their recognized report 'Our Common Future.' This report is also commonly known as the Brundtland report.
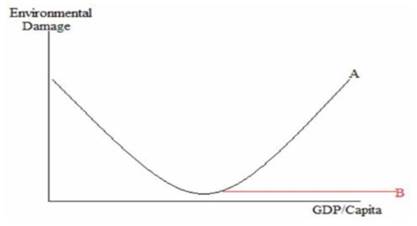
As noted in Figure N° 2, countries with low levels of GDP per capita can generate high levels of environmental deterioration in the initial development stages. As economic growth evolves, environmental degradation levels decrease. A turning point is reached, and afterward, as economic growth happens, environmental damage relentlessly increases.
Opposite to classical EKC, the Brundtland curve is U-shaped. As countries remain poor, their dependence on natural resources is firm. Their needs satisfaction does not prioritize environmental awareness or well-being, which leads to high deforestation levels and overuse of productive lands. This leads to high deforestation levels and overuse of productive lands. This happens for the poor to sustain their livelihoods in the short term. Despite the subsequent reduction of environmental degradation that occurs as incomes grow, it reaches a minimum from which environmental damage continues reaching the original levels of pollution and resource devastation.
This increasing trend in environmental damage after crossing the minimum point of the Brundtland curve is pushed further up by increasing reliance on consumption and production based on the mainstream economic models dependent on natural resources. Nonetheless, there is some room for hope according to this hypothesis. The level of environmental damage may reach a steady state, at point B noted in figure N° 2, by which the development of green technologies and sustainable development efforts happen. This can also lead to sustainable and innovative production, which, in turn, can counteract the environmental damage (Bratt, 2012).
The proposal made by Herman Daly (1973), also known as Daly's Environmental curve, has a difference in particular from Kuznets and Brundtland.
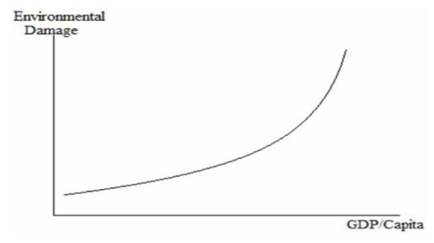
As noted in Figure N° 3, the Daly Environmental curve does not experience a turning point. His position is pessimistic as he argues that a steady state economy is not an option. The effect of our current economy's heavy dependence on natural resources and the increased demand for production is an irreversible phenomenon despite efforts made to counteract it based on green technology and innovation.
Daly argued that the damage done by humankind to the environment is so severe that despite the incentives applied to obtain a cleaner planet, the future of society is doomed. The impact of innovation is not enough to reverse the damaging trend caused by excessive and unsustainable economic growth.
Both positions taken from the U.N. Secretary-General (The Brundtland report) (1987) and Daly (1973) are antagonistic positions that dare to contradict the EKC as proposed by the World Development Report (The World Bank, 1992) and Grossman and Krueger (1991). The EKC has an inverted U-shape showing that the environmental deterioration increases in the initial stages as incomes increase, but then it decreases after a certain threshold of GDP per capita. The opposite findings are discovered for the Brundtland curve, where pollution and contamination go down in the initial stages but then increase or may stagnate as a possibility at a certain level of income. Both curves have a tipping point and an increase in environmental deterioration from the influence of the scale effect.
A noticeable difference between these two theories is the explanation of why environmental damage decreases. On the side of the EKC hypothesis, the production processes effectiveness and societal pressure to have a cleaner planet drive environmental deterioration down at later income stages. On the other hand, the Brundtland Environmental curve follows the argument that alleviating poverty leaves space for the environmental conditions to improve at an early stage of income growth.
From a contrasting perspective, the Daly Environmental curve does not present any tipping point, as the pressure of more natural resources generated by more production causes environmental damage. From a comparison perspective, in three of these theories, the scale effect is the common driver that causes the increase in environmental degradation.
Methodology
Time series data have been collected from the year 1990 up to the year 2021 to develop the econometric model. The main objective of using time series data in an econometric model is to discover patterns and trends. Since some inconsistencies were found in the historic trend, the decision was made to start running the analysis from the first year in which all variables accounted for information. Therefore, the year 1990 is the starting point of reference.
What are the main characteristics present in time-series econometrics? It deals with the analysis and modeling of data that varies over time. The most important features of a time-series model are presented in the following table (table 1):
Table 1 Characteristics of a time series econometric model
| Temporal Dependency | The value of a variable at a particular point in time is influenced by its past values. The observation at one time point is dependent on the observations at previous time points. |
| Time Trend | Time series data often exhibit a trend, which refers to a longterm increase or decrease in the variable of interest over time. |
| Seasonality | Many time series datasets display seasonal patterns, where the variable of interest shows regular and predictable fluctuations over specific time periods. |
| Stationarity | Statistical properties, such as mean and variance, remain constant over time. |
| Autocorrelation | Refers to the correlation between the values of a time series at different lags. Positive autocorrelation indicates that high values are followed by high values and vice versa, while negative autocorrelation indicates an alternating pattern. |
Source: Adkins & Hill (2007), Fernández (2005) and Gujarati, D. (1997).
The time series model to be built uses the ordinary least squares method considering robust standard errors as it faces the possibility of heteroscedasticity presence in the data. This provides a more reliable inference on the coefficients when the assumption of homoscedasticity is violated, especially with concerns about potential outliers or influential observations in the dataset.
The description of the variables used in the model is presented as follows (table 2):
Table 2 Description of variables, measurement, and source used in the model.
| Variables | Abbreviation used in regression | Definition and unit of measurement | Source of data |
|---|---|---|---|
| CO2 emissions per capita | ln_co2pc | 'Annual total production-basedemissions of carbon dioxide (CO2), excluding land-use change, measured in tons per person. This is based on territorial emissions, which do not account for emissions embedded in traded goods'. (Global Change Data Lab, 2023). A logarithm is applied. | Global Change Data Lab (2023) |
| GDP per capita (constant 2015 US dollars) | ln_GDPpc_cons | 'GDP per capita is gross domestic product divided by midyear population. GDP is the sum of gross value added by all resident producers in the economy plus any product taxes and minus any subsidies not included in the value of the products. It is calculated without making deductions for depreciation of fabricated assets or for depletion and degradation of natural resources. Data are in constant 2015 U.S. dollars' (World Bank, 2023). A natural logarithm is applied. | World Bank (2023). World Development Indicators |
| GDP per capita (constant 2015 US dollars) squared | GDPpc_cons_sq | Same as the previous definition of GDP per capita (constant 2015 US dollars) but squared. | World Bank (2023). World Development Indicators, and author's estimation. |
| Energy per capita | energy_pc | 'Primary energy consumption per capita, measured in kilowatt-hours per person per year' (Global Change Data Lab, 2023). | Global Change Data Lab (2023) |
| Land use change per person | landuse_co2_ pc | 'Annual production-based emissions of carbon dioxide (CO2) from landuse change, measured in tons per person. This is based on territorial emissions, which do not account for emissions embedded in traded goods' (Global Change Data Lab, 2023). | Global Change Data Lab (2023) |
Thus, the equation of the time series econometric model with robust standard errors is the following:
ln_co2pc = β0 + β1 ln_GDPpc_cons + β2 GDPpc_cons_sq +β3+energy_pc+ β4 landuse_co2_ + єit
In this equation, β0 is the y-intercept, and β1 a β5 are the corresponding slopes of the regression line associated with each associated variable. The єit term corresponds to the term of disturbance or errors. With the model built, the analysis of results is presented in the following section of this essay.
Analysis and Discussion of Results
Descriptive analysis
From a descriptive point of view, which environmental curve hypothesis best suits Costa Rica's relationship between GDP per capita and carbon dioxide emissions (representing environmental damage)? Figure 4 gives a general idea of how Costa Rica approaches any of the three hypotheses.
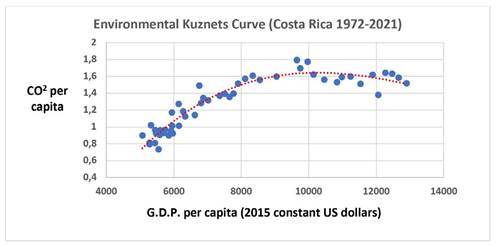
Sources: GDP per capita data was obtained from the World Bank (2023), and C02 per capita data was obtained from Global Change Data Lab (2023)
Figure 4: Environmental Kuznets Curve (Costa Rica 1972-2021)
This dispersion graph presents interesting descriptive evidence through the polynomial level 3, red trend line. Through an objective observation criterion, this curve more closely resembles the classical EKC hypothesis. Apparently, its turning point is around 10,000 constant 2015 US dollars, as later the environmental damage level begins to decline. Nonetheless, it cannot be considered a definite conclusion, as the country's income level still lags to that of the wealthiest nations on the planet. The shift in the trend is very promising and may confirm the country's environmental leadership described earlier in this paper. In order to have a more robust analysis and conclusion about answering the main research question of whether economic in Costa Rica lead this country to lessen its environmental degradation, it is necessary to undertake an econometric analysis of the relevant variables along with the pertinent econometric testing to determine the proposed model's robustness.
Econometric analysis
Using the time-series econometric model with proposed robust standard errors, robust regression results are presented in the following table:
Table 3 Results of the regression model proposed.
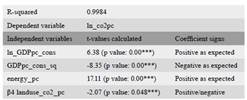
Note: * significance at 10% level; ** significance at 5% level; *** significance at 1% level; n. a.: Not applicable.
Is this model a good and reliable? Before analyzing the results, an interpretation of the main statistical tests is made to determine if it is a strong model or not. Residuals have been analyzed and it is determined that the observed errors are consistent with the stochastic errors. The model is correct on average to all the adjusted values.
From the results obtained in the t-values calculated, all p values are below 5%. This implies that all independent variables are statistically significant in relation to the dependent variable ln_GDPpc_cons. In this case, the null hypothesis for each estimator calculated is rejected. This reinforces the idea that the independent variables selected are good explanatory variables with a 95% level of confidence.
The Goodness-of-fit test is presented in the R-squared. The 0.9984 result obtained is very strong as it implies that the data adjusts very well with the regression line of 99.84%. However, other tests are necessary to determine its robustness and reliability.
The Snedecor-F test was applied with the Cochrane-Orcutt Arima (1) regression with a result of 2180.17. With 4 degrees of freedom in the denominator and 26 in the denominator, the table indicates that dependent variables with values above 4.14 included in the model have explanatory power in relation to the independent variable.
Two relevant concerns that time-series models encounter are the issues of heteroscedasticity and autocorrelation. To establish the presence of both statistical patterns, testing was undertaken in the proposed model. White's test was run for heteroscedasticity and obtained the probability value of the chi-square statistic of 0.0306, which is less than the benchmark of 0.05. The null hypothesis of constant variance is accepted at a 5% level of significance. Thus, there is no presence of heteroscedasticity in the residuals.
Additionally, the Durbin-Watson test was applied to determine the presence or absence of autocorrelation. An acceptable range in the result of this statistic is between 1.5 and 2.5. If the statistical result is within this range, then this demonstrates there is no autocorrelation in the respective model. A Cochrane-Orcutt Arima (1) regression with iterated estimates was run. The Durbin-Watson test result obtained is 1.5685, which is within the acceptable range. Thus, there is no autocorrelation according to this estimation.
Despite these initial results, there is a possibility that the model presents certain weaknesses such as a high correlation between the independent and the independent variables selected, reflected in the very high goodness-of-fit test obtained. As a consequence, this can also imply that the model presents multicollinearity among the variables. Such a possibility was initially confronted by applying a robust regression instead of a classical ordinary-least-squares regression. Keeping this possibility in mind and also considering the fact that the independent variable does not fulfill, strictly speaking, the criteria of normality (Skewness chi squared test of 0,0215 which accepts the null hypothesis), then the interpretation of the t-values calculated can fall in ambiguity. Overall, it can be considered that the model may not be the most appropriate proposal as a means of assuring with reliability and robustness that economic growth is lessing Costa Rica's environmental degradation. The model proposed in this study of the Environmental Inverted-U-Curve as originally stipulated by Kuznets, cannot be demonstrated for the case of Costa Rica.
There are several ways in which the problems of multicollinearity can be resolved such as increasing the sample size or the elimination of independent variables with high correlation with the dependent variable, or even with the transformation of the data. Nonetheless, it is considered not prudent to apply any further changes to the model as both a robust regression and a Cochrane Orcutt Arima (1) regression methods have been applied to the analysis. Despite the initial promising results obtained with these 2 regressions, the likelihood of presence of multicollinearity in the model and lack of normality of the dependent variables leads to ambiguity in its results.
Interpretation of partial regressions results
Based on the research question and keeping in mind the previous discussion about the ambiguity that has been demonstrated in the EKC for the case of Costa Rica, interpretation of the partial regressions' results of each of the independent variables in relation to the dependent variable of CO2 emissions per capita, can be used as a quick but not a concluding statement about these linear relationships.
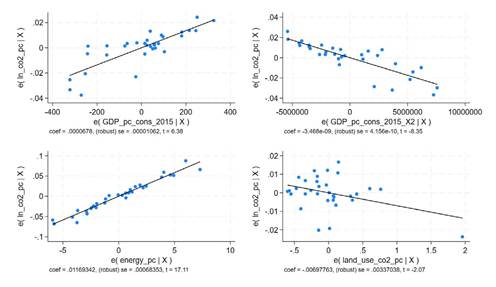
As observed, the independent variables showing a steeper slope, with a positive sign at a 5 % margin of error, are both GDP per capita (constant 2015 US dollars) and energy per capita. For GDP per capita, the expectation a priori is that as CO2 emissions per capita increase, income will increase as well. For every ton of CO2 emissions issued in Costa Rica, income per capita will grow by 6.39 dollars. Despite the ambiguity of the model exposed earlier, this result sheds light on the expectation a priori since this is expected in the initial stages of economic growth. However, Costa Rica's EKC presented in Fig. 4 shows a tipping point, which also seems to change its trend into a declining one. The declining trend cannot be confirmed yet, as a few more years will go by to confirm it as its income continues to increase. However, Costa Rica's international leadership and recent developments in sustainability are very promising.
Regarding energy per capita, the expectation a priori is that as CO2 emissions emitted in Costa Rica increase, energy consumption level per person will also increase. For every ton of CO2 emissions issued in Costa Rica, energy consumption measured in kilowatt-hours per person will increase 17.22 kilowatthours per person. Despite the fact that the econometric model present ambiguity in its finding, this partial regression follows the expectation a priori. This relationship is explained by countries' reliance on fossil fuels for their energy needs. The means of reversing such relationship is to rely more on renewable energy or low carbon sources. The future is promising for Costa Rica in regard to this relationship as the country has made very important efforts to substitute fossil fuels-based energy with renewable energy.
In Figure 5, the independent variable that shows a steeper slope with a negative sign at a 5% margin of error is GDP per capita (constant 2015 US dollars) squared. In terms of this independent variable, the expectation a priori is based on the classical EKC, which means it is expected that the relationship between increases in CO2 emissions and GDP per capita (constant 2015 US dollars) squared will have a polynomial form with an inverted U-shaped curve, as its sign is negative. In Figure N° 4, this has already been achieved. This partial regression's slope expresses that as CO2 emissions increase one ton, GDP per capita (constant 2015) squared decreases by 7.87 2015 constant dollars. This result could confirm that Costa Rica's EKC resembles the classical EKC proposed by Kuznets (1955) and the World Development Report (1992). However, the lack of robustness and reliability experienced in the econometric model of this study leads to a degree of ambiguity in this interpretation.
Also, the only independent variable that shows a negative slope associated with a negative sign of a 5 % significance level is land use change. The expectation a priori is that as emissions of CO2 increase (excluding land use), land use change will increase. Such affirmation cannot be confirmed due to the ambivalence present in the econometric model exposed. Nonetheless, its general interpretation is useful as a means of analyzing its possible impact. Deforestation increases CO2, as forests are often cleared for agriculture, logging, or urbanization, exacerbating the greenhouse effect. Agricultural expansion also leads to changes in land use. As the population grows and demands for food increase, there may be a need to convert more land for agriculture. Urbanization can cause land use patterns that convert agricultural or natural land into built-up areas. All these anthropocentric activities would generally trigger greater CO2 emissions directly related to land use change. However, the result is astonishing, as the expectation a priori is not met. Despite the expectations, increases in CO2 emissions are leading to a 1.7-ton reduction per person of land use-related emissions of CO2, which could reflect Costa Rica's shift towards better land use management practices and preservation and protection of its current forest covers.
Conclusions
As humankind is more pressured to take effective action against global warming, it becomes imperative to study and understand the relationship between greenhouse gas emissions (represented by carbon dioxide emissions in this study) and economic growth expressed in income per capita. As discussed in this study, there are three hypothesis versions of such a relationship. Daly's (1973) and Brundtland's (U.N. Secretary General, 1987) curves hypotheses have a rather pessimistic forecast as they predict that the world will experience an increase in CO2 emissions as economic growth happens. Only Kuznets (1955) Environmental curve hypothesizes that in later stages of economic growth, CO2 emissions will start to decline.
This study concludes that the EKC hypothesis application in Costa Rica has obtained very interesting results, but they cannot be confirmed with reliability and robustness because of the ambivalence and ambiguity present in the proposed model. Despite the initial promising results of a high goodness-of fit test, an acceptable F-statistic, the lack of heteroscedasticity, and an acceptable result showing no autocorrelation presence. Such results are put to the test with likelihood of presence of multicollinearity among the variables and the lack of normality of the dependent variable. In the absence of a robust and reliable model to analyze the EKC hypothesis in Costa Rica, the hypothesis of this study cannot be answered affirmatively. It cannot be concluded that economic growth may propelled reductions in carbon dioxide emissions for this country. Future studies can take advantage of these findings by attempting to use a more adaptable regression model that considers the factors causing the ambivalence in this model's results: the possibility of high correlation among the dependent and dependent variables and lack of normality of the dependent variable. More observations in a time-series format and the inclusion of statistically significant independent variables could be of much benefit.
Despite the challenge of the ambiguity that the model may experience in the results of the t-statistics calculations, it has been discussed how policymakers in Costa Rica can use these interpretations to enhance their effectiveness in their decision-making. There is still a long road ahead and the leadership role that Costa Rica has exercised in the relevant international fora is very promising.
The recently implemented initiatives related to Carbon Neutrality for the year 2050, as well as the establishment of Nationally Appropriate Mitigation Actions in the different industries in the country, need to be applied more aggressively in the National Development Plans. Moreover, there is a need to boost investment in renewable energy implementation in the transportation sector. Costa Rica needs to continue being a leader in environmental matters and demonstrate such leadership with effective actions to achieve sustainability at levels in the foreseeable future

