


 Inglés (pdf)
 Articulo en XML
 Referencias del artículo
 Enviar articulo por email
 Citado por SciELO
  Similares en
SciELO
Similares en
SciELO 
 Permalink
Introduction
As the linear mainstream economic system has used natural resources as inputs in its production and consumption processes, and has also controversially served “as a sink for outputs in the form of wastes”, (Geissdoerfer et al., 2017, p. 759) throughout the second half of the XX century, and the first twenty years of the XXI century, the world is facing huge disparities between and within countries in terms of how these wastes, scraps, and residues (from on now the word waste will imply these three concepts) are dealt with. “The world generates 2.01 billion tons of municipal solid waste annually, with at least 33 percent of that -extremely conservatively- not managed in an environmentally safe manner” (World Bank, 2021). Such estimate is expected to grow up to 3.40 billion tons by 2050, and Latin America and the Caribbean is expected to increase its solid waste in 59.74 percent by 2050, when compared to 2016 (World Bank, 2021).
Amidst these disquieting figures, a new promising development model has risen, finding in the concept of circular economy a new breeding ground for innovative and creative solutions for the world environmental problems. The circular economy, as defined by the Ellen Macarthur Foundation (2015) states that it “is restorative and regenerative by design and aims to keep products, components, and materials at their highest utility and value at all times, distinguishing between technical and biological cycles” (p. 2). Within the technical cycle, waste is not taken into consideration, as it is not to be produced. “Technical materials - polymers, alloys, and other man-made materials - are designed to be recovered, refreshed and upgraded, minimizing the energy input required and maximizing the retention of value (in terms of both economics and resources)”. (Ellen Macarthur Foundation, 2015, p. 7).
Circular economy trends in the world have also significantly influenced the international trade flow of waste. This is a consequence of the “potential opportunities to direct waste to countries with comparative advantage in sorting and processing activities that can help boost global recycling rates” (Organization of Economic Cooperation and Development (OECD), 2018, p. 8). Costa Rica is no exception to this international trend, and it has been very actively exporting wastes. In 2018 this represented approximately 1.96 percent of its total exports (Banco Central de Costa Rica, 2019, and Chatham House, 2019) and its global trade share in this type of trade was less than 0.1 percent (Chatham House, 2019). Even though it seems like a very modest participation when compared at a global scale, value and volume of exported waste has been increasing exponentially from US$38.5 million in 2000 to US$221 million in 2018 (Chatham house, 2019).
As the circular economy continues to become a particularly important alternative for reaching a sustainable future, concerns arise as to how both developing and develop countries are going to manage the increasing amounts of wastes, and what has led countries like Costa Rica, to participate in this type of international trade. Thus, the following research question is established for this paper: What are the main determinants of Costa Rica’s exports of wastes?
Methodology
To approach this question, a general descriptive analysis of Costa Rica waste exports will be made in terms of its recent evolution based on weight and value exported to different importing countries, as well as its composition. Then, a Poisson pseudo-maximum-likelihood gravity model is used with a 2018 cross-sectional database for Costa Rica’s waste exports to 47 countries in which their Gross National Income per capita (GNI), waste imports from other countries to Costa Rica, sizes of their populations, distance between the capital cities, their services sectors as a proportion of their total economy, as well as their environmental performance, are all taken into consideration in order to determine if they are determinants of Costa Rica’s participation in waste exporting.
Recent trends in world’s exports of wastes
The circular economy is generally confined to the local economy where domestic waste is either recycled within the boundaries of the nation’s territory or it is either discarded domestically. However, the global economy is very interlinked, and the boundaries of the circular economy cannot be tied up to only the local economy. As noted in graph N. 1, the volumes of exported waste have increased substantially since 2000, and the trend is expected to increase considerably as the world becomes more globalized.
The top 5 exporters of wastes in the world for the year 2019 were the United States with $42.9 billion, Germany with $22 billion, Brazil with $16.1 billion, Canada with $14.8 billion, and the Netherlands with $14.3 billion. The total amount of exports of waste in the year 2019 were $305 billion; however, the year with the highest value in waste exports was 2011 when it reached $337 billion. On the other hand, the top 5 importers in the world in terms of value for the year 2019 were the following: China with $41.7 billion, Germany with $22.4 billion, United States with $18.5 billion, South Korea with $13.2 billion, and the Netherlands with $12.8 billion (Chatham house, 2019).
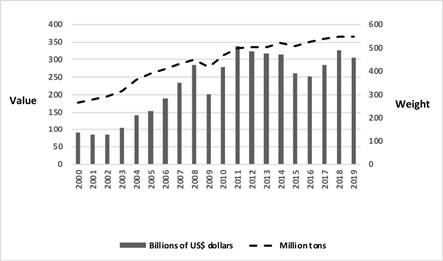
Source: Author’s elaboration with data from Chatham house (2019)
Graph N. 1: Trend of Global Exports Waste, Scraps and Residues from 2000 to 2019 (in value and weight)
The composition by commodities of global waste trade from the year 2000 up to 2019, based on the accumulated total of exports and measured in weight, has been led by the following top 5 categories: forestry and paper with 27,45%, metals with 27,01%, food industries and animal fodder with 26,70%, slag and ash with 9,16% and miscellaneous industrial with only 5.23%. The other 6 categories (plastics, glass, textiles, electronics, rubber and tires, and non-food animal products) account for the remaining 4,45%. (Chatham house, 2019)
Recent trends in Costa Rica´s exports of wastes
Despite its relatively small economy, territorial size, and population, since the 1980’s Costa Rica has adopted an export-led growth development model with an open economy. As its economy has become more globalized in the last twenty years, Costa Rica has not been an exception to the global trends in terms of the exporting of wastes.
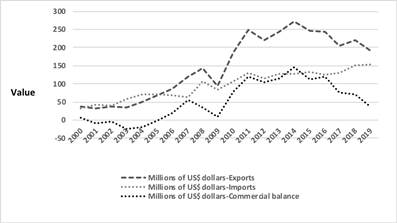
Source: Author’s elaboration with data from Chatham house (2019)
Graph N. 2: Costa Rica’s exports, imports, and commercial balance of waste, scraps, and residues from 2000 to 2019 (in value)
Costa Rica’s exports of waste increased 3.98 times from the year 2000 to 2019. In this period, there was a peak in exports in the year 2014, when exports reached $273.13. When comparing the years 2000 to 2014, these exports increased 6.09 times. Not only has Costa Rica experienced a positive trend in its growth for this type of exports, but it has also obtained promising results in its waste commercial balance. Out of the 19 years from which data is available in this type of trade, Costa Rica has obtained a positive balance in 14 years. Costa Rica’s exporters have earned a cumulative net surplus in this commercial balance of $1046.29 million (Chatham house, 2019).
The top 5 importers of Costa Rica’s exports for the year 2018 are the following: China with $67.3 million, United States with $28.1 million, Vietnam with $16 million, Thailand with $13.6 million, and Guatemala with $12.7 million. The top 5 countries from which Costa Rica imported waste in the year 2018 were: United States with $87.6 million, India with $10.3 million, Nicaragua with $5.2 million, Mexico with $4,5 million, and Guatemala with $4,2 million (Chatham house, 2019).
The composition of Costa Rica’s exports of wastes is analyzed based on the selection of data for the year 2018. This is the base year used for cross-sectional data that will be used in the Poisson pseudo-maximum-likelihood gravity model. In the year 2018, Costa Rica exported to 60 different countries located in different parts of the world. The composition of the most relevant commodities, in terms of percentage weight terms, exported by Costa Rica in the year 2018, is described as follows: metals 65,63%, forestry and paper 24,90%, food industries and animal fodder 4,07%, and plastics 2,22%, and miscellaneous industrial with only 1,40%. The other 6 categories (glass, textiles, electronics, rubber and tires, and non-food animal products, slag and ash) account for the remaining 1,78% (Chatham house, 2019).
As has been shown, the international trade of waste has become an important part of the Costa Rican economy, as an alternative not only to do business, but also to find a short-term answer as to what to do with its recyclable materials. Nonetheless, the determining factors that have propelled Costa Rica and its importing nations to participate in this type of bilateral commodities flow has not been addressed yet. Thus, it is imperative to approach this question by developing a gravity model as will be done in the following part of this paper.
A modified gravity model to explain Costa Rica’s trade of wastes, scraps, and residues.
The original gravity model (Tinbergen, 1962) was inspired analogically by the essay The Laws of Migration (Ravenstein, 1885) in which the author explains the way in which “currents” of migrants are attracted by the “absorption of centers of commerce and industry” (p. 198) though will “grow less with the distance proportionately to the native population” (p.198). Additionally, Isard and Peck (1954) empirically denoted the inverse relationship of distance in relation to “different modes of both domestic and international transport” (Van Bergeijk and Brakman, 2010, p. 4).
Since the first half of the 20th century, there was a significant discontent with the neglect that the classical trade theory had demonstrated in relation to the relevance of the economic size of trade partners as well as the distance between them, as determinants of trade flows. It was not until 1962 that Jan Tinbergen and a group of Dutch economists formulated the gravity model for the first time, both mathematically and empirically.
A gravity model can be used to “to determine the basic factors governing the volume of trade between any pair of countries” (Tinbergen, 1962, p. 262). Based on his initial proposal, Tinbergen states that the value of total exports from one country to another is determined by “preponderant” (Tinbergen, 1962, p. 263) explanatory variables which include the GDP of the exporting country, the GDP of the importing country, and the distance between the two countries.
According to Tinbergen (1962), the volume of trade from one country to another will depend on: i. the “economic size” of the exporting country: ii. the size of the importing “country’s market”; and iii. “the geographic distance between the two countries” (p. 263).
The original equation proposed by Tinbergen (1962) is stated below:
Eij = αo Yi α1 Yj α2 Dij α3
where,
Eij = exports of country i to country j. Yi = GDP of country i Yj = GDP of country j Dij = Distance between country i and country j.
The exponents α1, α2 and α3 indicate “that there is not necessarily direct proportionality between the explanatory variables (Yi, Yj, and Dij) and the variable to be explained (Eij)” (Tinbergen, 1962, p. 264). To a least-squares regression analysis, the original equation was rewritten in a logarithm form:
logEij = α1 logYi + α2 logYj+ α3 logDij + α0’, where α0’ = log α0.
This essay considers that it is especially important to include the original explanatory variables included in Tinbergen’s model (1962) in a modified version of the gravity model to understand the determinants of Costa Rica’s exports of waste. Costa Rica’s waste export flows to other nations are expected to be influenced positively by the economic size of the exporting country and the economic size of the waste importing trade partner, and which is also negatively influenced by the distance between them. In general, the expectation a prior is that these variables in the original model would behave in the same direction as proposed by Tinbergen (1962), and Kellenberg (2012) in the Poisson gravity model proposed in this paper.
However, this research paper uses the Poisson pseudo maximum likelihood from Silva and Tenreyro (2006) because of the problems found with Tinbergen’s log- linearized gravity model with heteroscedasticity, as well as how bilateral trade flows between countries i and j which values are very small “need to be omitted from the sample as a result of the logarithmic transformation” (Higashida and Managi, 2013, p. 262).
The Poisson pseudo maximum likelihood equation used in this paper is described as follows:
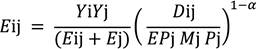
In this equation, Eij are the values of Costa Rica’s i waste exports to a set of importing countries j, Yi stands for Gross National Income (GNI instead of GDP) per capita for Costa Rica (2018 current US dollars), Yj is the GNI per capita waste importing countries, Ej is the value of flow of waste trade from the importing nations towards Costa Rica, Dij is the cost of transportation, as represented by the kilometers from Costa Rica´s capital city to the capital cities in importing countries, EPj is the environmental performance for the importing countries, Mj stands for the manufacturing sector as a percentage of GDP in the importing countries, and Pj are the importing countries populations. α is the elasticity of substitution among goods from varying source countries. All data for these variables is cross-sectional for the year 2018.
The original sample of 60 countries with its related data on imports on waste from Costa Rica, and other relevant explanatory variables, was originally extracted from Chatham house (2019) website, as well as the World Bank Group’s World Development indicators database (2020). However, the database used for the estimates with the modified Poisson gravity model ended up in 47 countries since there was some pieces of information missing or the value of waste exports were exceedingly small, in some cases.
In terms of the waste importing countries, a current 2018 US dollars Gross National Income (GNI) (in the model Yj) per capita is used and obtained from the World Development Indicator database (World Bank, 2020). In terms of Costa Rica’s per capita GNI (Yi in the model), it is the only exporter of waste to the waste importing countries. Therefore, it is omitted in this model, as it is one single observation. It is important to point out that this could affect the estimation results since there is no heterogeneity in one side of the bilateral trade.
As far as the value of the waste import flow towards Costa Rica (Ej in the model) is concerned, values of waste in thousands of US dollars are used based on the 2018 Chatham House (2019) database. According to Kellenberg (2012), values are usually proportional to weight. There is also an almost perfect positive correlation between value and weight. As Costa Rica increases its participation in the bilateral waste trade, then imports of waste towards Costa Rica would increase as the trading partners are also willing to send their recyclable wastes to Costa Rica. The expectation, a priori, is that the coefficient sign would be positive.
Using a similar argument, Costa Rica waste exports (Eij in the model) to the importing countries, is based in thousands of US dollars. This dollar value is equivalent to these exports’ weight as demonstrated by the high correlation among them. This is also extracted from the 2018 Chatham House (2019) database. The expectation, a priori, for the sign of the coefficient is ambivalent as Costa Rica could be very dependent on imported waste for certain industries such as recyclable metal, in which case the sign would be positive. On the other, however, it could have strict environmental regulations that prevent the entry of imported wastes; in which case, the sign would be negative.
Distance (Dij in the model) from one economic center to another, as used in Tinbergen’s (1962) traditional model, would use nautical miles. However, we have simplified this estimate using the distance in kilometers from the capital city of Costa Rica, San José, to the capital cities of the importing countries. This information is extracted from the Geodatos.com website. The expectation, a priori, is that the sign of the coefficient would be negative, as stated in Tinbergen’s model above.
Due to its uniqueness and singularity, trade of wastes needs to consider other additional explanatory variables to understand the causes that may trigger Costa Rica to export waste to other trading importing nations. After making an extensive review of the limited literature on this subject, a few additional factors will be discussed to determine its pertinence in being included in this modified Poisson gravity model.
In terms of population (Pj in the model) as a potential determinant of waste imports from Costa Rica to other nations, authors such as Higashida and Managi (2013), as well as Wendling, Z., Emerson, J., de Sherbinin, A., Esty, D. C., et al. (2020), use it as determining factor to explain why exports of this type of trade occur. According to Higashida and Managi (2013), the population size is a good representation of the market size. “The greater the market scale of an importing country, the more recyclable waste it imports”, and thus “will likely boost the demand for recyclable waste” (p. 254). The expectation, a priori, is that the population estimated coefficient will be positive.
The value added of the manufacturing sector as a percentage of GDP (Mj in the model) could also be an important determinant of waste imports from Costa Rica to other nations, according to authors such as Wendling, Z., Emerson, J., de Sherbinin, A., Esty, D. C., et al. (2020). They are the authors of the 2020 Environmental Performance Index (EPI). In general, they have stated the greater the manufacturing sector and the greater the economic growth in the importing country of waste, the greater the value of recyclable waste imported. As a country’s economy becomes more developed and, thus, its income increases and its economy becomes more industrialized with a greater need of achieving economies of scale in its processing and recycling plants, the pressures on the environment increase. Consequently, the country’s dependency on consuming its natural and material resources is increased, so it becomes more appealing to import recyclable waste to comply with the Sustainable Development Goals and achieve a circular economy. The expectation, a priori, is that the sign of the coefficient of the size of the manufacturing sector as a percentage of GDP in relation to the importing of waste will be positive.
The EPI report (Wendling, Z., Emerson, J., de Sherbinin, A., Esty, D. C., et al., 2020), has become an especially important data-driven indicator in terms of the environmental “health and ecosystem vitality”, as well as “the state of sustainability” (p. II) of countries around the world (EPj in the model). A series of Spearman correlation coefficients are presented in this report, in which the different degrees of association of this indicator are tested with other relevant variables, such as exports. In this regard, it is concluded that “there is a moderate and positive association between exports and the EPI” (p. 46). It is worth noting that this study does not focus on exports per se, but more specifically in Costa Rica’s exports of waste to other nations. Thus, this is an opportunity to enrich empirical testing since no similar research was found. Additionally, Kumar et al. (2019, p. 1052) emphasizes how competition among countries for mobile capital can constitute a risk towards environmental sustainability due to lax regulations, but also highlights how the transboundary investment made by multinational companies can promote clean technology and best practices. The expectation, a priori, in relation to the coefficient representing Costa Rica waste exports with the EPI of other nations is that there is a negative relationship. Many of the importing countries have a reasonable level of environmental regulations and policies in place, as well as a competitive advantage in recycling and reusing wastes being imported from Costa Rica. The EPI data was extracted from the Yale Center for Environmental Law & Policy website where the 2020 Environmental Performance Index is located. This is also assuming that the 2020 EPI correspond to the 2018 results as this report takes approximately two years to be ready for publication.
Results of the modified Poisson gravity model
Initially a multiple classical regression model was run with the same variables described in the previous section (without applying logarithms to any of the variables), and it resulted that the model was experiencing heteroscedasticity according to the Breusch Pagan/Cook-Weisberg test, and its R-squared was only 0.52. No multicollinearity was found. As a means of resolving this issue, the Poisson gravity model was applied then. The results are presented as follows:
| Pseudo log-likelihood | -97533.807 | |
|---|---|---|
| R-squared | .82695388 | |
| Dependent Variable | Eij | |
| Independent Variables | Z-values calculated | Coefficient sign |
| Yj | 2.48 (p-value :0.013, **) | Positive as expected |
| Ej | 1.93 (p-value :0.054, *) | Positive (ambivalent) |
| Dij | -1.17 (p-value :0.24) | n.a. |
| Pj | 2.03 (p-value :0.042, **) | Positive as expected |
| Mj | 2.77 (p-value :0.006, **) | Positive as expected |
| EPj | -2.82 (p-value :0.005, **) | Negative as expected |
Note: *: significant at 10% level; **: significant at 5% level; ***: significant at 1% level; n.a.: Not applicable.
As expected, this Poisson gravity model overcomes the weaknesses found in the classical linear regression model when applied to Tinbergen’s gravity model. The R-squared obtained a 0.82, and 4 of out of the six independent variables were statistically significant at 95%, and one was significant at 90% only, and Dij, did not turn to be statistically significant.
This Poisson gravity model was analyzed one more time, but excluding the only variable not statistically significant which was Dij. The overall results did not change significantly. The R- squared obtained was a robust 0.79. All independent variables remaining turned out to be statistically significant. 4 of out of the five independent variables were statistically significant at 95%, and only one was statistically significant at 1%.
Discussion of Results
-Yj is the current 2018 US dollars per capita GNI for the countries importing waste from Costa Rica. The expectation of a positive sign is fulfilled and is statistically significant at 95 percent. As the waste importing countries increase their per capita incomes, they can then increase the value and amount of recyclable waste that is imported in their countries. The ideal scenario is that this waste would be used as part of their local circular economy initiatives, and not deposit it in a landfill. This would also reduce the dependency of extraction of resources from the planet.
-Ej is the value of flow of waste trade from the importing nations towards Costa Rica. As expected, the sign of the coefficient resulted positive. Nonetheless, it does not achieve statistical significance at 95 percent, only at 90%. As Costa Rica increases its active bilateral waste trade flows with the waste trading partners, then it will continue to import the needed recyclable waste from abroad. An interesting question that arises is what the end use of these imported wastes in Costa Rica will be. Does Costa Rica have a competitive advantage in the recycling and reusing and reutilizing of these imported wastes?
-Dij is the distance between the capital city of Costa Rica and the capital cities of importing waste country. In this case, the expected negative value of the coefficient is obtained. However, it does not result in a statistically significant variable when analyzed in relation to the flow of waste from Costa Rica to these importing countries. The idea is that the greater the distance, the lower the flow of waste trade which would take place. As stated, it cannot considered as a determinant of waste trade for Costa Rica.
-Pj are the populations of the waste importing countries from Costa Rica. The coefficient calculated is positive as expected. It turns out to be a statistically significant relationship at 95 percent when analyzed in relation to the flow of waste trade between Costa Rica and the importing countries. As population increases, the need and consumption of recyclable waste increases. As countries adopt more and more circular economy initiatives, then the more essential that it becomes to apply sustainable and circular processes to reduce the current economic system’s dependency on the extraction of finite resources such as materials.
-Mj represents the waste importing countries´ manufacturing sector measured as a percentage of the value added to the economy. In this case, the coefficient sign is positive and statistically significant relationship at 95 percent, when analyzed in relation to the relation to the flow of waste trade between Costa Rica and the importing countries. As the manufacturing sector is a relevant player in the economic growth of the waste importing countries, this will cause the import of waste from Costa Rica to increase. The greater their manufacturing sector, the greater the need to import recyclable waste to supply the enterprises, and to apply more sustainable and circular methods for making products and services.
-EPj is the environmental performance that waste importing countries have achieved. The expectation of a negative sign in its coefficient is obtained, as well as a statistically significant relationship at 95 percent when analyzed in relation to the flow of waste trade between Costa Rica and the importing countries. As the countries achieve better and more sustainable environmental results, the greater their consciousness is in relation to whether they should allow the importing of recyclable wastes. The controversy arises as to whether the imported recyclable waste ends up in a landfill in the importing country, or whether it is reused or recycled into the making of a new product or service. The idea with waste exports is to maximize the competitive advantage of the international trading system, so that countries with comparative advantage in applying circular systems in their economies can do so in an efficient manner.
Conclusions
This study has determined what the most important determinants of Costa Rica´s waste trade flows are: the economic size of the importing country measured with per capita GNI, the size of the populations of the waste importing countries, the size of the manufacturing sector as value added in the importing countries, as well as the environmental performance of these waste importing countries. These independent variables were statistically significant at 95%. The other independent variables which were not robust enough to be considered influential in the determination of Costa Rica’s waste trade flows are: Costa Rica’s waste trade flow through waste imports from other nations as well as the distance between the capital city of Costa Rica and the capital cities of importing waste country. These independent variables were significant at only 90% or not statistically significant at all.
The application of a Poisson gravity model to explain the reasons why countries decide to participate in waste trade flows has demonstrated to be a robust tool to counterbalance the weaknesses found in Tinbergen’s traditional gravity model. However, the Poisson model used as reference in this study presents a limitation based on heterogeneity for only considering Costa Rica as the only waste exporting countries vis-à-vis the 47 waste importing countries.
Exporting the pollution problem from one country to another one is not the solution to achieve a global circular economy. The trading system, inserting itself into waste trade, represents an excellent opportunity to export from countries with a low comparative advantage in the recycling and reusing of these recyclable wastes, to those countries which have obtained a comparative advantage by pushing forward not only the ideas, but also the workings (via industrial and technical capacity to recycle imported waste materials and achieve economies of scale) of the circular economy towards a sustainable circular society. The opportunity is open for Costa Rica to create a greater value added in its exports of wastes, and improving its terms of trade, by inducing its local industries, universities, local governments, and local entrepreneurs, to become global examples in waste innovation and creativity, and thus transforming the local economy in an active player in the global circular economy.

