


 English (pdf)
 Article in xml format
 Article references
 Send this article by e-mail
 Cited by SciELO
  Similars in
SciELO
Similars in
SciELO  uBio
uBio 
 Permalink
1. Introduction
The construction and strengthening of societies resilient to disasters is proposed as the guiding framework for the current commitments to international cooperation. The challenge for countries and their institutions in this scenario, with the restructuring of prevention and response systems, must be oriented toward the myriad of factors that make up the problematic, that is, measures that address the set of factors that converge on situations of risk and vulnerability. The strategies that spearhead the national actions for DRR are expected to serve four fundamental objectives: a) reverse positive exposure trends, b) reduce vulnerability of population groups, c) mitigate potential impacts of threats, and d) create resilient societies.
Risk management, as defined by Marcano & Cartaya (2010), is a continuous process in which different actors, perspectives, and realities are involved, more than a tangible short-term product. It is a process from which there is agency by territorial, social, economic, and cultural knowledge in the contexts of threat and vulnerability.
Understanding risk is the fundamental basis for prevention and construction of resilience, just as local management is the raw material for actions at the national scale in issues of DRR. Nonetheless, the municipalities and local communities in Latin America generally lack specialized instruments in locating and understanding the problematic in its different manifestations. According to Reyna (2006), these difficulties may be addressed with the use and implementation of GIS for the collection, storage, administration, updating, and visualization of geo-referenced data.
As part of interdisciplinary research developed by specialists in the social, cartography, and programming fields interested in studying disasters, the SIESGO system is presented, a web and mobile application that shows in real time vulnerability and risk maps of the municipal zones based on surveys of the inhabitants using smart mobile devices.
The purpose of this paper is to present the methodology, structure, and criteria used by SIESGO, as well as the advantages of GIS integration to making evaluation tools for DRR. The SIESGO system allows for creating layers of information1 that are subjected to spatial analysis2 to produce new combined data about socioeconomic vulnerability, institutional capability, and social perception. The cartographic representation of these indices, interacting with the threat sources, allows for making integral risk maps that, in a novel way, incorporate subjective natural references. By implementing this solution, it is possible not only to determine the location of each one of the elements of the risk geo-system, but also to extract the possible relationships that are created between these elements through the overlap of layers of data. SIESGO is presented as an efficient and easy-to-use tool that configures the ideal way for decision-making and socialization of relevant information.
2. Background
The evolution in DRR discourse is a product of constant paradigm change that traces a clear line toward the systemic approach. Initially, assistance in the event of an emergency (UN, 1965) constituted the potential response to the risk materialization and disaster study concentrated on monitoring the phenomenon, the probability of loss, and the mitigation of effects -fields in which the technical and engineering focus had broad relevance-. The institutional and academic actors affiliated with the physicalist focus3 saw in prevention a utopian state regarding the apparent inevitability of the disaster. Nonetheless, the search for alternative perspectives to the hard science brought a series of conceptual advances that, subsequently, ended up separating and differentiating the threat from other factors like vulnerability, exposure, and social perception (Jerez-Ramírez, 2014).
This integral vision well received in Latin America academia -during the nineties- accentuated the importance of this research concerned with addressing not only the physical-material dimensions of these variables, but also the social dimensions, symbolic and significant. The concept of risk was reframed to, finally, be accepted as a social construction (García-Acosta, 2005; Jerez-Ramírez, 2014; Lavell et al., 2020) that depends both on the material nature of the environment and the knowledge that shapes the daily practice during disasters4.
The current international platform for DRR indicates the importance of this knowing-doing relationship. This document recognizes that comprehension of risk and socialization of information about it are priority actions for the configuration of resilient societies and the establishment of more effective responses. The Sendai Framework for Disaster Risk Reduction 2015-2030 (UN, 2015), in numeral 23, states that the policies and practices for disaster risk management must be based on a comprehension of disaster risk in all its dimensions of vulnerability, capacity, degree of exposure of people and assets, characteristics of threats and surrounding (...). To achieve this objective, it is fundamental to collect data to guide in the resolution of how, when, and where, areas in which computational systems have been of great utility.
The implementation of GIS also has marked a new path in the study of these socio-environmental problems. This tool facilitates interpretation, while it makes the product more complex, since it is possible to have a territorial analysis in light of several inputs, for example: the location and geospatial distribution of risk, the historical processes of urban planning and the development model. Nonetheless, the generation of information about these attributes at the local level continues to be insufficient, primarily due to the lack of methodological proposals that are specialized in more peculiar territorial contexts and in knowledge of the civilian population.
The information about social perception -information of a subjective, dynamic, and qualitative nature- gives an account of the society-surroundings relationship, thus allowing for identifying the areas of deficiency and opportunity in the diagnosis of capabilities, reason for which the last international cooperation agendas have highlighted socially-constructed visions as a fundamental element for DRR. Given this, the recent academic efforts, generally of an interdisciplinary character, aim toward developing integral instruments that take advantage of the different sources of information and incorporate new technologies for the analysis and systemization of this information, as is the case of the SIESGO solution.
3. Methodological support
The SIESGO system is defined as a web and mobile application that shows in real time digital maps of a locale’s vulnerability and risk zones. The databases are fed with statistical information and surveys applied to inhabitants through the use of smart mobile devices. Taking as a reference the international provisions and the methodology implemented from the CENAPRED, the SIESGO system incorporates a series of analytical procedures for cartographic study of disaster risk, considering the complexity of the topic. The principal objective of the CENAPRED methodology lies in identifying the social aspects and the geographic location of the population susceptible to suffering physical or property damage from exposure to a natural, socioenvironmental, and anthropogenic phenomenon (García et al., 2006). Given this, different indicators have been defined that, in sum, contribute elements to quantify aspects of an objective and subjective nature that are primarily associated to global vulnerability.
The concept of global vulnerability defined by Wilches-Chaux (1993), stresses the different manifestations of uncertainty of the social system -physical, cultural, economic, educational, institutional, technical, and ideological vulnerability-. Social vulnerability, of the global type, is related to the previous contexts of susceptibility that characterize a population structure and that, interacting in time and space with a threat, may trigger the materialization of the risk. Disasters, in turn, potentiate the above contexts of scarcity and lack of well-being. Threat, in contrast, is interpreted as “a dangerous phenomenon, substance, human activity, or condition” (UN, 2009, p. 5) with probability of impact on health, property, the natural and built environment, income, and the socioeconomic dynamic of a locale or region.
Vulnerability also can be defined as “the set of social and economic characteristics of the population that limits society’s development ability; in conjunction with its capability for prevention and response in front of a phenomenon and the population’s local perception of risk” (García et al., 2006, p. 75). So then, the degree of knowledge of risk and the actions developed individually and collectively from this information, are functional elements for the exposure-susceptibility diagnosis and for the development of efficient institutional strategies for prevention-protection. As a corollary, social perception and institutional capability also are part of the evaluation of vulnerabilities to disaster risk.
The CENAPRED methodology described by García et al. (2006) is used by SIESGO to identify the main sources of information and the methods for handling the data concerning socioeconomic vulnerability, institutional capability, and social prevention capability. The work is structured in three basic processes to build the indicators that quantify the aforementioned areas: the first measures the degree of population susceptibility with the socioeconomic census data; the second determines the management and response capability of the local government agencies in charge of the DRR; and the third estimates the degree of exposure perceived -recognizing the complexity of the variable- by the individuals that inhabit the study area. With regard to the first methodological part and following the focus on global vulnerability, five broad categories are evaluated regarding quality of life and development obtained from the population’s census fundamentals and complementary documents, which are: health, education, housing, employment, and population; those related with the institutional area -specifically integral management and civil protection- and cultural area are addressed in stage 2 and 3 under the categories of institutional capability and citizen perception, respectively.
For the calculation of vulnerability associated with socioeconomic conditions, the CENAPRED methodology uses 18 indicators -3 about health, 3 on education, 6 for housing, 3 for employment/income, and 3 for population- that may be classified in 5 ranks or levels of vulnerability, that is: very low (0.00), low (0.25), medium (0.50), high (0.75), and very high (1.00). In the case of SIESGO, each indicator is determined with an algorithm whose result may vary between 0 and 1, where 1 corresponds to the highest level of vulnerability and 0 to the lowest level, to later assign it to the value that is located on any one of the 5 qualitative ranges set by the CENAPRED guide (Table 1). The resultant value of each indicator is averaged for each of the 5 levels and the results by category are averaged to obtain the Socioeconomic Vulnerability Index (SEVI).
Table 1 Evaluation of the Socioeconomic Vulnerability Index (data from García et al., 2006).
| Category | Average of Categories | Range of Categories | Index Average | SEVI Range |
|---|---|---|---|---|
| Very low | ||||
| Low | ||||
| Health | Σ values of the indicators *3 | Medium | ||
| High | ||||
| Very high | ||||
| Very low | ||||
| Low | ||||
| Education | Σ values of the indicators *3 | Medium | ||
| High | ||||
| Very high | ||||
| Very low | very low, | |||
| Low | Σ values of the | low, | ||
| Housing | Σ values of the indicators *6 | Medium | categories *5 | medium, |
| High | high, | |||
| Very high | very high | |||
| Employment/ | Very low | |||
| Low | ||||
| Income | Σ values of the indicators *3 | Medium | ||
| High | ||||
| Very high | ||||
| Very low | ||||
| Low | ||||
| Population | Σ values of the indicators *3 | Medium | ||
| High | ||||
| Very high |
The second and third basic process, unlike the first stage, does not use statistical data. The databases, geographically referenced, are fed with information collected in the field from questionnaires previously downloaded on smart devices with the program M.App Enterprise. While the collection instruments store with respect to the CENAPRED methodology, the questions were modified and reorganized to give greater clarity, coherence, and logic to the sequence of questions.
The questionnaire directed to competent authorities seeks to understand, generally, the capability of local civil protection officials. The instrument is made up of 22 binary-response questions, assigning a value of 0 to Yes and 1 to No / I Don’t Know. The lowest values, that may reach up to 22, represent a greater capability of competent authorities and, consequently, a lower vulnerability. The index corresponding to this stage is determined through the average of the questionnaire’s results and their association to the range of vulnerability: very low (0.00), low (0.25), medium (0.50), high (0.75), and a very high (1.00). The result obtained corresponds to the second methodological value that in SIESGO is identified as Vulnerability Index associated to Institutional Capability (ICVI).
Questionnaire number two, corresponding to the third methodological part, is applied to a representative (95 % level of confidence) and geographically well distributed sample of the population. It is recommended that the participants of the sample be people older than 18 years who live in the study zone. For this variable, the instrument is made up of 28 binary-response reactants5, assigning a value similar to the above variable. The lowest values represent a greater local perception of the residents regarding disaster risk (threats, vulnerabilities, and exposure), and, consequently, a lesser vulnerability. It turns out to be recommendable for the application of the instruments to be guided by personnel who have experience with work in communities. Below, to determine the social-perception index, the results of each question are added up according to the value assigned and the average is calculated. This is the third and last value of the methodology identified in the application as Vulnerability Index associated to Local Perception (LPVI)
It is important to lay out that quantification of the Social Vulnerability Index (SVI), last objective of the methodology, is obtained by applying the following Equation 1:
SVI = (SEVI * .50) + (ICVI * .25) + (LPVI * .25) E. 1)
Where:
SVI = social vulnerability index at the disaster risk; SEVI = social and economic vulnerability index; ICVI = vulnerability index associated to institutional capability; LPVI = vulnerability index associated to local perception
According to the CENAPRED guide, the SEVI corresponds to a value of 50 % due to the fact that this index consolidates 5 elemental dimensions for evaluation of social-system capabilities. Regarding the ICVI and LPVI indices, the corresponding weight is 25 % for each one. Finally, the value that is obtained from applying these percentages represents the SVI that varies from 0 to 1, assigning to the lowest range of vulnerability the value 0 and to the highest range of social vulnerability the value 1 (Table 2). It is worth mentioning that incorporation of geo-referenced data, with tools like SIESGO, constitutes an advantage since it allows for establishing the SVI for each point of the space where the survey with inhabitants has been done, not only for the municipal global.
Table 2 Social Vulnerability Values (data from García et al., 2006).
| Social Vulnerability Values | Vulnerability |
|---|---|
| From 0 to 0.20 | Very low |
| From 0.21 to 0.40 | Low |
| From 0.41 to 0.60 | Medium |
| From 0.61 to 0.80 | High |
| More than 0.80 | Very high |
4. General architecture of the system
In order to facilitate the use of the methodology described in the above section and to geographically represent the results corresponding to each of the vulnerability indices evaluated, SIESGO is implemented in a GIS as a service (GaaS) in the Internet cloud that allows, in a practical and efficient manner, for collection and management of the location services in real time (Crosier, 2021). The architecture of the GIS services in the cloud is made up of three processes whose interaction allows for full administration of the information created by the work groups who, additionally, may share the results of each stage in real time. These processes are: a) data capture; b) processing; and c) information display and analysis (Figure 1).
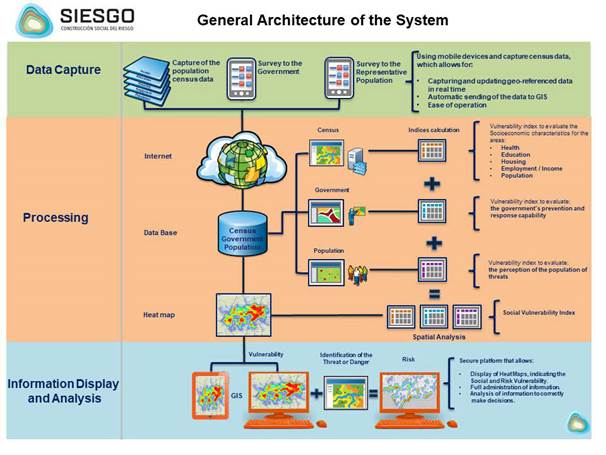
4.1. Data capture
For data capture, the SIESGO system uses a mobile application on Android (SIESGO MOBILE) that makes use of interfaces that allow for precise and ordered entry of the socioeconomic data (areas of health, education, housing, employment, and population), as well as the forms implemented for application of surveys on competent authorities and inhabitants of the zone.
The calculation of the SEVI is obtained from the official data that is entered by using interfaces that were designed for this purpose. For the ICVI and LPVI indices, the respective questionnaires were preloaded on a Trimble TDC100 rugged mobile computer with integrated cell phone, representing an ideal technology for capturing surveys and social studies in Mobile GIS projects (Morilla et al., 2020). In the case of the survey done to create the LPVI, the GPS integrated to the mobile computer is used to geo-reference the address of the surveyed person and associate the location with the photographic record that is attached as evidence. The capture flow is carried out following the methodology described above; the calculation of the SEVI, ICVI, and LPVI indices is executed immediately during data collection.
It is important to state that the size of the representative capture sample is determined considering the population older than 18 years, a confidence level of 95 % and a margin of error of 5 %. The total obtained is distributed equitably in each one of the four quadrants into which the territory to be studied is divided. With the above, a good distribution of the points entered is assured and, in turn, generation of a continuous social vulnerability map that does not plot information gaps.
4.2 Processing
The SIESGO system carries out the statistical and field data processing in the cloud to finally obtain the social vulnerability index. Geographically, the SEVI and ICVI create a polygon-type layer that coincides with the municipal boundary -preloaded- to which the value resulting from the methodological application is assigned, with the associated databases; this means that the vulnerability indices obtained from the socioeconomic and institutional capability data represent the municipal global. With regard to the LPVI, this is generated as a layer of points that indicates the geographic location of the population surveyed, consequently, the number of points is determined from the selected sample according to the pre-established criteria. As the system is fed with geo-referenced questionnaires and photographic files, the data may be displayed and consulted, in real time6, by the managers of the project.
Automatically and as the point layer is being updated, a spatial analysis process is carried out from the intersection of vector layers: among the polygons of the layers that contain the calculus of the SEVI and ICVI indices, with the layer of points corresponding to the LPVI. The intersection of polygons and points creates a point-type layer called the Social Vulnerability Index (SVI), which contains the value corresponding to the algorithm according to the methodology explained and the values of the indices that gave rise to it. The GaaS technology applied through the M.App tool Hexagon Enterprise offers the possibility of doing the calculation automatically and efficiently each time the surveys from the inhabitants are received by the system in the cloud.
4.3 Display and analysis
Once the SVI has been calculated for each geo-referenced point, a heat map is created with the application SIESGO WEB, using a color ramp that goes from red to green, where red represents a very high social vulnerability and green represents very low. A heat map is a graphic representation of data where the individual values, found in a database, are represented with heat ramps in order to facilitate identification of the zones where there is greater concentration of high or low values, as considered (Castaño, 2012).
The SIESGO application runs under the concept of GaaS and uses all the advantages of this technology in terms of storage, capacity, processing speed and available computing infrastructure to work efficiently, the visualization and analysis of the GIS data (Crosier, 2021). In this sense, SIESGO WEB allows for consulting the information created from all the indices, displaying it geographically on vector and raster-type base maps, as well as creating statistical reports. Complementarily, additional layers of geographic data (hospitals, schools, public buildings, urban infrastructure) that make spatial analysis of the information more complete may be added, if they are available, and in this way allows the possibility of responding to questionnaires like, for example: how many hospitals and schools are located in the zones of the greatest social vulnerability? What public buildings in the zone may serve as temporary shelters in the event of an emergency? What vulnerable population (children younger than 15 years and adults older than 65 years) live in these zones? Etc. Also these additional layers of geographic information may be a product of specialized studies that determine the threats present in the work area (floods, landslides, volcanic eruptions, fault lines, anthropic dangers, etc.), layers that when combined with the social vulnerability information may allow for creating, finally, an integral disaster risk map.
5. Conclusions
The contributions from use of the SIESGO are multiple. It is a tool that allows for automatic calculation of the Social Vulnerability Index (SVI), integrating in addition the traditional socioeconomic areas, data on perception of the population’s risk from forms downloaded on mobile devices that facilitate capture, storage, and sending of the information. Simultaneously, it allows for evaluation and integration to the SVI of the institutional capabilities related to prevention and handling of disasters at the municipal level. Then, the product generated from this procedure corresponds to the geo-referenced graphic representation of the vulnerability and social risk conditions of the study area.
It is worth summarizing in the following points the principal characteristics and, therefore, benefits offered by implementation of this system. First, SIESGO allows for characterization of vulnerability and social risk by zones within the municipality, each one of them according to their calculated intensity value (very low, low, medium, high, very high), while traditional systems only handle one data point for the entire territorial entity. This form provides greater useful information for development of integral strategies. Second, the algorithms implemented consider the fundamental variables associated with study of vulnerability and risk, therefore the indices generated reflect with precision the contexts of exposure and social susceptibility. Third, the performance achieved with the SIESGO system, based on GaaS technology, allows for using the results practically in real time, with which efficiency is improved in decision-making by competent authorities. Finally, economic investment for implementation and execution of the system is based exclusively on rental for an appropriate period and purchase of mobile computers (optional), which minimizes the expense municipalities may have.
6. Ethics and conflict of interest
The authors declare having fulfilled all relevant legal and ethical requirements during the study, as well as during the preparation of the manuscript. They also declare that there are no conflicts of interest of any nature, that all financial sources are fully and clearly mentioned in the acknowledgments section, and that they fully agree with the final edited version of the article.

