


 Inglês (pdf)
 Artigo em XML
 Referências do artigo
 Enviar este artigo por email
 Citado por SciELO
  Similares em
SciELO
Similares em
SciELO 
 Permalink
Introduction
Locus of Control (LOC) is a variable which is frequently evaluated in psychology and education owing to the important role it plays in different contexts (Cheng, Cheung, Chio & Chan, 2012; Muñiz, Suárez-Álvarez, Pedrosa, Fonseca-Pedrero, & García-Cueto, 2014; Severino et al. 2011; Aiello, Cascio, Ficarra & Messina, 2011; Suárez-Álvarez, Campillo-Álvarez, Fonseca-Pedrero, García-Cueto & Muñiz, 2013; Urbig & Monsen, 2012). There is no unanimous agreement on how many dimensions make up the factorial structure of LOC (Ferrando, Demestre, Anguiano-Carrasco & Chico, 2011; Kormanik & Rocco, 2009; Levenson, 1981; Niles, 1981; Paulhus & Van Selst, 1990; Rotter, 1966, 1975), although the most commonly accepted theoretical models tend to reject the unidimensional structure (Levenson, 1981; Paulhus & Van Selst, 1990; SuárezÁlvarez, Pedrosa, García-Cueto & Muñiz, in press; Thompson & Prendergast, 2013). In other words, the locus of control is not a continuum between two poles as originally proposed (Rotter 1966); a person may simultaneously have an external attributional style and an internal attributional style (Suárez-Álvarez et al., in press). Therefore it is reasonable to think that the cause of a behaviour may be attributed to what one does (internal LOC), while at the same time, accepting that the situation may also be influenced by events outside one’s control (external LOC).
In a recent meta-analysis, Cheng, Cheung, Chio and Chan (2012) found that external LOC was not related to anxiety and depression in the same way in all cultures. That is, the significance of LOC is cultural and, hence, different depending on the population. The roots of these differences may be found in the cultural values in each society (Hofstede, 2001; Triandis & Suh, 2002). For example, individualistic societies, such as those in the West, tend to place the responsibility on an individual for his or her actions, whereas collectivist societies, like those in Asia are generally more sensitive to external influences (Cheng et al., 2012). This might explain the fact that differences between Europeans and Americans are small whereas when comparing Americans and Asians they are much bigger (Yamaguchi, Gelfand, Ohashi & Zemba, 2005).
Studying LOC across cultures means being able to ensure equivalence when measuring the construct (i.e. measurement invariance). Hence, if one wants to make multi-group comparisons, one has to demonstrate that the measurement instruments work in exactly the same way and that the construct under evaluation has both the same theoretical structure and psychological implications for the groups of interest (Byrne, 2008). In other words, it would not be acceptable to compare scores of people belonging to two cultural groups in a construct that did not have the same significance in both cultures. Neither would it make sense to interpret the results of a test if its application in two contexts is associated with different measurement errors (Elosua, 2005). Both questions are contingent on checking factorial invariance (Byrne, 2008; Dimitrov, 2010; Elosua & Muñiz, 2010; Supple, Su, Plunkett, Peterson & Bush, 2012; Zecca et al., 2012). Van de Vijver and Leung (1997) proposed three forms of factorial equivalence: configural invariance, in which the underlying psychological process is the same in the different groups since all the factors are shaped by the same items; metric invariance, in which the scaling metrics are the same; and scalar invariance, in which the origin of the scale is also the same for the different groups.
There is no unanimous agreement on the dimensionality of LOC, neither does there seem to exist any agreement on its measurement equivalence across cultures. The results are highly inconsistent. When Rotter’s unidimensional scale is used, the results show a different factorial structure for Africans, Europeans and Indians (Furnham & Henry, 1980). Smith, Trompenaars and Dugan (1995) headed a transcultural investigation in 43 countries using Rotter’s scale and identified three dimensions which were relatively close to those proposed by Levenson (1981): one dimension of internality and two of externality (powerful others and chance). Other authors have also confirmed Levenson’s multidimensional structure between Scots, Spanish and Irish (Bonetti et al., 2001), and between US and Indian groups (Ghorpade, Hattrup & Lackritz, 1999). On the other hand, some researchers reject the equivalence of this multidimensional structure between Caucasian Americans, Filipino Americans and Latino Americans (Malcarne, Fernández & Flores, 2005), and across young, middle-age, and elderly age groups (Shewchuk, Foelker, Camp & Blanchard-Fields, 1992). Rossier, Dahourou and McCrae (2005) tested whether the bidimensional structure (internal and external LOC) was a better fit than the multidimensional one between Switzerland and Burkina Faso.
It is not clear if the discrepancies in these results are due to measurement problems or to cultural variations in LOC (Rossier et al., 2005). It seems as though one possible explanation might be found in the process of adapting the measuring instruments, because the process of translating an instrument from one language into another involves much more than mere back-translation (Hambleton, Merenda & Spielberger, 2005). In addition, it must be taken into account that the main interest in transcultural studies is usually the comparison of scores according to the home country and therefore an adequate translation and adaptation of the instrument is necessary. Any bias in the translation or adaptation (Van de Vijver & Hambleton, 1996), will directly affect the instrument’s equivalence metrics and, therefore, the comparison of scores between groups (Byrne, 2008; Dimitrov, 2010).
The goal of this research was to add new evidence of validity in relation to the factorial invariance of LOC. More specifically, the research looked at the cross-cultural equivalence of the bidimensional structure of LOC (i.e. internal LOC and external LOC). In order to do this, a progressive evaluation of the factorial invariance between Spanish, Chilean and British groups was carried out using structural equation modelling (SEM) within the framework of a confirmatory factor analysis (CFA) model for ordered-categorical data. Once the cross-cultural equivalence of the measuring instrument was confirmed, a transcultural study of LOC was carried out according to home country.
Method
Participants
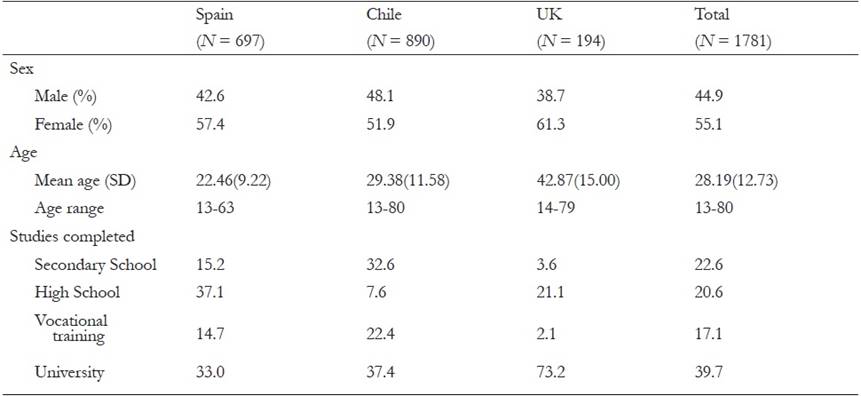
The sample was composed by 1781 participants of whom 39.14% were Spanish, 49.97% Chilean and 10.89% English (United Kingdom). The mean age of the total sample was 28.19 with a Standard Deviation of 12.73. The youngest participant was 13 and the oldest 80. More than half of the sample was female. In terms of educational attainment, 22.6% had basic secondaryschool education, 20.6% had completed high school (A-Level), 17.1% had vocational training, and 39.6% were graduates. Descriptive statistics according to nationality are given in Table 1.
Instruments
Locus of Control Scale. In order to evaluate LOC, a scale composed of 23 items with a Likert-type 5 point scale was applied (1 = completely disagree, to 5 = completely agree; Suárez-Álvarez et al., in press). Of the total, 10 items evaluate internal LOC and 13 evaluate external LOC. This instrument was chosen for three fundamental reasons: a) it offers appropriate psychometric properties (αinternal = .87, αexternal = .85; CFI = .90; RMSEA = .04; χ2 /df = 1.58; validity evidence based on relations to other variables; Suárez-Álvarez et al., in press); b) the Likert scale overcomes the limitations of forced-choice questionnaires (Ferrando et al., 2011) and dichotomous scales (Watters, Thomas & Streiner, 1990) and in addition, the five categories of response optimise the psychometric properties of the scales (Lozano, García-Cueto & Muñiz, 2008); c) the test makes no reference to any specific area and is therefore able to be applied independently of any contexts of application such as educational, organisational or clinical, in such a way as to eliminate this form of contextual specificity which can make the comparison of results difficult (Wang, Bowling & Eschleman, 2010). The data from the samples used in this work are presented in the results section.(Table 1.)
The validation of this instrument was carried out in the Spanish population, hence it has been translated to British English using the backtranslation method following international directives for translation and adaptation of tests (Hambleton, Merenda, & Spielberger, 2005; Muñiz & Bartram, 2007; Muñiz, Elosua, & Hambleton, 2013). Firstly, an independent translation of the test was obtained from an experienced native translator. Once this translation was done, all the items were checked by a group of experts who produced a first draft of the test by consensus. Following the production of this first draft in Spanish, a different experienced translator produced a back-translation into English. Then, a group of experts with experience in translating psychometric tests evaluated the level of semantic correspondence between the original version of the test and the back-translation.
Procedure
The questionnaire was applied using paperand-pencil (n = 399) and web online answer format (n = 1382). The measurement equivalent across the form of application (paper-andpencil or web-based) was previously confirmed (Suárez-Álvarez et al., in press). Participants were informed that their responses were confidential and anonymous, and participation was totally voluntary. The participants did not receive any type of compensation for their participation. The Ethics Committee of the Faculty of Psychology in the University of Oviedo gave their approval for this research to be carried out.
Data analysis
Firstly, an analysis of the items was carried out separately for internal LOC and external LOC. This was done by calculating the discrimination index for each dimension. Then, the ordinal reliability coefficient was calculated for Likerttype scales (Elosua & Zumbo, 2008). Factorial invariance between the groups was analysed using multigroup confirmatory factor analysis (MG-CFA) for ordered-categorical data within the framework of structural equation modeling (Byrne, 2008; Dimitrov, 2010). Firstly, a check was made that the proposed structure (which items measure which feature) initially suited each group separately (i.e. configural invariance). A Single Group CFA (Abad, Olea, Ponsoda & García, 2011; Muthén & Muthén, 2010) was fit to each group.
Following that, several nested models of MGCFA were performed to study the factor loadings invariance (i.e. Model 1), thresholds invariance (i.e. Model 2), and error variances and factor variances are equal across groups (i.e. Model 3), according to the models proposed by Muthén and Asparouhov (2002), and Muthén and Muthén (2010). A robust weighted least squares estimator (WLSMV) was used, indicated for categorically ordered data (Elosua, 2010; Koh & Zumbo, 2008; Muthén & Asparouhov, 2002).
The following criteria were used for the progressive evaluation of factorial invariance: chisquare differences using DIFFTEST correction (Muthén & Muthén, 2010), the difference between the values of Bentler’s comparative fit index (CFI; Cheung & Rensvold, 2002), a comparison of confidence intervals of the Root Mean Square Error of Approximation (RMSEA; Byrne, 2008; Elosua & Muñiz, 2010). Finally, the ShapiroWilk test was used to study normality (Pedrosa, Juarros-Basterretxea, Robles-Fernández, Basteiro y García-Cueto, 2015) and the Kruskal-Wallis test was used to study transcultural differences. For the non-parametric multiple comparisons, Gibbons’ (1993) proposed formula based on the Bonferroni correction was used. The estimation of effect size for non-parametric tests was done using Probability of Superiority (PS;Grissom & Kim, 2011).
Results
Preliminary Analysis
First of all, the items of each dimension with discrimination indices below .25 were removed (Muñiz, Fidalgo, García-Cueto, Martínez & Moreno, 2005). Using this criterion led to the elimination of item 7 - To be successful it is necessary to have good contacts-. Once this item had been eliminated from the test, the discrimination indices for the external locus of control sub-scale ranged from .31-.54 (Spain), .31-.61 (Chile), and .33-.63 (UK). For the internal locus of control sub-scale the discrimination indices were between .26 and .61 (Spain), between .47 and .72 (Chile), and between .43 and .82 (UK). On the other hand, the estimation of the reliability coefficient for ordinal data via Cronbach’s alpha gave acceptably consistent values from the groups both for internal LOC (αSpain = .81; αChile = .96; αUK = .93) and external LOC (αSpain = .82; αChile = .93; αUK = .88).
Configural Invariance
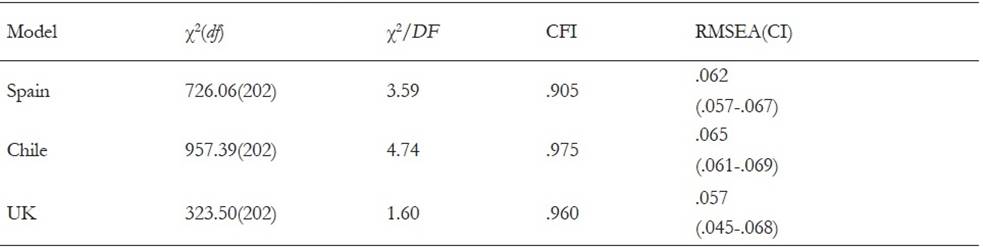
Table 2 shows the CFA fi t indices done in each group (Single CFA). The value of χ2/df is lower than 5, the CFI is larger than .90, and the RMSEA is less than .08.
Progressive evaluation of factorial invariance
The progressive evaluation of factorial invariance starts with configural invariance as a base model (Table 2, Table 3)
Table 3 Progressive factorial invariance analysis
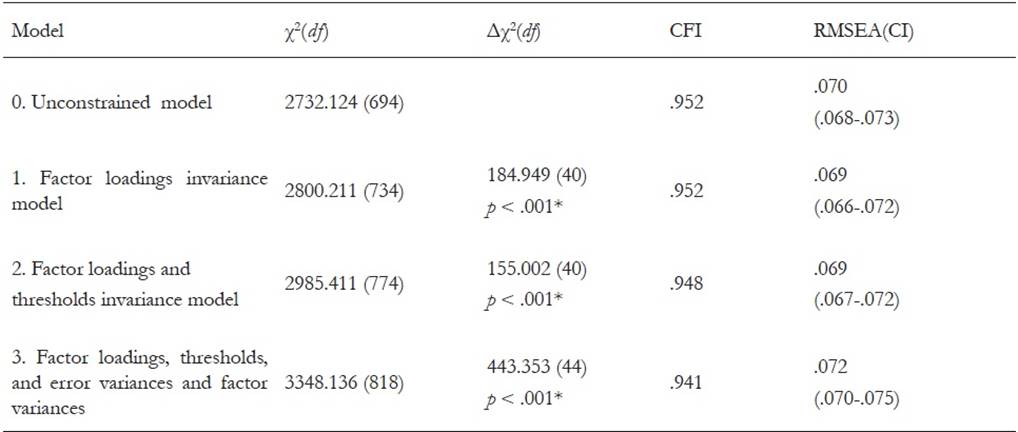
Note. χ2 = chi-square fit statistic under robust weighted least square estimation; df = degrees of freedom; Δχ2 = DIFFTEST for chi-square difference; CFI = comparative fit index; RMSEA = root mean square error of approximation; CI = confidence. *Factorial invariance would be rejected.
(Model 0; Unconstrained multi-group model). As can be seen in Table 3, according to the global fi t indices, it seems sensible to accept the equivalence of the base model between the groups.
Next, an additional model is used in which metric invariance is assumed (Model 1; Factor loadings invariance). In order to be able to accept this second model the χ2 difference between the two models (Model 0 - Model 1) must not be statistically significant (Muthén & Muthén, 2010; Satorra & Bentler, 2001). In this case (Table 3), the χ2 difference between the models is statistically significant (p < .001). Nonetheless, various authors (Byrne, 2008; Cheung & Rensvold, 2002) have argued that χ2 is an impractical and unrealistic basis for evidence of equivalence. For this reason multiple decision criteria were used: the difference between the CFIs of the two models is less than .01 (CFImod0-mod1 = .0001) and there were no statistically significant differences (CI = 90%) in the RMSEA of both models. According to these criteria, it seems sensible to accept the hypothesis that factor loadings are equal across groups.
The next nested model (Model 2; Factor loading and thresholds invariance) looks at invariance in measurement structures, and estimates the threshold for each indicator. For this reason, the model uses thresholds values as fixed parameters. It should be noted that thresholds are estimated for categorical indicators instead of intercepts which are for continuous indicators (Elosua, 2010; Koh & Zumbo, 2008; Muthén & Asparouhov, 2002). As can be seen in Table 3, there are no statistically significant differences (CI = 90%) between the RMSEA of both models (Model 2 - Model 1) and the difference between the Bentler comparative indices is lower .01 (CFImod1-mod2 = .004). According to these criteria Factor loadings and thresholds are invariant across groups.
Multiple group analysis can be done for categorical variables as long as thresholds and scale factors are included in the model. The scale factors consider possible differences in variances across groups. Hence, in the next step the scale factors are fi xed to be equal across groups (Model 3). It implies that factor loadings, factor variances and the residual variances are invariant across groups. Therefore, holding scale factors equal across groups has a strong implication (Muthén & Muthén, 2010). As observed in Table 3, this model has an acceptable fi t: the difference between the CFIs of the two models is lower than .01 (CFImod2-mod3 = .007), and there are no statistically signifi cant differences (CI = 90%) between the RMSEA of both models.
Study of cross-cultural differences
The Shapiro-Wilk test for the study of normality was statistically significant (p< .001) for both subscales, so the Kruskal-Wallis test was used for the study of the differences as a function of nationality. As can be seen in Table 4, there are statistically significant differences (p < .05) in both subscales by nationality between groups. Furthermore, a posteriori tests (Gibbons, 1993) showed that there were statistically significant differences (p< .05) between Spain and the others groups, but not between UK and Chile (p> .05). Pairwise comparison shows that participants from Spain scored higher in internal LOC than British (p< .001; PS = .39), and Chilean (p = .003; PS = .45). On the contrary, the Spanish scored lower for external LOC than British (p = .001; PS = .42), and Chilean (p = .015; PS = .46). Nevertheless, it must be borne in mind that the effect sizes in all pairwise comparisons were not high enough to consider relevant or large the differences found (PS< .50).
Discussion and conclusions
The objective of this research was to add new evidence of cross-cultural validity in relation to factorial invariance of LOC. Cross-cultural equivalence of the instrument was carried out following the steps established by Byrne (2008): a) translation and adaptation of a test for a British population to evaluate LOC (Oviedo Locus of Control Scale; Suárez-Álvarez et al., in press) using the back-translation method and following international directives for the translation and adaptation of psychometric instruments (Hambleton, Merenda, & Spielberger, 2005; Muñiz & Bartram, 2007; Muñiz et al., 2013); b) checking that the original factorial structure of the instrument is the same in the new versions and c) checking the equivalence of the changes across groups.
Firstly, regarding the translation and adaptation of the instrument, one item was found to have low discriminative power in the British population (To be successful it is necessary to have good contacts). However, this item had a value of .31 in the the Spanish and .35 in the Chilean sample. This suggests that the lack of discriminative power for the British could be due to a problem with the translation (Muñiz et al., 2013). Spanish speakers interpret this item in a way which clearly corresponds to an external attributional style; it seems reasonable to think that the British do not consider having “good contacts” as an external or chance event, but instead more as a consequence of personal merit. This fact highlights the importance and complexity of adapting instruments to other cultures (Hambleton, Merenda, & Spielberger, 2005). On the other hand, the reliability coefficients were acceptable in all groups for both the internal LOC (αSpain = .81; αChile= .96; αUK = .93) and external LOC (αSpain = .82; αChile = .93; αUK = .88). Furthermore, these results reasonably approximate those obtained in the original test (αinternal = .87; αexternal = .85).(Table 4.)
Table 4 Comparison of rank means with Kruskal-Wallis Test of each subscale as a function of nationality
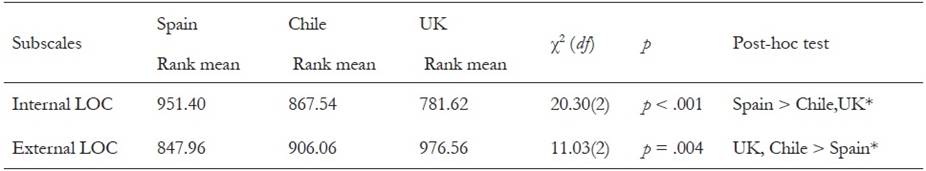
Note. χ2 = chi-square test; df = degrees of freedom.*The differences were statistically significant (p < .05) between groups.
Secondly, the configural invariance of the instrument was confirmed in all three groups. Hence it is reasonable to conclude that the bidimensional structure is confirmed in the Spanish, Chilean and British populations. Hence it can be concluded that the original factorial structure of the instrument is the same in the new versions.
Thirdly, a strong measurement invariance assumption was confirmed by the progressive factorial invariance analysis (Table 3). This means that not only factor loadings and thresholds are invariant across Spain, Chile, and United Kingdom, if not that error variances and factor variances are invariant too. This implies that similar levels of precision are performed when the construct is measured across these groups.
Finally, there were statistically significant differences between the nationalities in both subscales (p < .001). As can be seen in Table 4, the British and Chileans had the highest score in external LOC and the lowest in internal LOC, while this was the inverse in the case of the Spanish. These results coincide with the general tendency to observe differences in LOC according to nationality (Cheng et al., 2012; Malcarne, Fernández & Flores, 2005; Rossier, Dahourou, & McCrae, 2005; Yamaguchi, Gelfand, Ohashi & Zemba, 2005). On the other hand, it seems reasonable that, nowadays, people from changing economies such as Spain tend to make internal attributions to a greater extent than those from more well off countries such as Britain. The reason is that people might be expected to attribute the cause of change to what one can do. On the contrary, in countries with a social welfare system and a better economy one would expect that the inhabitants would tend to trust in community or welfare systems for support. Furthermore, the differences between Spanish and Chileans were smaller in both constructs than when they were compared with British. Interestingly, Chile and Spain have similar scores for power distance, uncertainty avoidance, and individualism (Hofstede, 2001). Regardless, the effect size was considerably low implying that the differences found are not relevant. In sum, the differences found must be taken as a tendency, and if it wants to support crosscultural differences, more empirical evidence should be provided.
In summary, the progressive evaluation of factorial invariance allows us to confirm a strong measurement invariance assumption. This provides evidence that the items were measured with the same precision in each group, so the group differences on any item are due only to group differences on the common factors (Dimitrov, 2010). These results add new evidence for the theses that a bidimensional structure represents the most realistic form of LOC in cross-cultural studies (Rossier et al., 2005).
The following limitations must be borne in mind when interpreting these results. Firstly, it would be useful to increase the sample size to improve the representativeness of the data. Secondly, it would be interesting to have convergent measures with LOC at transcultural level to improve the evidence of validity. Lastly, all the data were collected via self-reporting methods; in the future, it would be useful to administer other measuring instruments such as interviews or situational tests.

