


 Espanhol (pdf)
 Artigo em XML
 Referências do artigo
 Enviar este artigo por email
 Citado por SciELO
  Similares em
SciELO
Similares em
SciELO 
 Permalink
Introduction
On February 24, 2022, Russia offi cially decided to invade Ukraine (Mbah & Wasum, 2022). The conflict between the two countries began when Russia annexed the Crimea region in 2014. However, it was not until Russia officially decided to invade the Ukrainian territory that the world was put in check. As happens in these situations, the amount of information transmitted through communication channels increased. The Internet has made digital media one of the most widely used today (Mota & Cilento, 2020). Twitter has become one of the most popular platforms for communicating, sharing information, and expressing opinions, with millions of users worldwide interact ing with each other every second.
Given the popularity of Twitter and the relative ease of accessing its data, several studies have addressed areas related to this social media platform. One of the most popular areas is sentiment analysis. This area consists of analyzing and determining the emotions behind a text concerning some specific topic or field (Khun & Thant, 2019). Organizations widely use it to obtain information about people to understand better their sentiment or position regarding, for example, a product or service.
The classification of emotions is a widely studied and debated field, as there are different approaches to it (Imran, Daudpota, Kastrati, & Batra, 2020). The most basic classification categorized emotions into three types: positive, negative, and neutral. On the other hand, Tomkins (Tomkins, 1962), proposed a classification of eight categories for emotions: fear, disgust, shame, surprise, interest, joy, rage, and anguish. Likewise, Ekman (Ekman, 1992) advanced a classification of six categories for emotions: anger, disgust, fear, joy, sadness, and surprise. Other proposals classify emotions based on different perspectives.
Among the approaches used for sentiment analysis, Machine Learning (ML) and Deep Learning (DL), both subareas of artificial intelligence, stand out. DL techniques are also the most extensively employed thanks to their excellent performance. Natural Language Processing (NLP) is the subfield of DL that addresses human language tasks (Zhang & Lu, 2021). NLP has evolved models from recurrent neural networks RNN) to modern architectures based on attentional mechanisms. These attentional mechanisms capture the full context of sentences and allow for better inference, unlike RNNs, which suffer from lack of memory Janiesch, Zschech, & Heinrich, 2021). Two of the best-known models for NLP tasks are BERT and RoBERTa.
In this paper, a pre-trained network, specifically DistilRoBERTa, was employed to identify sentiments from a dataset of tweets related to the Russia-Ukraine war conflict. Seven emotions were under study: anger, disgust, fear, joy, neutral, sadness, and surprise. This aimed to understand people's sentiments and reactions to the armed conflict. Likewise, bar chart, line chart, and wordcloud techniques were used to visualize the results.
Methodology
Dataset Description
The corpus used for this study was the 65-day Russia-Ukraine war tweets dataset, which is available for download on Kaggle (https://www.kaggle.com/datasets/foklacu/ ukraine-war-tweets-dataset-65-days). It collects tweets related to the Russia-Ukraine conflict from January 1, 2022, to March 3, 2022. The author collected a maximum of 5000 tweets per day using the following keywords: 'ukraine war,' 'ukraine troops,' 'ukraine border,' 'ukraine NATO,' 'StandwithUkraine,' 'russian troops,' 'russian border ukraine,' and 'russia invades.' The dataset was divided into different CSV files, one for each keyword, and had a total weight of 3.78 GB.
Filtering
In this step, both English and Russian tweets were filtered for analysis. This aimed to compare the similarities and differences of analyzing each group of tweets and understand better the conflict's sentiment.
Filtering English Tweets. In this step, the tweets were filtered to obtain only those written in English by using the 'lang' column, which refers to the tweet's language. All entries with 'en' (English) value in the 'lang' column were selected. It is worth mentioning that since the resulting corpus of tweets in English was considerable, a random sample of 50% was taken from this subset for its analysis.
Filtering Russian Tweets. Similar to the previous step, the tweets were also filtered to include only those written in Russian by using the 'ru' (Russian) value in the 'lang' column again.
Preprocessing
Duplicate Removal. After obtaining only English and Russian tweets, the next step involved removing repeated tweets in each subset. Duplicate tweets were present due to users' retweeting posts, resulting in redundancy within the dataset. The drop_ duplicates() function provided by pandas was used to remove this redundancy.
Removing Mentions, URLs, and Stop Words. Some elements of the tweets were not pertinent for the analysis. Removing these depended on the nature of the dataset and the problem addressed (Pota, Ventura, Fujita, & Esposito, 2021; Jianqiang & Xiaolin, 2017). In this case, mentions, URLs, and stop words were identified as elements that did not provide relevant information. These elements could lead to classification errors, as they could bias the interpretation of the text by the model. Therefore, they needed to be subjected to data cleaning (Jianqiang & Xiaolin, 2017). Regular expression-based substitution was used to remove mentions and URLs. The NLTK Python library was employed for stop words. Hashtags were retained as they provided relevant information and helped better understanding of each tweet's sentiment. Table 1 shows examples of the tweets from each subset before and after preprocessing at this stage.
Table 1 Comparison of tweets before and after cleaning.
| Original tweet | After preprocessing |
|---|---|
| I am worried about Rusia might invade us so citizens should be given guns to protect our country. https://t.co/uNINBjz1Aa | I am worried about Russia might invade us so citizens should be given guns to protect our country |
| На границе Молдавии и Украины выстроилась огромная очередь из автомобилей. @ RT_russian https://t.co/EvLLSnX1BJ | На границе Молдавии и Украины выстроилась огромная очередь из автомобилей |
Note. This table and its contents were made by the authors of this work and its authorship corresponds to them.
Tokenization. The final step of preprocessing was tokenization. This is nothing more than preparing the inputs to apply the model, dividing each tweet into substrings, also called tokens. This was done using the AutoTokenizer method of the transformers' library provided by Hugging Face for each subset.
Sentiment Classification
English Tweets. The English sentiment classification procedure utilized DistilRoBERTa, a pre-trained natural language processing model programmed in Python. The model and its documentation are available on the Hugging Face website (https:// huggingface.co/j-hartmann/emotion-english-distilroberta-base). As the name suggests, it is a distilled and a smaller version of the RoBERTa model. Some advantages of smaller models are less weight, less complexity, and less training time. Specifically, DistilRoBERTa requires approximately four times less training time and is approximately twice as fast in prediction as the parent model (Sanh, Debut, Chaumond, & Wolf, 2019).
The model consists of 6 layers, with 82 million parameters, 39 million fewer parameters than the large model (Sanh, Debut, Chaumond, & Wolf, 2019). It can classify the emotions of English tweets within seven possible alternatives: anger, disgust, fear, joy, neutral, sadness, and surprise (Hartmann, 2022). In other words, the model predicts Ekman's six basic emotions plus an additional neutral class. It was trained with six datasets: Crowdflower, Emotion Dataset, GoEmotions, ISEAR, MELD, and SemEval-2018, using 80% for training and 20% for validation (Hartmann, 2022).
Russian Tweets. Regarding the Russian tweets, a pre-trained model was employed for their classification. The pre-trained
XLM-RoBERTa-Base (Smetanin & Komarov, Deep transfer learning baselines for sentiment analysis in Russian, 2021) was used on the RuReviews (Smetanin & Komarov, 2019) dataset. It is a variant that has been tuned specifically for sentiment analysis in Russian texts. It can predict sentiment polarity in three categories: negative, positive, and neutral. The model has about 278 million parameters and is available in the Hugging Face model library.
Visualization
Line Chart. A line chart displays the time evolution of one or more variables. Usually, the x-axis represents a continuous variable, such as time, while the y-axis represents the variable of interest intended to be analyzed over time (Ashman & Cruthers, 2021).
Bar Chart. The bar chart, also known as bar diagram, is a graph used to visualize and compare different categories. The graph has a categorical variable on one axis and a quantitative variable on the other (Ashman & words indicate greater frequency within Cruthers, 2021; Dougherty & Ilyankou, 2021, Li, 2020). In this case, it was used to compare Neogi, Garg, Mishra, & Dwivedi, 2021). the total count of tweets classified into the dif This procedure implements the wordcloud ferent seven emotions predicted by the model.
Wordcloud. A wordcloud is a visual representation of words of a text. The words are displayed in different sizes; the larger words indicate greater frequency within the text, and smaller ones are less frequent (Neogi, Garg, Mishra, & Dwivedi, 2021). This procedure implements the wordcloud library provided by python.

Results and Discussion
English Tweets
This figure and its contents were made by the authors of this work and its authorship corresponds to them.
After cleaning the data, removing duplicates, and selecting only the tweets in English, 603,552 tweets were obtained and fed into the model as input to predict sentiment. The implementation was performed in Google Colaboratory Pro version.
As shown in Figure 2, fear is the most prevalent sentiment in English tweets, accounting for 32.08% of the total number of tweets. It is followed by anger sentiment, with 15.18%. Neutral sentiment ranks third with 10.59%, followed by feelings of sadness, surprise, joy, and disgust with 8.7%, 6.76%, 5.11%, and 0.24%, respectively. Most tweets expressed fear due to the widespread panic over a possible world war, a feeling derived from the tension between the world's most powerful nations.
Anger is a consequence of all the acts that occurred in this event. This is consistent with the behavior of other animal societies, such as chimpanzees, where anger and fear are the two primary responses (Kret, Prochazkova, Sterck, & Clay, 2020; Signe, 2000). If attacked, the local clan's first reaction is usually fear derived from the situation and followed by anger to counterattack the enemy (Karin, 2019).
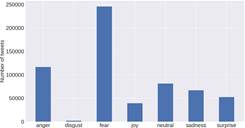
Fear stands out as the most common feeling in this subset. This figure and its contents were made by the authors of this work and its authorship corresponds to them.
Figure 2 Sentiment distribution of English tweets.
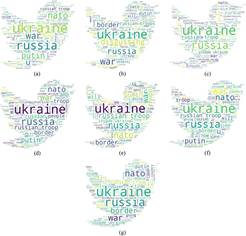
Wordclouds generated for each of the emotions addressed in English tweets. (a) Anger. (b) Disgust. (c) Fear. (d) Joy. (e) Neutral. (f) Sadness. (g) Surprise. This figure and its contents were made by the authors of this work and its authorship corresponds to them.
Figure 3 Wordclouds
As expected, the most common words were 'Russia' and 'Ukraine' in all the categories. Likewi-se, 'NATO,' 'troop,' 'Putin,' 'invade,' 'border,' 'Biden,' and 'war' were recurrent. To a lesser extent, the words 'Trump,' 'join,' 'stop,' and 'China' also appeared in the wordclouds. Focusing on the sentiments of fear and anger, the two most weigh-ted in the English corpus, in the former, tweets such as 'Invasion,' 'Weapons,' and 'Crisis' could be observed. Concerning anger, phrases alluding to stopping the war and supporting Ukraine, such as 'StopRussia,' 'Stand-WithUkraine,' and 'Suppor-tUkraine,' could be also seen, as shown in Figure 3.
The temporal analy-sis in Figure 4 shows that, in January, the number of tweets written remained relatively stable until Fe-bruary, when it increased significantly. This is because February was precisely the month Russia's invasion of Ukraine began. The highest peak of tweets can be obser-ved in the week of February 28. As in Figure 2, the trend continued as most tweets corresponded to feelings of fear and anger, while disgust was the category with the lowest number of tweets in each analyzed month.
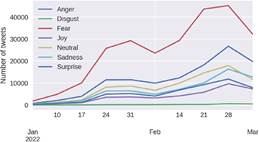
The range covers from January 1, 2022, to March 3, 2022. This figure and its contents were made by the authors of this work and its authorship co-rresponds to them.
Figure 4 Evolution of the number of English tweets per sentiment concerning time.
Russian Tweets
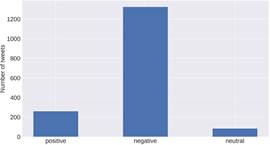
After undergoing the cleaning pro-cesses, 1,664 Russian tweets were obtained and entered the respective model for anal-ysis. Figure 5 shows the distribution of tweets according to each polarity analyzed. It is evident how negative polarity is the most prominent of all. It represents 86.83% of the tweets in Russian. The positive polarity follows this at 16.94%, and the neutral one at 5.23%.
Supported by the wordclouds in Figure 6, it is evident how the neg-ative polarity alludes to messages against Rus-sia's invasion of Ukraine. In this group of tweets, phrases such as 'StopPu-tin' and 'StopRussianAg-gression' clearly represent people's stance against the invasion. Likewise, some phrases can be observed that allude to feelings of fear and anger, such as 'StopWar,' and 'Putin-WarCriminal.' Regarding the positive polarity, one can find messages such as 'StopRussia,' 'Zelensky' and 'NATO.' Finally, in the neutral polarity, phras-es such as 'Ukraine,' 'Russian troops,' and 'USNA-TO' can be evidenced. In general, it is evident that the analysis of tweets in English and Russian presents similar results as most tweets are oriented to fear, anger, and oppo-sition to the Russian invasion of Ukraine.
Figure 7 shows the timeline for Russian tweets. As with the English corpus, there were a few tweets in the three polarities during January. Nevertheless, from February onwards, there is evidence of a significant increase in the number of tweets.
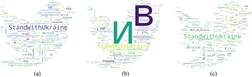
Wordclouds generated for each of the polarities addressed in Russian tweets: (a) Positive. (b) Negative. (c) Neutral. This figure and its contents were made by the authors of this work and its authorship corresponds to them.
Figure 6 Wordclouds.
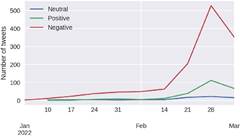
The range covers from January 1, 2022, to March 3 2022. This figure, and its contents were made by the authors of this work and its authorship corresponds to them.
Figure 7 Evolution of the number of Russian tweets per sentiment concerning time.
The highest peak can be seen in the week of February 28, as was also seen with tweets in English. Likewise, tweets with negative polarity are the most weighted throughout the analyzed period.
Conclusions
This paper analyzed 603,552 tweets in English and 1,664 tweets in Russian related to the Russia-Ukraine war conflict, aiming to understand sentiments people expressed in these tweets regarding this global shaking event. DistilRoBERTa and XLM-RoBERTa-Base neural network models were used to classify the tweets. English tweets were classified into seven emotions: anger, disgust, fear, joy, neutral, sadness, and surprise. Russian tweets were categorized into positive negative, and neutral polarities. The findings show that fear and anger were the most common feelings in English tweets, with 32.08% and 15.18%, respectively. In contrast, disgust was the least recurrent in this subset of data, with 0.24%. Concerning Russian tweets, negative polarity was the most heavily weighted with 86.83% of tweets, followed by positive polarity with 16.94%. The visualizations showed that February was the month with the highest number of tweets, and the week of February 28 had the highest peak for both English and Russian tweets. The most common words were 'Russia,' 'Ukraine,' 'NATO,' 'troops,' and 'Putin,' all related to the organizations involved in the conflict and their leaders. Tweets related to fear, anger, and negativity showed messages favoring Ukraine and opposing the Russian invasion and its leaders. Also, many tweets showed concern for the crises, weapons, and fatalities caused by the conflict.
Future work could improve the analysis by using more tweets and increasing the time range to be studied. The field of analysis could also be segmented to study the tweet sentiments according to different groupings and compare them with other societies, for instance, tweets could be segmented by country and analyzed accordingly.
Conflict of Interest
The authors have no relevant financial interests in this manuscript and no other potential conflicts of interest to disclose.

