


 Inglés (pdf)
 Articulo en XML
 Referencias del artículo
 Enviar articulo por email
 Citado por SciELO
  Similares en
SciELO
Similares en
SciELO 
 Permalink
Introduction
Implant-supported fixed dental prostheses (IFDPs) have been used to rehabilitate partially and completely edentulous patients, with high success rates (1). The passive fit of IFDPs is an essential factor to prevent biological and mechanical complications such as screw loosening and fracture, implant fracture, prosthetic component strain, and fracture or loss of the implant osseointegration (2). Although, a discrepancy threshold for the passive fit of IFDPs has not been consistent, the maximum discrepancy for an acceptable clinical fit was considered between 59 to 72µm (3). Better passive fit can be achieved by cement-retained IFDPs due to compensation of small misalignments and vertical gaps by cement (4), screw-retained IFDPs are widely used because of their advantages including reversibility, easier maintenance, and inadequate interocclusal space (5). Hybrid prostheses with multi-unit abutments (MUA) have become an effective prosthodontic option, which contributes to aesthetics and phona- tion with cheek and lip support, especially in the atrophic maxilla (6).
Computer-aided design and computer-aided manufacturing (CAD-CAM) technology present advantages for the passive fit of IFDPs compared with conventional fabricating techniques (7). To produce accurate high-quality IFDPs with CAD/ CAM systems, laboratory scanners (LS) and intraoral scanners (IOS) are used for the acquisition of implant positions with the use of scan bodies as in CAD/CAM workflow (8,9). Scan bodies are made of polyetheretherketone, titanium alloy, aluminum alloy, and various resins with dull, smooth, and opaque surfaces to be easier to scan (10,11). Although it is considered that higher precision acquisition can be achieved with polyether ketone scan bodies, there was no significant difference between the accuracies of polyether ketone scan bodies and titanium scan bodies (12). Although, scan bodies fabricated by implant manufacturers are usually used, third-party manufacturers also fabricate scan bodies by transferring the connection data between scan bodies and implants or analogs from implant manufacturers. Fabricating the scan bodies with connection data is essential for the accurate acquisition of implants (13). Therefore, in implant systems where third-party scan bodies are not available, scan bodies provided by the implant manufacturer are used. Most implant manufacturers produce and market only titanium scan bodies.
IOS have been successfully used for single implant-supported or short-span implant-supported restorations. However, the distance between the scan bodies, the depth of the implant, and the location within the scan can affect the accuracy of digital impressions (14). So, the conventional splinted pick-up technique has been suggested for complete arch implant-supported restorations (11,15,16,17,18). Despite the risk of dimensional changes of impression material and improper connection of the components (19,20,21,22), more accurate impressions can be performed with the splinted pick-up impression technique (8,9).
LS have higher precision than intraoral scanners (23). However, complete-arch (24,25) and single-tooth (26) gypsum model scans can be affected by the scanning technologies of LS. Implant scan accuracy studies are often performed to evaluate the effect of polyether ketone scan bodies instead of titanium scan bodies on accura- cies of LS (12,27,28). The purpose of the study was to compare the trueness and precision of LS by comparing linear and angular distortions in the indirect acquisition of complete-arch implants with original titanium scan bodies. The first null hypothesis of this study was that linear trueness was not affected by LS and inter-implant distance and angulation, the second was that angular trueness was not affected by LS and inter-implant distance and angulation, the third was that linear precision of LS was not affected by inter-implant distance and angulation, and the fourth was that angular precision of LS was not affected by inter-implant distance and angulation.
Materials and methods
Preparation of the master model
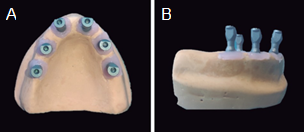
An edentulous maxillary plaster mold was poured with polymethylmethacrylate (Procryla, President Dental, München, Germany). Six implant analogs (Fixo, Oxy implant, Biomec, Lecco, Italy) were inserted at the sites #12, #22, #14, #24, #16, and #26. A laboratory surveyor was used to control the direction of each hole toward the longitudinal axis of the residual ridge and the depth of each implant analog. Implant holes were parallelly prepared in #14, #16, #24, and #26. Implant holes #12 and #22 were prepared at an angle of 10 degrees. The implant hole distance between #16 and #26 was 36mm and the others were approximately 12mm. Implant analogs were inserted and fixed in holes with polymethylmethacrylate. To produce a master model, an abutment-level impression coping (Impression coping transfer, Fixo, Oxy implant, Biomec, Italy) was connected to each implant analog and splinted by using self-curing acrylic resin (Pattern Resin™ LS, GC Corporation, Tokyo, Japan). Open-tray impression was performed using a custom tray with polyvinyl siloxane impression material (Hydrorise implant, Zhermack, Rovigo, Italy). After the impression material had completely polymerized, guide pins were loosened, and the impression tray was removed from the cast. An implant analog was connected to each impression coping. Artificial soft tissue (Gingifast Elastic, Zhermack, Italy) was formed around each analog and impression coping complex. The impression was poured into type IV dental stone (Elite Rock, Zhermack, Italy) and the master model was obtained (Figure 1).
Coordinate-measuring machine measurement of the master model
The reference values of the master model were obtained using a coordinate-measuring machine (DEA Global Classic, Hexagon Metrology, Torino, Italy) (CMM) with an accuracy of 3μm. A high-accuracy sensing probe with a ruby stylus of 2mm diameter was used to measure the 3D position of the implant analogs by touching the cone-cylinder interface with a determined force. Geometric features and measured points were constructed using inspection software (PC-DMIS, Hexagon Metrology, Torino, Italy). To define the centroids of each multi-unit abutment (MUA) analog, 9 points were determined on the basis of the MUA analog and best-fitted into a sphere. The center of the sphere was defined as the centroid. A cone was defined for each analog by measuring 4 points for each of the two height levels on the MUA analogs. The angulation of each analog on the master model was determined toward the centre-axis of the cone. The linear distance (centroid to centroid) and angulation (centreaxis to centre-axis) between #16-14, #14-12, #12-22, #22-24, #24-#26, and #16-26 analogs were calculated. 3 repeated measurements were recorded for each analog and the mean of linear distance and angulation values were defined as reference values (27).
Scanning procedure
Three laboratory scanners were compared in this study; D2000 (3Shape, Copenhagen, Denmark), Vinyl High Resolution (Smart Optics, Oslo, Norway), and inEos X5 (Dentsply Sirona, Konstanz, Germany). Six new grade-5 titanium scan bodies (Scan body, Fixo, Oxy implant, Biomec, Italy) were connected to the model and tightened with a calibrated torque ratchet (Torque ratchet, Fixo, Oxy implant, Biomec, Italy) at 15 Ncm. The master model was fixed on dental laboratory scanner. The number of scans per group to evaluate the scanning accuracy was identified using a power analysis software (G*Power 3.1.9.2, Duesseldorf, Germany) of data from a pilot experiment (n=5). It was found that 10 scans were necessary (power=95.52%, α=0.05). 10 scans for each laboratory scanner were performed repeatedly without detaching the model or the scan bodies. The acquired digital models were recorded in standard triangulation language (STL) format.
Trueness and precision analysis
Linear and angular trueness and precision were calculated by inspection software (Geomagic Control X, 2018, Geomagic, NC) according to ISO 17450-1-2-3 protocol;
1. STL models were digitally cropped so that only the polygon mesh of six scan bodies remained.
2. The top plane was defined by manually selecting meshes at the top of each scan body and associa- ting a plane using a least-squares algorithm.
3. MUA plane was constituted by projecting the top plane in the negative Z-direction by the height of the scan body (12mm).
4. Centre-axis was defined by the centre-axis of the cylinder present in the scan body.
5. The centroid was defined as the intersection point of the centre-axis and MUA plane. Centre- axis and centroid were identified for each scan body (Figure 2).
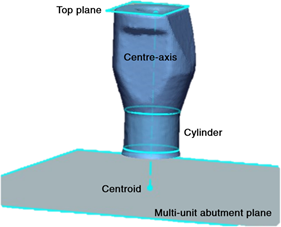
Figure 2 Virtual illustration of geometric features to define the centre-axis and centroid on the scan body.
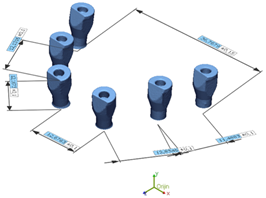
Six linear distance (centroid to centroid) and six angulation (between centre-axes) measurements for each scan were performed between #16-14, #14-12, #12-22, #22-24, #24-26, and #16-26 scan bodies and were recorded (Figure 3). Implant regions were defined according to inter-implant distance and angulation; parallel (R1: #24-26 and #16-14), angled (R2: #22-24 and #14-12), angled to occlusal plane (R3: #12-22), and cross-arch (R4: #16-26). Trueness was defined as the closeness of linear distance and angulation measurements of LS to reference CMM. Precision was defined as the closeness of intra-group measurements of each LS.
Statistics
All statistical values were analyzed using SPSS software (IBM SPSS Statistics for Windows, Version 22.0; IBM, Armonk, NY). A Shapiro-Wilk test was conducted to test intergroup normality, and the Levene test was conducted to test the homogeneity of variance (α=0.05). Two-way analyses of variance (ANOVA) were performed to evaluate the effect of LS and implant region on trueness. The post-hoc Scheffe test was used to compare the differences. The level of statistical significance was set at 0.05 for both statistical methods.
Results
Trueness
Descriptive statistics of linear and angular distortions were presented in Table 1. A two-way ANOVA revealed that there was not a significant interaction between the effects of LS and region (F (6,168)=1.608, p=0.2021). LS did not have a significant effect on linear distortion (p=0.203). The mean linear distortion of D2000, Vinyl High Resolution, and inEOS X5 were 27.2±16µm, 31.6±24.1µm, and 30.6±24.9µm, respecti- vely. The region had a significant effect on linear distortion (p<0.01). Significant lower linear distortion was noted on R3 (14.2±1.6µm) than on R2 (26±17.7µm) and R4 (61.2±17.9µm) (p<0.01).
There were no significant differences between R3 and R1 (23.4±15.5µm) (p=0.428) and R1 and R2 (p=0.845). Significant greater linear distortion was noted in R4 compared to R1 (p<0.01) and R2 (p<0.01).
A two-way ANOVA revealed that there was a significant interaction between the effects of LS and region on angular distortion (F (6,168)=4.020, p<0.01). Simple main effects analysis showed that LS did not have a significant effect on angular distortion (p=0.403). Mean angular distortions of D2000, Vinyl High Resolution, and inEOS X5 were 0.051±0.021 degrees, 0.049±0.026 degrees, and 0.045±0.028 degrees, respectively. The region also did not have a significant effect on angular distortion (p=0.095). Mean angular distortions of R1, R2, R3, and R4 were 0.043±0.021 degrees, 0.049±0.025 degrees, 0.048±0.03 degrees, and 0.056±0.025 degrees, respectively. Scheffe post-hoc results were presented in Table 2.
Table 1 Descriptive statistics of linear distance distortions (mean (standard deviation) µm) and angulation distortions (mean (standard deviation) degrees).
| - | - | Parallel (R1) | - | Angled (R2) | - | Angled to oclusal plane (R3) | Cross-arch (R4) |
|---|---|---|---|---|---|---|---|
| - | - | 26-24 | 14-16 | 24-22 | 12-14 | 22-12 | 16-26 |
| D2000 | Linear distance | 17.6(3,6) | 31.1(10.1) | 27.8(6.9) | 26.3(8.7) | 8.7(11) | 51.8(12) |
| - | Angulation | 0.05(0.014) | 0.032(0.02) | 0.058(0.013) | 0.035(0.021) | 0.061(0.011) | 0.07(0.016) |
| Vinyl High Resolution | Linear distance | 14(11.5) | 29.3(22.3) | 30.2(16.4) | 15.4(15.1) | 21.1(13.8) | 65.5(21.4) |
| - | Angulation | 0.044(0.016) | 0.059(0.024) | 0.051(0.019) | 0.029(0.019) | 0.042(0.038) | 0.067(0.02) |
| In EOS X5 | Linear distance | 34(18) | 14.1(7.5) | 46.4(22.6) | 10.2(6.6) | 12.9(5.8) | 66.2(16.9) |
| - | Angulation | 0.049(0.02) | 0.025(0.012) | 0.074(0.03) | 0.05(0.023) | 0.04(0.031) | 0.032(0.021) |
Table 2 Comparisons of linear distance distortions (mean (standard deviation) µm) and angular distortions (mean (standard deviation) degrees).
| - | - | R1 | R2 | R3 | R4 |
|---|---|---|---|---|---|
| D2000 | Linear distance | 24.4(10.1)ª | 27(7.7)ª | 8.7(11)ᵇ | 51.8(12) ͨ |
| - | Angulation | 0.041(0.019)ª | 0.046(0.021)ª | 0.061(0.011)ªᵇ | 0.07(0.016)ᵇ |
| Vinyl High Resolution | Linear distance | 21.7(19)ª | 22.8(17.1)ª | 21.1(13.8)ª | 65.5(21.4)ᵇ |
| - | Angulation | 0.051(0.021) | 0.04(0.022) | 0.042(0.038) | 0.067(0.02) |
| In EOS X5 | Linear distance | 24.1(16.8)ª | 28.3(24.6)ª | 12.9(5.8)ª | 66.2(16.9)ᵇ |
| - | Angulation | 0.037(0.02)ªᵇ | 0.062(0.029)ᵇ | 0.04(0.031)ªᵇ | 0.032(0.021)ª |
R1: #24-26 and #16-14, R2: #22-24 and #14-12, R3: #12-22, R4: #16-26. The different lowercase letters within the same row indicate statistical difference (Scheffe) (P<0.05).
Precision
A two-way ANOVA revealed that there was a significant interaction between the effects of LS and region (F (10,792)=6.705, p<0.01), LS
(p<0.01), and region (p<0.01) on linear precision. The mean linear precision of D2000, Vinyl High Resolution, and inEOS X5 were 7.2±7.6µm, 12.7±9.7µm, and 11.1±8.8µm, respectively. The mean linear precision of D2000 was significantly lower than Vinyl High Resolution (p<0.01) and inEOS X5 (p<0.01). There was no significant difference between Vinyl High Resolution and inEOS X5 (p=0.087). Greater mean linear precision was noted in R1 (9±8µm) and R3 (9.3±8.3µm) than in R4 (12.6±10.3µm) (p<0.01 and p=0.02, respectively) There was no significant difference between R2 (10.9±9.4µm)-R4 (p=0.367), R1-R2 (p=0.078), and R2-R3 (p=0.318).
A two-way ANOVA revealed that there was a significant interaction between the effects of LS and region (F (10, 792)=48.102, p<0.01), LS (p<0.01),
and region (p<0.01) on angular precision. The mean precision of D2000, Vinyl High Resolution, and inEOS X5 were 0.02±0.015 degrees, 0.032±0.019 degrees, and 0.033±0.018 degrees, respectively. The angular precision of D2000 was better than Vinyl High Resolution (p<0.01) and inEOS X5 (p<0.01). No difference was found between Vinyl High Resolution and inEOS X5 (p=0.827). Greater angular precision was noted in R3 (0.023±0.016 degrees) than in R1 (0.028±0.019 degrees) (p=0.046), and R4 (0.036±0.018 degrees) (p<0.01). There was no significant difference between R1 and R2 (0.028±0.018 degrees) (p=0.065). Greater angular deviations were noted in R4 than in R1 (p=0.004) and R2 (p=0.002). Scheffe post-hoc test results were presented in Table 3.
Table 3 Comparisons of linear precisions (mean (standard deviation) µm) and angular precisions (mean (standard deviation) degrees).
| - | - | R1 | R2 | R3 | R4 |
|---|---|---|---|---|---|
| D2000 | Linear distance | 4.6(3.7)ª | 5.8(3.9)ª | 10.7(11.4)ᵇ | 11.5(10.6)ᵇ |
| Angulation | 0.019(0.013)ª | 0.017(0.012)ª | 0.016(0.011)ª | 0.033(0.018)ᵇ | |
| Vinyl High Resolution | Linear distance | 12.3(8.4) | 13.2(10.8) | 10.4(6.8) | 14.8(11.8) |
| Angulation | 0.035(0.019)ª | 0.033(0.02)ª | 0.019(0.012)ᵇ | 0.038(0.017)ª | |
| In EOS X5 | Linear distance | 10.2(8.9)ª | 13.9(9.6)ª | 9.3(8.3)ᵇ | 12.6(10.3)ª |
| Angulation | 0.031(0.019) | 0.034(0.017) | 0.034(0.018) | 0.035(0.02) |
R1: #24-26 and #16-14, R2: #22-24 and #14-12, R3: #12-22, R4: #16-26. The different lowercase letters within the same row indicate no statistical difference (Scheffe) (P<0.05).
Discussion
According to the results of the present study, the linear trueness was not affected by both the interaction of LS and region (p=0.2021) and LS (p=0.203). On the other hand, the region affected linear trueness (p<0.01). While the interaction of simple effects (LS and region) affected the angular trueness (p<0.01), simple effects did not affect angular trueness (p=0.403, and p=0.095, respectively.). So, the first and the second null hypotheses were partially rejected. For precision, the main effects (region and LS) and their interactions affected both linear and angular distortions (p<0.05). So, the third and the fourth null hypotheses were rejected.
Different mean linear distortions were presented in studies with the use of different LS. Fluegge et al. (12) reported linear distortions between 6.2 to 14.1μm for short-span implant-supported restorations (D250; 3Shape, Denmark). Huang et al. (11) reported linear distortions between 35.35 and 52.58μm for four implants on mandible with original polyether ketone scan bodies (D2000; 3Shape, Denmark). Pan et al. (29) determined linear distortions on abraded aluminum experimental calibration block which imitated the all-on-4 concept (Zfx Evolution plus+, Zimmer Biomet, USA). Pan et al. (27) reported the linear distortions between 10.4 to 52µm with six polyether ketone third-party scan bodies on complete-arch (Zfx Evolution plus+, Zimmer Biomet, USA). Tan et al. (30) reported linear distortions between 11.1 to 45.4µm (inEOS X5). As can be seen from the studies mentioned above, single implants can be digitized with higher accuracy. Our linear distortion results were close to previous studies using polyether ketone scan bodies (11,27,30).
Although the linear distortions between the scan bodies with approximately 12mm inter-analog distance (8.7-28.3µm) have not reached the threshold of clinical significance (up to 72µm) (3), linear distortions in the cross-arch region (36mm inter-analog distance) (51.8-65.5µm) were closed to the threshold in the present study. Inter-implant distance generally affects the scan accuracy of IOS. Clinicians take multiple images to obtain a complete arch scan due to the limited viewpoint of IOS and the software stitches the images. Accumulate errors could come up because of the lack of reference points on the mucosa between implants (11). On the other hand, images are merged by coordinates in LS and the digital complete arch model can be established without stitching images (29). So, the effect of inter-implant distance on the accuracy of LS is not expected. However, Cho et al. (31) determined that the accuracy of LS decreases when the scanned area increases. Progressive errors and loosening accuracy can be induced unless multiple images merge by coordinates (32). Pan et al. (27) found the largest linear distortion (41.4μm) between anterior and posterior implants in the All-on-4 concept and explained this result by the interaction between angulation of implants and inter-implant distance. But in the present study, 2 posterior cross-arch implants were parallelly positioned. The results of the present study showed that the linear accuracy of LS was affected by the inter-implant distance which was consistent with previous studies (12,27).
A finite element analysis demonstrated that angular distortion may lead to more localized stress on bone due to the overloading of a superstructure and may cause bone resorptions (33). In the present study, neither LS (between 0.045 to 0.051 degrees) nor region (between 0.043 to 0.056 degrees) affected angular distortions. However, LS and region interaction affected angular distortion (p<0.01). Fluegge et al. (12) reported angular distortion between 0.03 to 0.16 degrees for short- span implant-supported restorations. Pan et al. (27) reported 0.06 degrees for complete-arch implant-supported restorations Tan et al. (30) reported between -1.620 to 0.054 degrees for complete-arch implant-supported restorations. Olea-vielba et al. (34) reported 0.02 to 0.09 degrees for complete-arch implant-supported restorations. The tightening torque of the scan body ,which limits the variety of connection fit between scan bodies and analogs, is specified as the reason for angular distortions (12,27). However tightening torque of the scan body was unstandardized or unmentioned in most accuracy studies (9,14,34-37). In the present study, the tightening torque was applied by a standardized-torque wrench according to the manufacturer’s recommendation, and scans were performed without loosening torque. The different results might be explained by the distortion of the material of the scan bodies (PEEK) due to higher tightening torque values (30) or scanning technologies of LS (24). Emir and Ayyildiz (24) determined that the accuracy of blue light scanners was higher than white light scanners and laser scanners. Blue light scanners that have higher precision due to shorter wavelengths were used in the present study.
Accuracy of acquisition is generally evaluated by two parameters such as trueness and precision. Trueness is defined as the deviation of the scanned object from its actual dimensions, while precision is the deviation between repeated scans. The present study was designed based on the principle of metrology. Analogs have available geometry to calculate the closest actual coordinates of the centre-axis and centroid by high accuracy CMM (14,27). By using this method, the actual divergences can be displayed which cannot be by using ''best-fit algorithms''(38).
Limitations of this study were that one implant system, one type of scan body (grade 5 titanium), and a limited number of LS were investigated in the present study. The results of the study could not extrapolate to the other implant systems, LS, and scan bodies. Fixo (Oxy implants) supplies just titanium scan bodies. In the presented study, third-party polyether ketone scan bodies were not used. Fixo (Oxy implants) was recently released and connection data between the scan body and implant or analog might not be transferred to third-party manufacturers. Future studies are needed to evaluate the effect of original titanium scan bodies with different geometrical shapes of different implant systems on the accuracy of full-arch scanning.
Conclusion
With the limitations of the present study, it was concluded that the linear accuracy of laboratory scanners (D2000, Vinyl High Resolution, and inEOS X5) did not differ in complete-arch implants scans. Linear accuracy of laboratory scanners decreased with the increase in inter-implant distance. The linear distortions in the cross-arch region were close to the clinical tolerance. The interaction between laboratory scanners and implant regions affected angular accuracy. In the cross-arch region, the highest angular accuracy was determined inEOS X5.
Author contribution statement
Conceptualization and design: B.E and O.C.S.
Literature review: B.E.
Methodology and validation: B.E.
Formal analysis: B.E.
Investigation and data collection: B.E.
Resources: B.E. and O.C.S.
Data analysis and interpretation: B.E.
Writing-original draft preparation: B.E.
Writing-review & editing: O.C.S.
Supervision: O.C.S.
Project administration: B.E. and O.C.S.
Funding acquisition: B.E. and O.C.S.

