


 English (pdf)
 Article in xml format
 Article references
 Send this article by e-mail
 Cited by SciELO
  Similars in
SciELO
Similars in
SciELO 
 Permalink
Introduction
The goal of health care is to provide diagnostic procedures, preventive care, and restorative care (1). The primary method for diagnosis is the clinical examination, which might use a supplemental diagnostic tool like the radiographic examination. Among dental radiographic techniques, panoramic radiograph (PR) is an initial imaging method, generally available, useful, and valuable diagnostic tool, allowing the professional to evaluate not only dental units but also important structures of the dentomaxillofacial complex (1,2), even if not every area of interest is accurately detected (2).
Digital panoramic imaging has become the latest technology and provides optimal diagnostic images with low radiation dose compared to the conventional technique. Therefore, the images adjustment in the post-processing technique could affect the sensitivity and specificity in detecting dental pathologies and abnormalities (3). At this point, several factors should be evaluated, including the monitor resolution, monitor luminance, image resolution, image bit depth, image receptor device, and ambient light (4). Hence, a welltrained operator will produce a high diagnostic of image quality (3).
Recently, the new development of technology improved methods to read dental images, using different visualization systems such as computers, tablets, and phones. That could be useful in dental radiology, but the feasibility of using these systems should be evaluated due to the variety of existing working conditions.
Moreover, there is limited knowledge of how observers diagnostic performance is affected by the method of visualization and ambient light. Thus, the aim of this study was to test the hypothesis that the observers performance is affected by using computer monitor, tablet, X-ray image view box, and against window daylight as a visualization method in reading panoramic radiography for different diagnostic tasks.
Material and methods
This study was accepted by the research ethics committee of the local institution.
Sample
Thirty digital PR were retrospectively selected by a dentomaxillofacial radiologist, who did not participate in the image assessment, from an oral radiology clinics image databank. All radiographs were taken with the Orthopantomograph OP100 D (Instrumentarium Corp., Tuusula, Finland), under 66 kV, 2.5 mA, and 17.6 seg exposure parameters, by experienced radiographers, ensuring a routine quality standard. All images were exported as TIFF files (Tagged Image File Format) and selected using a Barco LCD MDRC-2124 monitor (Barco, Kortrijk, Belgium), designed for medical diagnostic work. All PR selected were considered as technically correct: maximum detail, medium degree of contrast, image ampliation only that inherent to the method and indicating that it was obtained with the patient correctly positioned and including normal as well as abnormal conditions for each of the seven conditions to be evaluated. In this way, the structures to be evaluated should be clearly visible in the image. Images with exposure, position, and/or movement errors were not included. All images were anonymized and printed in a Dry Medical Film DRY DT2B 20x25 (Agfa, Mortsel, Belgium) using a DRYSTAR 5302 printer (Agfa, Mortsel, Belgium).
Image evaluations
Digital and printed PR were assessed independently by three dentomaxillofacial radiologists with four-year experience in four different visualization methods:
Digital PR: in a quiet, calm, and dimed lit room, using a monitor using a Barco LCD MDRC-2124 (Barco, Kortrijk, Belgium) and a JPEG image viewer software;
Digital PR: In a quiet, calm, and dimmed lit room using a tablet iPad Pro 12.9 inches 2nd generation (Mac Inc., California, USA) and a JPEG image viewer software;
Printed PR: In a quiet, calm, and dimmed lit room, using an X-ray image view box (Medical Technology Co., Ltd, Beijing, China);
Printed PR: Against the light of day by a glass window at the same place and time of day.
The three observers were calibrated, and detailed instructions and definitions of all conditions were given to all observers. A maximum of ten PR was allowed to be evaluated per day to avoid visual fatigue. In each assessment, the PRs were displayed in random order to minimize the memory effect, and, when applicable, only the use of the zoom tool was allowed.
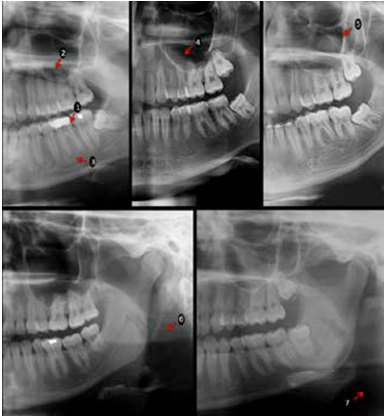
A set of seven lowand high-contrast conditions were evaluated altogether (Figure 1). Three of these related to teeth: dental caries, widened periodontal ligament space, and periapical bone defects from the four first molars (arrows 1-3); two related to maxillary sinus in both sides: mucosal thickening and retention cysts (arrows 4 and 5); and two related to soft tissues calcifications in both sides: stylo-hyoid ligament and ateroma (arrows 6 and 7). A five-point confidence scale was used to answer about presence/absence of a condition: 0=definitely present, 1=proba- bly present, 2=unsure, 3=probably not present, 4=definitely not present. The three observers re-assessed thirty percent of the sample under the same conditions after thirty days to verify the intra-observer agreement.
Two observers, with more than five-year- experience in assessing PR and that, did not parti- cipate in the evaluations, assessed in consensus all images for the conditions of the study using a medical monitor (Barco LCD MDRC-2124, Barco, Kortrijk, Belgium) in a quiet and dimmed light ambient. Their scores were considered as standard-reference (5,6).
Statistical analysis
Data were analyzed in SPSS version 22.0 software (IBM Corp, Armonk, NY, USA). Diagnostic values of accuracy (Az value), sensitivity, and specificity were obtained by the area under the Receiver Operating Characteristic (ROC) curve and compared by one-way ANOVA and Tukeys post-hoc test. The weighted-Kappa test verified the agreement between the monitor to the other evaluation methods and the intra and interobserver agreement. The significance level adopted was p<0.05.
Results
Mean intraobserver agreement was fair for monitor (0.51) and X-ray image view box (0.57), and poor for tablet (0.13) and window light (0.12) evaluation. Mean interobserver agreement was fair for all evaluation methods (ranging from 0.38 to 0.47) (7).
Table 1 shows the diagnostic values for the dental assessment of caries, widened PLS, and periapical bone defect on the different evaluation methods. Statistically significant differences were found for the accuracy and specificity of caries detection (p<0.05), in which widow light values were lower than the other evaluation methods. For periapical bone defect, window lights specificity was statistically significant lower than the other methods (p<0.05).
Accuracy and sensitivity for retention cyst detection were significantly lower (p<0.05) in widow light evaluation, compared to the other methods (Table 2). No difference was found for mucosal thickening (p>0.05).
For the calcification diagnosis, the diagnostic values are shown in Table 3. Window light had the lowest values for accuracy, sensitivity, and specificity (p<0.05) for stylo-hyoid ligament calcification. For atheroma detection, the X-ray image view box, tablet, and window light had lower accuracy than the evaluation on the monitor (p<0.05).
Table 4 shows the values of agreement between the observers monitor evaluation and X-ray image view box, tablet, and window light. In general, the values of the agreement for X-ray image view box and tablet were fair (0.471 and 0.445, respectively) and poor for window light (0.02).
Table 1 Diagnostic values and standard deviation (SD) of Az value, sensitivity, and specificity for dental evaluation of caries lesion, widened periodontal ligament space (PLS), and periapical bone defect, considering the standard-reference.
| - | Diagnostic task | - | - | - | - | - | - | - | - |
|---|---|---|---|---|---|---|---|---|---|
| Evaluation method | Caries lesion | - | - | Widened PLS | - | - | Periapical bone defect | - | - |
| - | Az value | Sensitivity | Specificity | Az value | Sensitivity | Specificity | Az value | Sensitivity | Specificity |
| Monitor | 0.798a (0.05) | 0.448a (0.23) | 0.957a (0.04) | 0.606a (0.03) | 0.177a (0.05) | 0.964a (0.04) | 0.644a (0.09) | 0.267a (0.15) | 0.983a (0.02) |
| X-ray image viewbox | 0.756a (0.01) | 0.461a (0.18) | 0.929a (0.05) | 0.579a (0.05) | 0.163a (0.12) | 0.940a (0.08) | 0.627a (0.06) | 0.217a (0.10) | 0.993a (0.01) |
| Tablet | 0.786a (0.06) | 0.407a (0.14) | 0.972a (0.03) | 0.590a (0.10) | 0.106a (0.08) | 0.995a (0.01) | 0.647a (0.11) | 0.267a (0.16) | 0.983a (0.02) |
| Window light | 0.509b (0.01) | 0.274a (0.08) | 0.759b (0.09) | 0.515a (0.02) | 0.050a (0.03) | 0.963a (0.02) | 0.485a (0.01) | 0.000a (0) | 0.943b (0.03) |
One-way ANOVA and Tukeys post-hoc test. Different letters mean significant statistical difference (p<0.05) between evaluation methods.
Table 2 Diagnostic values and standard deviation (SD) of Az value, sensitivity, and specificity for maxillary sinus evaluation of mucosal thickening and retention cyst, considering the standard-reference.
| - | Diagnostic task | - | - | - | - | - |
|---|---|---|---|---|---|---|
| Mucosal thickening | - | - | Retention cyst | - | - | |
| Evaluation method | Az value | Sensitivity | Specificity | Az value | Sensitivity | Specificity |
| Monitor | 0.641a (0.01) | 0.203a (0.13) | 0.973a (0.03) | 0.866a (0.02) | 0.792a (0.07) | 0.942a (0.04) |
| X-ray image viewbox | 0.607a (0.04) | 0.217a (0.09) | 0.910a (0.06) | 0.857a (0.06) | 0.667a (0.19) | 0.968a (0.01) |
| Tablet | 0.614a (0.08) | 0.319a (0.21) | 0.901a (0.09) | 0.854a (0.04) | 0.708a (0.14) | 0.962a (0.04) |
| Window light | 0.535a (0.1) | 0.217a (0.19) | 0.901a (0.06) | 0.501b (0.12) | 0.125b (0.22) | 0.890a (0.04) |
One-way ANOVA and Tukeys post-hoc test. Different letters mean significant statistical difference (p<0.05) between evaluation methods.
Table 3 Diagnostic values and standard deviation (SD) of Az value, sensitivity, and specificity for calcification evaluation of stylo-hyoid ligament calcification and atheroma, considering the standard-reference.
| - | Diagnostic task | - | - | - | - | - |
|---|---|---|---|---|---|---|
| Evaluation method | Stylo-hyoid ligament calcification | - | - | Atheroma | - | - |
| - | Az value | Sensitivity | Specificity | Az value | Sensitivity | Specificity |
| Monitor | 0.945a (0.05) | 0.879a (0.21) | 0.953a (0.05) | 0.865a (0.04) | 0.381a (0.22) | 0.019a (0) |
| X-ray image viewbox | 0.934a (0.07) | 0.848a (0.26) | 0.959a (0.02) | 0.586b (0.05) | 0.143a (0) | 0.019a (0.02) |
| Tablet | 0.838a (0.11) | 0.727a (0.24) | 0.952a (0.03) | 0.568b (0.13) | 0.143a (0.25) | 0.006a (0.01) |
| Window light | 0.438b (0.07) | 0.091b (0.09) | 0.796b (0.07) | 0.532b (0.04) | 0.095a (0.08) | 0.032a (0.01) |
One-way ANOVA and Tukeys post-hoc test. Different letters mean significant statistical difference (p<0.05) between evaluation methods.
Table 4 Agreement (Weighted-kappa test) between PR evaluation methods compared to monitor evaluation for each diagnostic task.
| - | Evaluation method | - | - |
|---|---|---|---|
| Diagnostic task | X-ray image view box | Tablet | Window light |
| Dental | - | - | - |
| Caries lesion | 0.439 | 0.381 | 0.021 |
| Widened PLS | 0.351 | 0.304 | 0.061 |
| Periapical bone defect | 0.526 | 0.528 | 0 |
| Maxillary sinus | - | - | - |
| Mucosal thickening | 0.182 | 0.184 | 0.089 |
| Retention cyst | 0.733 | 0.806 | 0.030 |
| Calcifications | - | - | - |
| Stylo-hyoid ligament calcification | 0.768 | 0.672 | 0.070 |
| Atheroma | 0.303 | 0.271 | 0.031 |
| Mean agreement | 0.471 | 0.445 | 0.020 |
Discussion
In view of the new development of the technology and its improvement on methods to read dental images by using different visualization systems, there are few studies evaluating the effect of display type (4,8,9) and using tablets as a device to view images on the diagnostic performance of PR (4,5). The assessment of images by viewing against window daylight, a common ambient in some dental clinics, has not been investigated. Instead, some studies have reported that observers diagnostic performance in PR is not affected by the display type or evaluation method but by the observers experience (4,5).
We found quietly similar diagnostic performance when using monitor, tablet, and X-ray image view box for most of the evaluated conditions. These results are in accordance with Kim et al. (4) and Kallio-Pulkkinen et al. (5) that found no influences of the display type on the interpretation of maxillary sinus inflammatory lesions and detection of anatomical and pathological structures, respectively. Even using intraoral radiographs, Pakkala et al. (10) did not find difference in the diagnostic accuracy for carious lesion varying ambient light levels and monitors with different luminance levels.
On the other hand, in general, lower diagnostic values were found when using window light. This was not unforeseen since, regarding visual perception, the rods in the eye are activated in low lighting conditions, and small differences in grayscale between pixels on the monitor can be seen. Conversely, at bright lighting levels, the rods are less active, and small contrast differences are more difficult to observe (11). Lima et al. (8), in an in-vitro study using radiographic images with density of dental structures evaluated with different computer displays, horizontal viewing angle, and ambient light conditions, found that equivalent radiographic contrast is not influenced by computer display. However, an increase in hit percentages was found for images assessed at 90º under high ambient light. Moreover, in the present study, by using the monitor as a reference, only a fair agreement was obtained for observers answers using tablet and x-ray image view box, besides a poor agreement using window light, which means that the observers perception is influenced by the visualization method. However, it does not significantly change the values of diagnostic accuracy. Authors have proposed that observer perception may be associate with differences in experience, training, or visual perception (12,13).
With the use of reference-standard, the diagnostic values obtained in the present study were consistent with previous literature. Similar accuracy values were found for caries detection in PR assessed in the monitor (14,15), laptop and film (14), and tablet (16). A recent study evaluating periapical bone defect detection in PR assessed by monitor, also presented similar results to the present study (17). Malina-Altzinger et al. (18) compared PR and cone-beam computed tomography in the sinus evaluation and found a difference between the two imaging modalities only for bone cyst penetrating the sinus, proving that PR is adequate for maxillary sinus evaluation. For atheroma assessment, PR has presented low sensitivity and acceptable accuracy (19,20), as the present study results. Using widow light, we found that the diagnostic values for caries, periapical bone defects, retention cysts, and stylo-hyoid ligament calcification detection were significantly lower. In contrast, for the detection of atheroma, the monitor had significantly higher accuracy than other methods.
PR is a common examination covering both jaws and facial structures. For some diagnostic tasks, PR must not be considered the best option (e.g., caries detection). However, as the most common initial image for patient diagnosis, to assess its capability to detect different pathologies and the possible influences on it is highly relevant. In clinical practice, these images are assessed by different devices, screens, and lighting conditions,however, there is limited knowledge on how oral radiologists diagnostic performance is affected by the method of visualization and ambient light. In the present study, observers diagnostic performance in PR using monitor, tablet, X-ray image view box, and against window daylight as visualization method were compared. In general, window light had lower accuracy than the other evaluation methods.
As a retrospective study, it was not possible to obtain a gold-standard for the conditions assessed. However, previous studies comparing observers experience showed good reproducibility for specialists (1) or professionals with more than five years dealing with imaging diagnosis (2). An important point to emphasize is that the image alone is not responsible for the correct diagnosis. It is dependent on the observers experience (1,2) and the evaluation method used (5), among other factors that might have influence, such as the subjectivity of this task. It is noticeable the change in diagnostic thinking according to the evaluation method used in the present study.
Conclusion
The diagnostic values are affected by the use of window light as an evaluation method for PR for dental, sinus, and calcification disorders, confirming that the use of suitable devices and lightning conditions for PR evaluation is an essential factor for diagnosis.
Author contribution statement
Conceptualization and Design: D.M.T. and G.D.R-T. Literature Review: J.P.B.A. and H.G-A.
Methodology and Validation: G.D.R-T. and S.M.A. Formal Analysis: D.M.T.
Investigation and data collection: D.M.T. and G.D.R-T.
Resources: not applicable
Data Analysis and Interpretation: H.G-A and D.M.B. Writing-Original Draft Preparation: J.P.B.A., H.G-A and D.M.B.
Writing-Review & Editing: S.M.A. and G.D.R-T.

