


 Inglés (pdf)
 Articulo en XML
 Referencias del artículo
 Enviar articulo por email
 Citado por SciELO
  Similares en
SciELO
Similares en
SciELO 
 Permalink
INTRODUCTION
The Coronavirus Disease 2019 (COVID- 19), responsible for the severe acute respiratory syndrome (SARS-COV-2), appeared in Wuhan (Hubei province, China) in late 2019 (1,2,3). Due to the high rate of contamination among people, it quickly migrated to all continents from east to west (from Asia, going to Europe and the Americas), assuming a pandemic status (1,2,4,5). To limit the spread of the virus, isolation and social distancing measures determined by the World Health Organization (WHO) immediately involved the temporary closure of educational institutions, and consequently, the interruption of worldwide classroom activities (1,2,6,7). Thus, to maintain education, alternatives were made possible through distance learning (1,2,8,9).
In this context, the virtual approach between professors and students has been provided through digital communication technologies (1,7,9). These technologies allow teaching by synchronous (real-time lectures) or asynchronous (recorded content available on digital platforms) methods (10), expediting the interaction between professors and students, and consequently, supporting the teaching-learning process (7).
Health courses, such as dentistry, depend on face-to-face contact with patients to train students. This training cannot be provided by distance learning, which has had didactic content exclusively (2,8,9). Despite this limitation, such teaching modality has allowed the learning process to continue by teaching the dentistry didactic components despite being suspended in-person classroom activities. Even in countries where the gradual return is being carried out (11), it is recommended that lectures continue through digital resources to avoid gatherings (4,6). This recommendation aims to prevent new contagion waves (3) due to the lack of specific treatments for COVID-19 or vaccines available to everyone. Additionally, some countries are experiencing a new waves of virus transmission, which could lead to suspend classes at any level of education again.
Previous experiences concerning the use of digital resources in teaching (e-learning) have already been carried out in different dentistry disciplines (12,13,14). However, they had been applied as a complement to face-to-face education, in an organized and previously planned way, but not in an emergency, as imposed by the Covid-19 public health crisis. Thus, this study aimed to evaluate the incorporation of digital technologies to adapt dental education during the COVID-19 pandemic and the associated experience of professors and undergraduate/graduate students.
MATERIAL AND METHODS
This study was approved by the local research ethics committee (CAAE: 32042720.8.0000.5418). All participants agreed to the informed consent form.
SAMPLE CHARACTERIZATION
A total of 995 volunteers participated in the study, being 479 (49.1%) professors and 516 (51.9%) students (Supplementary Material 1 and Figure 1).
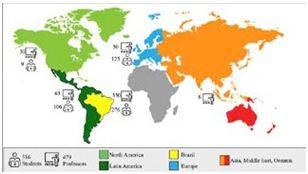
Although Mexico belongs geographically to North America, in the present study, due to the economic, cultural, and language characteristics in teaching and universities, this country was included among the other Spanish-speaking countries of Latin America. Also, it should be noted that, although Brazil is part of Latin America, in the present study it was assessed separately due to its continental dimensions and the Portuguese- speaking language.
QUESTIONNAIRE APPLICATION
Dentistry professors with experience in distance learning and communication technologies developed the research questionnaire. The questionnaire consisted of demographic data, and multiple-choice questions divided into two sections. The first section was composed of motivation- related questions concerning the teaching process imposed by social isolation and the status of university teaching activities.
The second section of the questionnaire had questions related to anxiety and stress regarding remote classes, digital communication technologies (synchronous/asynchronous) used for the different tasks (lectures, questions, evaluations), training for using these digital communication technologies, and difficulties/benefits of remote classes (Supplementary Material 2).
The answers about digital communication technologies were grouped by type, with examples to help the participants understand, such as:
For teaching lectures: Services for synchronous videoconferences (e.g., Zoom®, Google Meet®, Microsoft Teams®, Skype®); Services for synchronous real-time presentations (e.g., Youtube® Live, Twitch®, Collaborate Ultra®, Instagram Live®); Synchronous video calling applications (e.g., Whatsapp® video, Facebook® Messenger, Google® Duo, Facetime®); Video hosting asynchronous services (e.g., Youtube®, Panopto®, Vimeo®); others; Answering questions about the content of the lectures: Email; Synchronous video services (e.g., Zoom®, Google Meet®, Microsoft Teams®, Skype®, Instagram® Live); Text messaging applications (e.g., WhatsApp®, SMS®, Facebook® Messenger); Discussion forums; University's learning management systems (e.g., Blackboard®, Google Classroom®, Canvas®, Moodle®); others; Sending activities: Email; Text messaging applications (e.g., WhatsApp®, SMS®, Facebook® Messenger); Survey services (e.g., Google Forms®, Microsoft Forms®, Surveymonkey®); Cloud-storage services (e.g., Google Drive®, Dropbox®, Microsoft Onedrive®); University's learning management systems (e.g., Blackboard®, Google Classroom®, Canvas®, Moodle®); Interactive online polling services (e.g., Kahoot!®, Mentimeter®, Socrative®); others; Sending assessments: Email; Survey services (e.g., Google Forms®, Microsoft Forms®, Surveymonkey®); Cloud data storage services (e.g., Google Drive®, Dropbox®, Microsoft Onedrive®); University's learning management system (e.g., Blackboard®, Google Classroom®, Canvas®, Moodle®); Interactive online polling services (e.g., Kahoot!®, Mentimeter®, Socrative®); others.
The questions referring to the second part of the questionnaire were answered only by the participants who had their face-to-face activities suspended and had lectures or activities remotely. The questionnaire had a version for professors and another for undergraduate and postgraduate students in Dentistry (master's students, doctoral students, post-doctoral students, specialization, and residents). The questions regarding demographic data, anxiety/stress levels, and the classes' situation accepted only one answer. The questions regarding the tools used and benefits and difficulties accepted more than one answer. Considering both, participants could have used more than one technology type and faced several challenges and benefits.
The questionnaire was made available through the Google Forms platform (Alphabet Co., Mountain View, California, USA). Participants received an invitation with an access link sent by email or WhatsApp application. Participants were invited to participate voluntarily, having access to the questionnaire after agreeing to the Informed Consent Form. The answering time was approximately five minutes.
RESULTS
Regarding remote activities, 389 (81.2%) of professors and 445 (86.2%) of students had their face-to-face activities suspended and had online activities. With that, 389 professors and 445 students answered both parts of the questionnaire (Supplementary Material 3).
For professors, the motivation of teaching was most affected in female (p=0.027). The anxiety level about remote lectures was lower for professors in Europe than professors from other continents/countries (p=0.003 and 0.032) (Table 1). For students, the level of motivation with distance learning was significantly more affected in men (p=0.03) (Table 2). The concern with the academic future was greater among female students (p=0.032) and aged up to 20 years and 21 to 30 years (p=0.009), and for Latin American students and Brazil (p<0.0001 ) (Table 2). The level of anxiety/stress with distance lessons was higher for students aged up to 20 years (p=0.001), for students in Brazil and Latin America (p<0.0001), and for undergraduate students (p=0.023) (Table 2).
Regarding the study of the subjects of the undergraduate/postgraduate courses during the isolation period, it was found that younger students (up to 20 years old) are studying more with distance learning and less alone than students from other age groups (p<0.0001) (Supplementary Material 4). It was also observed that students from private universities are studying more than students from public universities (p<0.0001) (Supplementary Material 4).
Regarding university training/support for the use of digital communication technologies to develop distance lessons/activities, it was found that Latin American professors received more training than those from other continents/ countries (p<0.0001) (Supplementary Material 5). Besides, professors at public universities received less training than professors at other types of institutions (p<0.0001) (Supplementary Material 5). North American and European students, in contrast, had more training/support to access distance learning/activities than students from Brazil and Latin America (p<0.0001) (Supplementary Material 5). It was also observed that students from private universities received more training than students from public universities (p<0.0001) (Supplementary Material 5).
The most used means to solve students' questions were email (31.4%), videoconference (31.3%), and text messaging applications (21.7%). In that way, Brazilian professors used text messaging apps the most, while North American professors used them the less (p<0.0001) (Table 3). Between the continents, there was a difference in the use of online quiz services, being less used in Asia/ Oceania/Middle East, and more used in Latin America and Europe (p<0.0001) (Table 3).
To access remote lectures, students from all continents/countries used computers/notebooks more than mobile devices (p<0.0001) (Table 3). Latin American students used survey services more than students from other continents/countries; students from Brazil, on the other hand, used survey services less than other continents (p<0.0001) (Table 4). Students at private universities used the universities' platforms for assessment activities the most (Table 4).
When participants were asked which online tools could be used when returning to face-to-face lessons, the highest response frequencies were for "online meetings" and "university system" for both professors and students, without interference from participants' sex and age. Professors in Brazil answered more "online meetings" and "survey services" and less "email" and "online polling services" than professors from other continents (p<0.0001); professors in Europe scored fewer "cloud storage services" than other continents/ countries (p<0.0001) (Table 5). Students from Brazil marked more the option "none" and less "survey services" and "emails" than students from other continents. While students in Latin America scored more "quizzing services" and less "survey services". Students from Europe scored more "emails" and less "survey administration services" (p<0.0001) (Table 5).
Regarding the difficulties with distance learning, most professors aged 21-30 years indicated "low student participation"; professors aged 61-70 and 71-80 years had more "difficulty recording lectures," while professors aged 71-80 years cited "lack of knowledge with technologies of video conferencing." On the other hand, professors aged 61 to 70 years indicated more "not having difficulty" with remote lectures (p= 0.011) (Table 6). Professors from Latin America and Asia/Oceania/ Middle East had more "difficulty accessing the internet," while professors from Europe indicated that they "had no difficulties" (p=0.007) (Table 6). Considering the benefits of distance learning, professors in Europe indicated more that they were able to "transmit the content better" than "to be safe in the pandemic"; professors from Asia/ Oceania/Middle East and Brazil indicated that "with remote activities, students are not idle" (p<0.0001) (Table 6).
It was found that in Europe, students had greater "difficulty in accessing the internet" and less "difficulty in concentration" than students from other continents/countries. In comparison, students in Brazil had greater "difficulty in concentration with remote lectures" than students from other continents (p<0.0001) (Table 7). Among the benefits of distance learning, students in Brazil chose more "not to be idle and anxious" and "security during the pandemic" than other continents. In contrast, students in Europe marked less the item "security during the pandemic" and more "I feel more comfortable" than the other continents/country (p<0.0001) (Table 7).
Table 1 Professors' motivation and stress/anxiety concerning teaching associated with distance lessons (scores from 1 to 10, the higher the score, the higher the level of stress/anxiety).
| - | Question | How has social isolation impacted your ability and motivation in the teaching/learning process? | - | - | - | - | - | - | - | - | - | - |
|---|---|---|---|---|---|---|---|---|---|---|---|---|
| Variables | - | 1 | 2 | 3 | 4 | 5 | 6 | 7 | 8 | 9 | 10 | - |
| Sex | Female | 6 (2.2) | 4 (1.5) | 17 (6.2) | 24 (8.8) | 59 (21.6) | 34 (12.5) | 47 (17.2) | 52 (19.0) | 22 (8.1) | 8 (2.9) | 0.027** |
| - | Male | 8 (3.9) | 8 (3.9) | 17 (8.3) | 22 (10.7) | 48 (23.3) | 18 (8.7) | 27 (13.1) | 30 (14.6) | 11 (5.3) | 17 (8.3) | - |
| Age | No answer | 1 (1.7) | 3 (5.1) | 8 (13.6) | 11 (18.6) | 12 (20.3) | 4 (6.8) | 9 (15.3) | 6 (10.2) | 2 (3.4) | 3 (5.1) | 0.371* |
| - | 21-30 | 1 (4.3) | 0 (0.0) | 2 (8.7) | 2 (8.7) | 6 (26.1) | 3 (13.0) | 4 (17.4) | 2 (8.7) | 2 (8.7) | 1 (4.3) | - |
| - | 31-40 | 2 (1.4) | 1 (0.7) | 7 (5.1) | 10 (7.2) | 32 (23.2) | 23 (16.7) | 23 (16.7) | 27 (19.6) | 8 (5.8) | 5 (3.6) | - |
| - | 41-50 | 1 (0.7) | 3 (2.2) | 10 (7.2) | 12 (8.6) | 31 (22.3) | 13 (9.4) | 21 (15.1) | 27 (19.4) | 14 (10.1) | 7 (5.0) | - |
| - | 51-60 | 4 (4.7) | 2 (2.3) | 4 (4.7) | 9 (10.5) | 20 (23.3) | 7 (8.1) | 13 (15.1) | 14 (16.3) | 6 (7.0) | 7 (8.1) | - |
| - | 61-70 | 5 (16.7) | 2 (6.7) | 3 (10.0) | 1 (3.3) | 6 (20.0) | 1 (3.3) | 4 (13.3) | 5 (16.7) | 1 (3.3) | 2 (6.7) | - |
| - | 71-80 | 0 (0.0) | 1 (25.0) | 0 (0.0) | 1 (25.0) | 0 (0.0) | 1 (25.0) | 0 (0.0) | 1 (25.0) | 0 (0.0) | 0 (0.0) | - |
| Continent | North America | 0 (0.0) | 3 (10.0) | 2 (6.7) | 6 (20.0) | 10 (33.3) | 3 (10.0) | 2 (6.7) | 0 (0.0) | 3 (10.0) | 1 (3.3) | 0.067* |
| - | Latin America | 0 (0.0) | 2 (3.2) | 5 (7.9) | 5 (7.9) | 15 (23.8) | 4 (6.3) | 11 (17.5) | 8 (12.7) | 7 (11.1) | 6 (9.5) | - |
| - | Brazil | 13 (3.9) | 6 (1.8) | 23 (7.0) | 29 (8.8) | 71 (21.5) | 38 (11.5) | 50 (15.2) | 68 (20.6) | 20 (6.1) | 12 (3.6) | - |
| - | Europe | 1 (2.0) | 1 (2.0) | 4 (8.0) | 5 (10.0) | 9 (18.0) | 6 (12.0) | 9 (18.0) | 6 (12.0) | 3 (6.0) | 6 (12.0) | - |
| - | Asia/Oceania/Middle East | 0 (0.0) | 0 (0.0) | 0 (0.0) | 1 (16.7) | 2 (33.3) | 1 (16.7) | 2 (33.3) | 0 (0.0) | 0 (0.0) | 0 (0.0) | - |
| - | Total | 14 (2.9) | 12 (2.5) | 34 (7.1) | 46 (9.6) | 107 (22.3) | 52 (10.9) | 74 (15.4) | 82 (17.1) | 33 (6.9) | 25 (5.2) | 479 (100.0) |
| - | Question | What is your anxiety/stress level with distance learning (how do I feel about remote lectures)? # | - | - | - | - | - | - | - | - | - | - |
| Variables | - | 1 | 2 | 3 | 4 | 5 | 6 | 7 | 8 | 9 | 10 | - |
| Sex | Female | 18 (8.5) | 27 (12.7) | 22 (10.3) | 19 (8.9) | 32 (15.0) | 24 (11.3) | 26 (12.2) | 25 (11.7) | 13 (6.1) | 7 (3.3) | 0.113* |
| - | Male | 34 (19.5) | 13 (7.5) | 20 (11.5) | 15 (8.6) | 25 (14.4) | 22 (12.6) | 12 (6.9) | 20 (11.5) | 10 (5.7) | 3 (1.7) | - |
| Age | No answer | 3 (6.3) | 4 (8.3) | 8 (16.7) | 2 (4.2) | 5 (10.4) | 12 (25.0) | 6 (12.5) | 6 (12.5) | 1 (2.1) | 1 (2.1) | 0.812* |
| - | 21-30 | 3 (16.7) | 2 (11.1) | 3 (16.7) | 2 (11.1) | 1 (5.6) | 2 (11.1) | 1 (5.6) | 2 (11.1) | 2 (11.1) | 0 (0.0) | - |
| - | 31-40 | 11 (9.3) | 16 (13.6) | 11 (9.3) | 11 (9.3) | 19 (16.1) | 14 (11.9) | 9 (7.6) | 14 (11.9) | 8 (6.8) | 5 (4.2) | - |
| - | 41-50 | 18 (16.7) | 12 (11.1) | 7 (6.5) | 8 (7.4) | 17 (15.7) | 11 (10.2) | 9 (8.3) | 15 (13.9) | 8 (7.4) | 3 (2.8) | - |
| - | 51-60 | 11 (15.5) | 6 (8.5) | 9 (12.7) | 10 (14.1) | 12 (16.9) | 5 (7.0) | 9 (12.7) | 6 (8.5) | 3 (4.2) | 0 (0.0) | - |
| - | 61-70 | 4 (20.0) | 0 (0.0) | 4 (20.0) | 1 (5.0) | 3 (15.0) | 1 (5.0) | 4 (20.0) | 1 (5.0) | 1 (5.0) | 1 (5.0) | - |
| - | 71-80 | 2 (50.0) | 0 (0.0) | 0 (0.0) | 0 (0.0) | 0 (0.0) | 1 (25.0) | 0 (0.0) | 1 (25.0) | 0 (0.0) | 0 (0.0) | - |
| Continent | North America | 3 (11.1) | 4 (14.8) | 1 (3.7) | 2 (7.4) | 3 (11.1) | 6 (22.2) | 5 (18.5) | 2 (7.4) | 0 (0.0) | 1 (3.7) | 0.003* |
| - | Latin America | 4 (6.6) | 2 (3.3) | 7 (11.5) | 5 (8.2) | 8 (13.1) | 10 (16.4) | 4 (6.6) | 11 (18.0) | 8 (13.1) | 2 (3.3) | - |
| - | Brazil | 30 (12.2) | 30 (12.2) | 26 (10.6) | 18 (7.3) | 42 (17.1) | 24 (9.8) | 27 (11.0) | 28 (11.4) | 14 (5.7) | 7 (2.8) | - |
| - | Europe | 15 (31.9) | 4 (8.5) | 4 (8.5) | 9 (19.1) | 4 (8.5) | 5 (10.6) | 2 (4.3) | 3 (6.4) | 1 (2.1) | 0 (0.0) | - |
| - | Asia/Oceania/Middle East | 0 (0.0) | 0 (0.0) | 4 (66.7) | 0 (0.0) | 0 (0.0) | 1 (16.7) | 0 (0.0) | 1 (16.7) | 0 (0.0) | 0 (0.0) | - |
| - | Total | 52 (13.4) | 40 (10.3) | 42 (10.9) | 34 (8.8) | 57 (14.7) | 46 (11.9) | 38 (9.8) | 45 (11.6) | 23 (5.9) | 10 (2.6) | 387 (100.0) |
| - | Question | What is your level of concern with the classes/activities (not being able to teach all the course's content)? # | - | - | - | - | - | - | - | - | - | - |
| Variables | - | 1 | 2 | 3 | 4 | 5 | 6 | 7 | 8 | 9 | 10 | - |
| Sex | Female | 14 (6.6) | 11 (5.2) | 16 (7.5) | 10 (4.7) | 27 (12.7) | 15 (7.0) | 32 (15.0) | 40 (18.8) | 13 (6.1) | 35 (16.4) | 0.087** |
| - | Male | 22 (12.6) | 8 (4.6) | 15 (8.6) | 7 (4.0) | 21 (12.1) | 21 (12.1) | 25 (14.4) | 30 (17.2) | 14 (8.0) | 11 (6.3) | - |
| Ages | No answer | 4 (8.3) | 1 (2.1) | 3 (6.3) | 3 (6.3) | 5 (10.4) | 7 (14.6) | 11 (22.9) | 6 (12.5) | 4 (8.3) | 4 (8.3) | 0.481* |
| - | 21-30 | 1 (5.6) | 2 (11.1) | 1 (5.6) | 0 (0.0) | 0 (0.0) | 2 (11.1) | 4 (22.2) | 4 (22.2) | 1 (5.6) | 3 (16.7) | - |
| - | 31-40 | 7 (5.9) | 6 (5.1) | 9 (7.6) | 6 (5.1) | 15 (12.7) | 11 (9.3) | 12 (10.2) | 19 (16.1) | 15 (12.7) | 18 (15.3) | - |
| - | 41-50 | 9 (8.3) | 6 (5.6) | 8 (7.4) | 4 (3.7) | 17 (15.7) | 6 (5.6) | 17 (15.7) | 23 (21.3) | 3 (2.8) | 15 (13.9) | - |
| - | 51-60 | 11 (15.5) | 4 (5.6) | 6 (8.5) | 2 (2.8) | 9 (12.7) | 5 (7.0) | 11 (15.5) | 15 (21.1) | 3 (4.2) | 5 (7.0) | - |
| - | 61-70 | 3 (15.0) | 0 (0.0) | 3 (15.0) | 1 (5.0) | 2 (10.0) | 4 (20.0) | 2 (10.0) | 3 (15.0) | 1 (5.0) | 1 (5.0) | - |
| - | 71-80 | 1 (25.0) | 0 (0.0) | 1 (25.0) | 1 (25.0) | 0 (0.0) | 1 (25.0) | 0 (0.0) | 0 (0.0) | 0 (0.0) | 0 (0.0) | - |
| Continent | North America | 3 (11.1) | 2 (7.4) | 2 (7.4) | 0 (0.0) | 3 (11.1) | 4 (14.8) | 7 (25.9) | 3 (11.1) | 1 (3.7) | 2 (7.4) | 0.032* |
| - | Latin America | 3 (4.9) | 1 (1.6) | 5 (8.2) | 3 (4.9) | 8 (13.1) | 2 (3.3) | 9 (14.8) | 12 (19.7) | 7 (11.5) | 11 (18.0) | - |
| - | Brasil | 19 (7.7) | 14 (5.7) | 16 (6.5) | 9 (3.7) | 32 (13.0) | 26 (10.6) | 32 (13.0) | 48 (19.5) | 18 (7.3) | 32 (13.0) | - |
| - | Europe | 11 (23.4) | 2 (4.3) | 7 (14.9) | 5 (10.6) | 5 (10.6) | 3 (6.4) | 7 (14.9) | 6 (12.8) | 1 (2.1) | 0 (0.0) | - |
| - | Asia/Oceania/Middle East | 0 (0.0) | 0 (0.0) | 1 (16.7) | 0 (0.0) | 0 (0.0) | 1 (16.7) | 2 (33.3) | 1 (16.7) | 0 (0.0) | 1 (16.7) | - |
| - | Total | 36 (9.3) | 19 (4.9) | 31 (8.0) | 17 (4.4) | 48 (12.4) | 36 (9.3) | 57 (14.7) | 70 (18.1) | 27 (7.0) | 46 (11.9) | 387 (100.0) |
Bold values mean different from others within the groups.
* according to Fisher's exact (comparisons were made vertically).
** according to Chi-square test (comparisons were made vertically). # only participants who were taking distance learning.
Table 2 Students' motivation about the learning process during social isolation and stress/anxiety associated with distance lessons (scores from 1 to 10, the higher the score, the higher the level of stress/anxiety).
| - | Question | How has social isolation impacted your ability and motivation in the teaching/learning process? | - | - | - | - | - | - | - | - | - | - |
|---|---|---|---|---|---|---|---|---|---|---|---|---|
| Variables | - | 1 | 2 | 3 | 4 | 5 | 6 | 7 | 8 | 9 | 10 | p-value |
| Sex | Female | 37 (9.8) | 27 (7.2) | 64 (17.0) | 53 (14.1) | 66 (17.6) | 40 (10.6) | 34 (9.0) | 35 (9.3) | 11 (2.9) | 10 (2.4) | 0.030* |
| - | Male | 7 (5.1) | 5 (3.6) | 22 (15.9) | 19 (13.8) | 24 (17.4) | 8 (5.8) | 27 (19.6) | 14 (10.1) | 6 (4.3) | 7 (4.3) | - |
| Age | No answer | 0 (0.0) | 2 (8.3) | 6 (25.0) | 2 (8.3) | 5 (20.8) | 1 (4.2) | 6 (25.0) | 1 (4.2) | 1 (4.2) | 0 (0.0) | 0.743* |
| - | Until 20 | 7 (11.1) | 9 (14.3) | 12 (19.0) | 10 (15.9) | 8 (12.7) | 5 (7.9) | 5 (7.9) | 5 (7.9) | 1 (1.6) | 1 (1.6) | - |
| - | 21-30 | 33 (8.7) | 21 (5.5) | 61 (16.1) | 52 (13.7) | 69 (18.2) | 38 (10.0) | 42 (11.1) | 37 (9.7) | 13 (3.4) | 14 (3.7) | - |
| - | 31-40 | 3 (8.3) | 0 (0.0) | 6 (16.7) | 4 (11.1) | 7 (19.4) | 3 (8.3) | 5 (13.9) | 5 (13.9) | 2 (5.6) | 1 (2.8) | - |
| - | 41-50 | 0 (0.0) | 0 (0.0) | 1 (10.0) | 3 (30.0) | 0 (0.0) | 1 (10.0) | 3 (30.0) | 1 (10.0) | 0 (0.0) | 1 (10.0) | - |
| - | 51-60 | 1 (33.3) | 0 (0.0) | 0 (0.0) | 1 (33.3) | 1 (33.3) | 0 (0.0) | 0 (0.0) | 0 (0.0) | 0 (0.0) | 0 (0.0) | - |
| Continent | North America | 0 (0.0) | 1 (11.1) | 2 (22.2) | 1 (11.1) | 0 (0.0) | 0 (0.0) | 2 (22.2) | 1 (11.1) | 1 (11.1) | 1 (11.1) | <0.0001* |
| - | Latin America | 6 (5.7) | 2 (1.9) | 16 (15.1) | 14 (13.2) | 21 (19.8) | 13 (12.3) | 12 (11.3) | 13 (12.3) | 6 (5.7) | 3 (2.8) | - |
| - | Brazil | 35 (12.7) | 25 (9.1) | 57 (20.7) | 45 (16.3) | 44 (15.9) | 21 (7.6) | 20 (7.2) | 16 (5.8) | 6 (2.2) | 7 (2.5) | - |
| - | Europe | 3 (2.4) | 4 (3.2) | 11 (8.8) | 12 (9.6) | 25 (20.0) | 14 (11.2) | 27 (21.6) | 19 (15.2) | 4 (3.2) | 6 (4.8) | - |
| - | Total | 44 (8.5) | 32 (6.2) | 86 (16.7) | 72 (14.0) | 90 (17.4) | 48 (9.3) | 61 (11.8) | 49 (9.5) | 17 (3.3) | 17 (3.3) | 516 (100.0) |
| - | Question | What is your concern level about your academic future (not learning all the content for training)? | - | - | - | - | - | - | - | - | - | - |
| Variables | - | 1 | 2 | 3 | 4 | 5 | 6 | 7 | 8 | 9 | 10 | p-value |
| Sex | Female | 10 (2.4) | 7 (1.9) | 12 (3.2) | 16 (4.3) | 21 (5.6) | 27 (7.2) | 36 (9.6) | 57 (15.2) | 48 (12.8) | 143 (38.0) | 0.032** |
| - | Male | 10 (7.2) | 8 (5.8) | 7 (5.1) | 5 (3.6) | 13 (9.4) | 7 (5.1) | 13 (9.4) | 16 (11.6) | 16 (11.6) | 44 (31.2) | - |
| Age | No answer | 2 (8.3) | 3 (12.5) | 0 (0.0) | 2 (8.3) | 4 (16.7) | 4 (16.7) | 2 (8.3) | 1 (4.2) | 0 (0.0) | 6 (25.0) | 0.009* |
| - | 11-20 | 0 (0.0) | 0 (0.0) | 3 (4.8) | 0 (0.0) | 2 (3.2) | 2 (3.2) | 9 (14.3) | 5 (7.9) | 5 (7.9) | 37 (58.7) | - |
| - | 21-30 | 10 (2.6) | 10 (2.6) | 13 (3.4) | 16 (4.2) | 25 (6.6) | 26 (6.8) | 33 (8.7) | 58 (15.3) | 53 (13.9) | 136 (35.8) | - |
| - | 31-40 | 4 (11.1) | 1 (2.8) | 2 (5.6) | 2 (5.6) | 2 (5.6) | 1 (2.8) | 5 (13.9) | 6 (16.7) | 6 (16.7) | 7 (19.4) | - |
| - | 41-50 | 3 (30.0) | 1 (10.0) | 0 (0.0) | 1 (10.0) | 1 (10.0) | 1 (10.0) | 0 (0.0) | 3 (30.0) | 0 (0.0) | 0 (0.0) | - |
| - | 51-60 | 1 (33.3) | 0 (0.0) | 1 (33.3) | 0 (0.0) | 0 (0.0) | 0 (0.0) | 0 (0.0) | 0 (0.0) | 0 (0.0) | 1 (33.3) | - |
| Continent | North America | 1 (11.1) | 1 (11.1) | 0 (0.0) | 0 (0.0) | 0 (0.0) | 3 (33.3) | 1 (11.1) | 1 (11.1) | 0 (0.0) | 2 (22.2) | <0.0001* |
| - | Latin America | 3 (2.8) | 2 (1.9) | 1 (0.9) | 2 (1.9) | 5 (4.7) | 5 (4.7) | 6 (5.7) | 14 (13.2) | 15 (14.2) | 53 (50.0) | - |
| - | Brazil | 9 (3.3) | 3 (1.1) | 7 (2.5) | 9 (3.3) | 12 (4.3) | 10 (3.6) | 24 (8.7) | 40 (14.5) | 40 (14.5) | 122 (44.2) | - |
| - | Europe | 7 (5.6) | 9 (7.2) | 11 (8.8) | 10 (8.0) | 17 (13.6) | 16 (12.8) | 18 (14.4) | 18 (14.4) | 9 (7.2) | 10 (8.0) | - |
| Course | Undergraduate | 9 (2.4) | 9 (2.4) | 11 (3.0) | 10 (2.7) | 24 (6.5) | 22 (6.0) | 30 (8.1) | 52 (14.1) | 43 (11.7) | 159 (43.1) | - |
| - | Master’s Degree | 3 (4.8) | 1 (1.6) | 3 (4.8) | 7 (11.3) | 6 (9.7) | 5 (8.1) | 7 (11.3) | 9 (14.5) | 13 (21.0) | 8 (12.9) | - |
| - | Doctorate | 3 (6.7) | 2 (4.4) | 1 (2.2) | 2 (4.4) | 2 (4.4) | 2 (4.4) | 8 (17.8) | 10 (22.2) | 5 (11.1) | 10 (22.2) | - |
| - | Post-doctorate | 3 (37.5) | 1 (12.5) | 1 (12.5) | 0 (0.0) | 0 (0.0) | 0 (0.0) | 1 (12.5) | 1 (12.5) | 0 (0.0) | 1 (12.5) | - |
| - | Especialization | 1 (5.0) | 1 (5.0) | 3 (15.0) | 2 (10.0) | 1 (5.0) | 3 (15.0) | 1 (5.0) | 1 (5.0) | 2 (10.0) | 5 (25.0) | - |
| - | Resident | 1 (16.7) | 0 (0.0) | 0 (0.0) | 0 (0.0) | 1 (16.7) | 2 (33.3) | 1 (16.7) | 0 (0.0) | 0 (0.0) | 1 (16.7) | - |
| - | Total | 20 (3.9) | 14 (2.7) | 19 (3.7) | 21 (4.1) | 34 (6.7) | 34 (6.7) | 48 (9.4) | 73 (14.3) | 63 (12.4) | 184 (36.1) | 516 (100.0) |
| - | Question | What is your anxiety/stress level with distance classes/activities (how do I feel about remote lectures): # | - | - | - | - | - | - | - | - | - | - |
| Variables | - | 1 | 2 | 3 | 4 | 5 | 6 | 7 | 8 | 9 | 10 | - |
| Sex | Female | 28 (8.5) | 30 (9.1) | 35 (10.7) | 27 (8.2) | 31 (9.5) | 40 (12.2) | 36 (11.0) | 36 (11.0) | 28 (8.5) | 37 (11.3) | 0.71** |
| - | Male | 16 (13.9) | 17 (14.8) | 13 (11.3) | 11 (9.6) | 10 (8.7) | 9 (7.8) | 18 (15.7) | 12 (10.4) | 3 (2.6) | 6 (5.2) | - |
| Age | No answer | 4 (17.4) | 3 (13.0) | 4 (17.4) | 1 (4.3) | 2 (8.7) | 1 (4.3) | 2 (8.7) | 3 (13.0) | 2 (8.7) | 1 (4.3) | 0.001* |
| - | 11-20 | 1 (1.7) | 3 (5.0) | 4 (6.7) | 2 (3.3) | 3 (5.0) | 5 (8.3) | 12 (21.7) | 9 (15.0) | 10 (16.7) | 10 (16.7) | - |
| - | 21-30 | 34 (10.6) | 33 (10.2) | 37 (11.5) | 30 (9.3) | 34 (10.6) | 38 (11.8) | 38 (11.8) | 30 (9.3) | 15 (5.0) | 32 (9.9) | - |
| - | 31-40 | 4 (12.5) | 8 (25.0) | 3 (9.4) | 2 (6.3) | 2 (6.3) | 4 (12.5) | 1 (3.1) | 5 (15.6) | 2 (6.3) | 1 (3.1) | - |
| - | 41-50 | 1 (14.3) | 0 (0.0) | 0 (0.0) | 3 (42.9) | 0 (0.0) | 1 (14.3) | 0 (0.0) | 1 (14.3) | 1 (14.3) | 0 (0.0) | - |
| - | 51-60 | 1 (100.0) | 0 (0.0) | 0 (0.0) | 0 (0.0) | 0 (0.0) | 0 (0.0) | 0 (0.0) | 0 (0.0) | 0 (0.0) | 0 (0.0) | - |
| Continent | North America | 1 (14.3) | 2 (28.6) | 0 (0.0) | 0 (0.0) | 1 (14.3) | 2 (28.6) | 0 (0.0) | 1 (14.3) | 0 (0.0) | 0 (0.0) | <0.0001* |
| - | Latin America | 3 (3.3) | 4 (4.4) | 8 (8.8) | 5 (5.5) | 13 (14.3) | 10 (11.0) | 10 (11.0) | 12 (13.2) | 12 (13.2) | 14 (15.4) | - |
| - | Brazil | 13 (5.7) | 17 (7.5) | 22 (9.6) | 15 (6.6) | 22 (9.6) | 27 (11.8) | 36 (15.8) | 29 (12.7) | 18 (7.9) | 28 (12.7) | - |
| - | Europe | 27 (23.5) | 24 (20.2) | 18 (15.1) | 18 (15.1) | 5 (4.2) | 10 (8.4) | 8 (6.7) | 6 (5.0) | 1 (0.8) | 1 (0.8) | - |
| Course | Undergraduate | 25 (8.1) | 24 (7.7) | 29 (9.4) | 28 (9.0) | 27 (8.7) | 36 (11.6) | 38 (12.3) | 38 (12.3) | 25 (8.1) | 40 (12.9) | 0.023* |
| - | Master’s Degree | 8 (13.6) | 10 (16.9) | 9 (15.3) | 5 (8.5) | 6 (10.2) | 4 (6.8) | 8 (13.6) | 7 (11.9) | 1 (1.7) | 1 (1.7) | - |
| - | Doctorate | 6 (15.0) | 8 (20.0) | 7 (17.5) | 1 (2.5) | 6 (15.0) | 4 (10.0) | 3 (7.5) | 1 (2.5) | 2 (5.0) | 2 (5.0) | - |
| - | Post-doctorate | 1 (16.7) | 1 (16.7) | 1 (16.7) | 2 (33.3) | 0 (0.0) | 0 (0.0) | 1 (16.7) | 0 (0.0) | 0 (0.0) | 0 (0.0) | - |
| - | Especialization | 4 (21.1) | 3 (15.8) | 2 (10.5) | 1 (5.3) | 0 (0.0) | 3 (15.8) | 3 (15.8) | 0 (0.0) | 2 (10.5) | 1 (5.3) | - |
| - | Resident | 1 (16.7) | 1 (16.7) | 0 (0.0) | 1 (16.7) | 1 (16.7) | 2 (33.3) | 0 (0.0) | 0 (0.0) | 0 (0.0) | 0 (0.0) | - |
| - | Total | 45 (10.2) | 47 (10.7) | 48 (10.9) | 38 (8.6) | 40 (9.1) | 49 (11.1) | 53 (12.0) | 46 (10.5) | 30 (6.8) | 44 (10.0) | 440 (100.0) |
| - | Question | About the teaching/learning process in lessons/online activities, what is your understanding of the lesson content): # | - | - | - | - | - | - | - | - | - | - |
| Variables | - | 1 | 2 | 3 | 4 | 5 | 6 | 7 | 8 | 9 | 10 | - |
| Sex | Female | 3 (0.9) | 11 (3.4) | 16 (4.9) | 20 (6.1) | 39 (11.9) | 31 (9.5) | 56 (17.1) | 73 (22.3) | 48 (14.6) | 31 (9.5) | 0.980* |
| - | Male | 0 (0.0) | 2 (1.7) | 5 (4.3) | 8 (7.0) | 14 (12.2) | 15 (13.0) | 18 (15.7) | 27 (23.5) | 17 (14.8) | 9 (7.8) | - |
| Age | No answer | 0 (0.0) | 3 (13.0) | 4 (17.4) | 0 (0.0) | 5 (21.7) | 2 (8.7) | 3 (13.0) | 3 (13.0) | 1 (4.3) | 2 (8.7) | 0.700* |
| - | 11-20 | 1 (1.7) | 1 (1.7) | 4 (6.7) | 7 (11.7) | 7 (11.7) | 8 (13.3) | 6 (10.0) | 12 (21.7) | 11 (18.3) | 2 (3.3) | - |
| - | 21-30 | 2 (0.6) | 8 (2.5) | 13 (4.0) | 21 (6.5) | 41 (12.7) | 31 (9.6) | 56 (17.7) | 75 (23.3) | 43 (13.4) | 31 (9.6) | - |
| - | 31-40 | 0 (0.0) | 1 (3.1) | 0 (0.0) | 0 (0.0) | 0 (0.0) | 4 (12.5) | 6 (18.8) | 7 (21.9) | 11 (34.4) | 3 (9.4) | - |
| - | 41-50 | 0 (0.0) | 0 (0.0) | 0 (0.0) | 0 (0.0) | 0 (0.0) | 1 (14.3) | 2 (28.6) | 2 (28.6) | 0 (0.0) | 2 (28.6) | - |
| - | 51-60 | 0 (0.0) | 0 (0.0) | 0 (0.0) | 0 (0.0) | 0 (0.0) | 0 (0.0) | 0 (0.0) | 0 (0.0) | 0 (0.0) | 1 (100.0) | - |
| Continent | North America | 0 (0.0) | 0 (0.0) | 1 (14.3) | 0 (0.0) | 1 (14.3) | 1 (14.3) | 2 (28.6) | 2 (28.6) | 0 (0.0) | 0 (0.0) | 0.063* |
| - | Latin America | 0 (0.0) | 0 (0.0) | 1 (1.1) | 5 (5.5) | 14 (15.4) | 11 (12.1) | 17 (18.7) | 20 (22.0) | 14 (15.4) | 9 (9.9) | - |
| - | Brazil | 3 (1.3) | 8 (3.5) | 14 (6.1) | 20 (8.8) | 30 (13.2) | 23 (10.1) | 38 (16.7) | 38 (16.7) | 34 (15.4) | 19 (8.3) | - |
| - | Europe | 0 (0.0) | 5 (4.2) | 5 (4.2) | 3 (2.5) | 8 (6.7) | 11 (9.2) | 17 (14.3) | 39 (33.6) | 17 (14.3) | 13 (10.9) | - |
| Course | Undergraduate | 3 (1.0) | 9 (2.9) | 14 (4.5) | 25 (8.1) | 40 (12.9) | 35 (11.3) | 52 (16.8) | 68 (21.9) | 41 (13.2) | 23 (7.4) | 0.650* |
| - | Master’s Degree | 0 (0.0) | 3 (5.1) | 6 (10.2) | 1 (1.7) | 4 (6.8) | 4 (6.8) | 13 (22.0) | 14 (23.7) | 10 (16.9) | 4 (6.8) | - |
| - | Doctorate | 0 (0.0) | 1 (2.5) | 0 (0.0) | 1 (2.5) | 2 (5.0) | 2 (5.0) | 4 (10.0) | 9 (22.5) | 11 (27.5) | 10 (25.0) | - |
| - | Post-doctorate | 0 (0.0) | 0 (0.0) | 1 (16.7) | 0 (0.0) | 0 (0.0) | 0 (0.0) | 2 (33.3) | 3 (50.0) | 0 (0.0) | 0 (0.0) | - |
| - | Especialization | 0 (0.0) | 0 (0.0) | 0 (0.0) | 1 (5.3) | 3 (15.8) | 4 (21.1) | 2 (10.5) | 3 (15.8) | 2 (10.5) | 4 (21.1) | - |
| - | Resident | 0 (0.0) | 0 (0.0) | 0 (0.0) | 0 (0.0) | 3 (50.0) | 1 (16.7) | 1 (16.7) | 1 (16.7) | 0 (0.0) | 0 (0.0) | - |
| - | Total | 3 (0.7) | 13 (3.0) | 21 (4.8) | 28 (6.4) | 52 (11.8) | 46 (10.5) | 74 (16.8) | 98 (22.3) | 64 (14.5) | 41 (9.3) | 440 (100.0) |
Bold values mean different from others within the groups
* according to Fisher's exact (comparisons were made vertically)
** according to Chi-square test (comparisons were made vertically)
# only answered participants who were taking distance learning
Table 3 Digital devices and synchronous/asynchronous technologies used by professors for remote lectures.
| Devices for recording lessons#$ | - | - | - | - | - | - | - | - | - | ||||
|---|---|---|---|---|---|---|---|---|---|---|---|---|---|
| Variables | - | Photographic camera | Mobile device | I didn't record classes | PowerPoint | Videoconferencing services | Webcam | Others | p-value | ||||
| Continent | Nort America | 1 (2.6) | 6 (15.4) | 4 (10.3) | 0 (0.0) | 7 (17.9) | 21 (53.8) | 0 (0.0) | <0.0001* | ||||
| - | Latin America | 9 (9.8) | 23 (25.0) | 4 (4.3) | 0 (0.0) | 7 (7.6) | 45 (48.9) | 4 (4.3) | - | ||||
| - | Brazil | 7 (1.8) | 42 (10.6) | 32 (8.0) | 5 (1.3) | 147 (36.9) | 164 (41.2) | 1 (0.3) | - | ||||
| - | Europe | 1 (1.9) | 4 (7.4) | 6 (11.1) | 0 (0.0) | 4 (7.4) | 39 (72.2) | 0 (0.0) | - | ||||
| - | Asia/Oceania/Middle East | 0 (0.0) | 1 (11.1) | 0 (0.0) | 0 (0.0) | 2 (22.2) | 6 (66.7) | 0 (0.0) | - | ||||
| University | Comunitary | 2 (10.0) | 4 (20.0) | 0 (0.0) | 0 (0.0) | 8 (40.0) | 6 (30.0) | 0 (0.0) | 0.070* | ||||
| - | Private | 8 (3.6) | 30 (13.6) | 11 (5.0) | 1 (0.5) | 70 (31.7) | 98 (44.3) | 3 (1.4) | - | ||||
| - | Public | 6 (2.2) | 32 (11.5) | 32 (11.5) | 4 (1.4) | 71 (25.4) | 134 (48.0) | 0 (0.0) | - | ||||
| - | Publica & private | 2 (2.8) | 10 (13.9) | 3 (4.2) | 0 (0.0) | 18 (25.0) | 37 (51.4) | 2 (2.8) | - | ||||
| - | Total | 18 (3.0) | 76 (12.8) | 46 (7.8) | 5 (0.8) | 167 (28.2) | 275 (46.5) | 5 (0.8) | 592 (100.0) | ||||
| Synchronous/asynchronous technologies used for lessons#$ | - | - | - | - | - | - | - | ||||||
| Variables | - | University platform | Hosting services | Videoconference services | I didn't use | Others | - | ||||||
| Continent | Nort America | 2 (4.9) | 12 (29.3) | 26 (63.4) | 1 (2.4) | 0 (0.0) | <0.0001* | ||||||
| - | Latin America | 33 (30.8) | 13 (12.1) | 59 (55.1) | 0 (0.0) | 2 (1.9) | - | ||||||
| - | Brazil | 85 (26.1) | 5 (1.5) | 236 (72.4) | 0 (0.0) | 0 (0.0) | - | ||||||
| - | Europe | 2 (3.9) | 2 (3.9) | 46 (90.2) | 1 (2.0) | 0 (0.0) | - | ||||||
| - | Asia/Oceania/Middle East | 0 (0.0) | 1 (14.3) | 6 (85.7) | 0 (0.0) | 0 (0.0) | - | ||||||
| University | Comunitary | 3 (23.1) | 2 (15.4) | 8 (61.5) | 0 (0.0) | 0 (0.0) | 0.001* | ||||||
| - | Private | 65 (32.8) | 7 (3.5) | 125 (63.1) | 1 (0.5) | 0 (0.0) | - | ||||||
| - | Public | 42 (16.5) | 19 (7.5) | 192 (75.3) | 1 (0.4) | 1 (0.4) | - | ||||||
| - | Publica & private | 12 (18.2) | 5 (7.6) | 48 (72.7) | 0 (0.0) | 1 (1.5) | - | ||||||
| - | Total | 122 (22.9) | 33 (6.2) | 373 (70.1) | 2 (0.4) | 2 (0.4) | 532 (100.0) | ||||||
| Technologies for solving questions#$ | - | - | - | - | - | - | - | - | - | ||||
| Variables | - | Text messages Applications | Discussion forums | Survey services | University platform | Videoconferece | I didn't answer questions | - | |||||
| Continent | Nort America | 1 (1.6) | 23 (37.7) | 3 (4.9) | 1 (1.6) | 11 (18.0) | 22 (36.1) | 0 (0.0) | <0.0001* | ||||
| - | Latin America | 39 (21.2) | 49 (26.6) | 12 (6.5) | 8 (4.3) | 34 (18.5) | 42 (22.8) | 0 (0.0) | - | ||||
| - | Brazil | 143 (27.0) | 163 (30.8) | 3 (0.6) | 1 (0.2) | 36 (6.8) | 177 (33.5) | 6 (1.1) | - | ||||
| - | Europe | 7 (7.5) | 38 (40.9) | 2 (2.2) | 1 (1.1) | 13 (14.0) | 31 (33.3) | 1 (1.1) | - | ||||
| - | Asia/Oceania/Middle East | 1 (7.1) | 4 (28.6) | 2 (14.3) | 1 (7.1) | 2 (14.3) | 4 (28.6) | 0 (0.0) | - | ||||
| University | Comunitary | 8 (34.8) | 8 (34.8) | 0 (0.0) | 0 (0.0) | 2 (8.7) | 5 (21.7) | 0 (0.0) | 0.274* | ||||
| - | Private | 75 (23.5) | 89 (27.9) | 6 (1.9) | 4 (1.3) | 46 (14.4) | 99 (31.0) | 0 (0.0) | - | ||||
| - | Public | 83 (19.9) | 143 (34.2) | 9 (2.2) | 5 (1.2) | 37 (8.9) | 135 (32.3) | 6 (1.4) | - | ||||
| - | Publica & private | 25 (20.7) | 37 (30.6) | 7 (5.8) | 3 (2.5) | 11 (9.1) | 37 (30.6) | 1 (0.8) | - | ||||
| - | Total | 191 (21.7) | 277 (31.4) | 22 (2.5) | 12 (1.4) | 96 (10.9) | 276 (31.3) | 7 (0.8) | 881 (100.0) | ||||
| Activity submission tools #$ | - | - | - | - | - | - | - | - | - | - | |||
| Variables | - | Text messages Applications | Survey services | Cloud storage services | Online Quiz Services | University platform | Others | I didn't send activities | - | ||||
| Continent | North America | 0 (0.0) | 15 (33.3) | 1 (2.2) | 6 (13.3) | 1 (2.2) | 19 (42.2) | 0 (0.0) | 3 (6.7) | <0.0001* | |||
| - | Latin America | 0 (0.0) | 38 (27.3) | 9 (6.5) | 24 (17.3) | 19 (13.7) | 47 (33.8) | 1 (0.7) | 1 (0.7) | - | |||
| - | Asia/Oceania/Middle East | 3 (0.7) | 109 (26.7) | 60 (14.7) | 40 (9.8) | 3 (0.7) | 177 (43.3) | 1 (0.2) | 16 (3.9) | - | |||
| - | Brazil | 0 (0.0) | 28 (38.9) | 5 (6.9) | 4 (5.6) | 3 (4.2) | 29 (40.3) | 0 (0.0) | 3 (4.2) | - | |||
| - | Europe | 0 (0.0) | 6 (35.3) | 3 (17.6) | 2 (11.8) | 3 (17.6) | 3 (17.6) | 0 (0.0) | 0 (0.0) | - | |||
| University | Comunitary | 0 (0.0) | 6 (35.3) | 2 (11.8) | 2 (11.8) | 0 (0.0) | 7 (41.2) | 0 (0.0) | 0 (0.0) | 0.002* | |||
| - | Private | 0 (0.0) | 60 (25.2) | 28 (11.8) | 24 (10.1) | 10 (4.2) | 114 (47.9) | 1 (0.4) | 1 (0.4) | - | |||
| - | Public | 2 (0.6) | 101 (31.0) | 38 (11.7) | 34 (10.4) | 9 (2.8) | 120 (36.8) | 1 (0.3) | 21 (6.4) | - | |||
| - | Publica & private | 1 (1.0) | 29 (28.7) | 10 (9.9) | 16 (15.8) | 10 (9.9) | 34 (33.7) | 0 (0.0) | 1 (1.0) | - | |||
| - | Total | 3 (0.4) | 196 (28.7) | 78 (11.4) | 76 (11.1) | 29 (4.3) | 275 (40.3) | 2 (0.3) | 23 (3.4) | 682 (100.0) | |||
| Assessment submission technologies #$ | - | - | - | - | - | - | - | - | |||||
| Variables | - | Survey services | Cloud storage services | University platform | Others | I didn't assess | - | ||||||
| Continent | North America | 5 (14.3) | 7 (20.0) | 0 (0.0) | 18 (51.4) | 1 (2.9) | 4 (11.4) | 0.111* | |||||
| - | Latin America | 14 (16.5) | 14 (16.5) | 5 (5.9) | 47 (55.3) | 0 (0.0) | 5 (5.9) | - | |||||
| - | Asia/Oceania/Middle East | 3 (37.5) | 2 (25.0) | 0 (0.0) | 3 (37.5) | 0 (0.0) | 0 (0.0) | - | |||||
| - | Brazil | 43 (13.3) | 69 (21.3) | 10 (3.1) | 153 (47.2) | 0 (0.0) | 49 (15.1) | - | |||||
| - | Europe | 17 (28.3) | 8 (13.3) | 1 (1.7) | 26 (43.3) | 3 (5.0) | 5 (8.3) | - | |||||
| University | Comunitary | 2 (15.4) | 3 (23.1) | 1 (7.7) | 7 (53.8) | 0 (0.0) | 0 (0.0) | <0.0001* | |||||
| - | Private | 18 (10.2) | 34 (19.3) | 5 (2.8) | 112 (63.6) | 0 (0.0) | 7 (4.0) | - | |||||
| - | Public | 47 (18.7) | 46 (18.3) | 7 (2.8) | 95 (37.8) | 3 (1.2) | 53 (21.1) | - | |||||
| - | Publica & private | 15 (20.8) | 17 (23.6) | 3 (4.2) | 33 (45.8) | 1 (1.4) | 3 (4.2) | - | |||||
| - | Total | 82 (16.0) | 100 (19.5) | 16 (3.1) | 247 (48.2) | 8 (1.6) | 63 (12.3) | 512 (100.0) | |||||
Bold values mean different from others within the groups.
according to Fisher's exact (comparisons were made vertically).
** according to Chi-square test (comparisons were made vertically).
# only the participants who were taking distance learning.
$ Participants could mark more than one response when using more than one technology; thus, the total overpasses the number of participants.
Table 4 Digital devices for access to lessons, technologies used to ask questions and to send activities by students.
| Devices used for online activities #$ | - | - | Mobile device | Computer/notebook | - | Tablet | - | p-value | ||||
|---|---|---|---|---|---|---|---|---|---|---|---|---|
| Variables | - | - | - | - | - | - | - | - | ||||
| Continent | North America | - | 6 (42.9) | 7 (50.0) | - | 1 (7.1) | - | <0.0001* | ||||
| - | Latin America | - | 40 (25.8) | 88 (56.8) | - | 27 (17.4) | - | - | ||||
| - | Brazil | - | 135 (36.6) | 220 (59.6) | - | 14 (3.8) | - | - | ||||
| - | Europe | - | 44 (24.3) | 113 (62.4) | - | 24 (13.3) | - | - | ||||
| - | Total | - | 225 (31.3) | 428 (59.5) | - | 66 (9.2) | - | 719 (100.0) | ||||
| Technologies used for solving questions #$ | - | - | - | - | - | - | - | - | ||||
| Variables | - | Text message applications | Discussion forums | Survey services | Videoconference | University platform | I didn't solve doubts with professors | p-value | ||||
| Continent | North America | 2 (11.8) | 5 (29.4) | 0 (0.0) | 0 (0.0) | 1 (5.9) | 9 (52.9) | 0 (0.0) | <0.0001* | |||
| - | Latin America | 46 (19.1) | 49 (20.3) | 15 (6.2) | 9 (3.7) | 23 (9.5) | 98 (40.7) | 1 (0.4) | - | |||
| - | Brazil | 100 (23.4) | 104 (24.4) | 3 (0.7) | 8 (1.9) | 17 (4.0) | 169 (39.6) | 26 (6.1) | - | |||
| - | Europe | 24 (9.4) | 60 (23.5) | 10 (3.9) | 4 (1.6) | 18 (7.1) | 132 (51.8) | 7 (2.7) | - | |||
| University | Private | 46 (22.7) | 44 (21.7) | 8 (3.9) | 3 (1.5) | 84 (40.4) | 15 (6.9) | 6 (3.0) | 0.542* | |||
| - | Public | 126 (17.3) | 174 (23.8) | 20 (2.7) | 18 (2.5) | 324 (43.9) | 44 (5.9) | 28 (3.8) | ||||
| - | Total | 172 (18.3) | 218 (23.2) | 28 (3.0) | 21 (2.2) | 408 (43.4) | 59 (6.3) | 34 (3.6) | 940 (100.0) | |||
| Technologies for evaluation activities #$ | - | - | - | - | - | - | - | |||||
| Variables | - | Survey services | Cloud storage services | Quiz services | University platform | I didn't do evaluation activities | p-value | |||||
| Continent | North America | 3 (23.1) | 3 (23.1) | 2 (15.4) | 1 (7.7) | 4 (30.8) | 0 (0.0) | <0.0001* | ||||
| - | Latin America | 57 (31.0) | 20 (10.9) | 21 (11.4) | 28 (15.2) | 55 (29.9) | 3 (1.6) | - | ||||
| - | Brazil | 101 (28.5) | 74 (20.9) | 23 (6.5) | 8 (2.3) | 104 (29.4) | 44 (12.4) | - | ||||
| - | Europe | 60 (37.0) | 21 (13.0) | 17 (10.5) | 6 (3.7) | 35 (21.6) | 23 (14.2) | - | ||||
| University | Private | 44 (25.3) | 28 (15.5) | 20 (11.5) | 10 (5.2) | 72 (41.4) | 2 (1.1) | <0.0001** | ||||
| - | Public | 177 (33.1) | 90 (16.7) | 43 (7.9) | 33 (6.0) | 126 (23.5) | 68 (12.8) | - | ||||
| - | Total | 221 (31.0) | 118 (16.5) | 63 (8.8) | 43 (6.0) | 198 (27.8) | 70 (9.8) | 713 (100.0) | ||||
Bold values mean different from others within the groups.
according to Fisher's exact (comparisons were made vertically).
** according to Chi-square test (comparisons were made vertically). # only participants who were taking distance learning.
$ participants could score more than one answer when using more than one technologie; thus, the total exceeds the number of participants.
Table 5 Online communication technologies that could be used when returning to face-to-face classes for professors and students.
| - | - | Professors | - | - | - | - | - | - | - |
|---|---|---|---|---|---|---|---|---|---|
| - | - | Technologies#$ | - | - | - | - | - | - | - |
| Variables | - | Online Meetings | Survey services | Cloud storage services | Quizzing services | University platform | None | p-value | |
| Sex | Female | 39 (8.7) | 154 (34.5) | 70 (15.7) | 52 (11.7) | 21 (4.7) | 103 (23.1) | 7 (1.6) | 0.109** |
| - | Male | 53 (14.1) | 112 (29.9) | 53 (14.1) | 43 (11.5) | 13 (3.5) | 91 (24.3) | 10 (2.7) | - |
| Age | No answer | 28 (23.3) | 23 (19.2) | 12 (10.0) | 15 (12.5) | 9 (7.5) | 32 (26.7) | 1 (0.8) | 0.298* |
| 21-30 | 4 (10.5) | 14 (36.8) | 7 (18.4) | 4 (10.5) | 1 (2.6) | 6 (15.8) | 2 (5.3) | - | |
| - | 31-40 | 23 (9.3) | 80 (32.5) | 43 (17.5) | 27 (11.0) | 9 (3.7) | 59 (24.0) | 5 (2.0) | - |
| - | 41-50 | 13 (5.5) | 83 (35.3) | 36 (15.3) | 32 (13.6) | 12 (5.1) | 55 (23.4) | 4 (1.7) | - |
| - | 51-60 | 17 (12.1) | 54 (38.6) | 21 (15.0) | 14 (10.0) | 2 (1.4) | 30 (21.4) | 2 (1.4) | - |
| - | 61-70 | 7 (19.4) | 9 (25.0) | 3 (8.3) | 3 (8.3) | 1 (2.8) | 10 (27.8) | 3 (8.3) | - |
| - | 71-80 | 0 (0.0) | 3 (50.0) | 1 (16.7) | 0 (0.0) | 0 (0.0) | 2 (33.3) | 0 (0.0) | - |
| Continent | North America | 18 (28.1) | 12 (18.8) | 4 (6.3) | 8 (12.5) | 4 (6.3) | 18 (28.1) | 0 (0.0) | <0.0001* |
| - | Latin America | 36 (18.8) | 35 (18.3) | 20 (10.5) | 34 (17.8) | 20 (10.5) | 45 (23.6) | 1 (0.5) | - |
| - | Brazil | 2 (0.4) | 188 (41.5) | 92 (20.3) | 51 (11.3) | 3 (0.7) | 103 (22.7) | 14 (3.1) | - |
| - | Europe | 31 (32.3) | 28 (29.2) | 4 (4.2) | 2 (2.1) | 4 (4.2) | 25 (26.0) | 2 (2.1) | - |
| - | Asia/Oceania/Middle East | 5 (29.4) | 3 (17.6) | 3 (17.6) | 0 (0.0) | 3 (17.6) | 3 (17.6) | 0 (0.0) | - |
| University | Comunitary | 0 (0.0) | 7 (46.7) | 4 (26.7) | 2 (13.3) | 0 (0.0) | 2 (13.3) | 0 (0.0) | 0.270* |
| - | Private | 20 (7.7) | 80 (30.9) | 43 (16.6) | 31 (12.0) | 12 (4.6) | 67 (25.9) | 6 (2.3) | - |
| - | Public | 51 (12.1) | 142 (33.6) | 62 (14.7) | 43 (10.2) | 14 (3.3) | 100 (23.7) | 10 (2.4) | - |
| - | Publica & private | 21 (16.8) | 37 (29.6) | 14 (11.2) | 19 (15.2) | 8 (6.4) | 25 (20.0) | 1 (0.8) | - |
| - | Total | 92 (11.2) | 266 (32.4) | 123 (15.0) | 95 (11.6) | 34 (4.1) | 194 (23.6) | 17 (2.1) | 821 (100.0) |
| - | - | Students | - | - | - | - | - | - | - |
| Sex | Female | 118 (16.3) | 186 (25.7) | 103 (14.2) | 83 (11.5) | 47 (6.5) | 152 (21.1) | 34 (4.7) | 0.706** |
| - | Male | 47 (18.5) | 69 (27.2) | 34 (13.4) | 35 (13.4) | 11 (4.3) | 47 (18.1) | 13 (5.1) | - |
| Age | No answer | 8 (16.3) | 15 (30.6) | 9 (18.4) | 3 (6.1) | 2 (4.1) | 11 (22.4) | 1 (2.0) | 0.400* |
| - | 21-30 | 27 (20.8) | 28 (21.5) | 18 (13.8) | 10 (7.7) | 8 (6.2) | 28 (21.5) | 11 (8.5) | - |
| - | 31-40 | 117 (16.5) | 183 (25.8) | 96 (13.5) | 95 (13.4) | 43 (6.1) | 143 (20.1) | 33 (4.6) | - |
| - | 41-50 | 11 (16.7) | 22 (33.3) | 10 (15.2) | 6 (9.1) | 2 (3.0) | 14 (21.2) | 1 (1.5) | - |
| - | 51-60 | 1 (4.5) | 6 (27.3) | 4 (18.2) | 4 (18.2) | 3 (13.6) | 3 (13.6) | 1 (4.5) | - |
| - | 61-70 | 1 (50.0) | 1 (50.0) | 0 (0.0) | 0 (0.0) | 0 (0.0) | 0 (0.0) | 0 (0.0) | - |
| Continent | North America | 5 (22.7) | 4 (18.2) | 5 (22.7) | 2 (9.1) | 1 (4.5) | 5 (22.7) | 0 (0.0) | <0.0001* |
| - | Latin America | 54 (20.9) | 63 (24.4) | 22 (8.5) | 29 (11.2) | 35 (13.6) | 55 (21.3) | 0 (0.0) | - |
| - | Brazil | 28 (6.4) | 124 (28.5) | 90 (20.7) | 45 (10.3) | 12 (2.8) | 97 (22.3) | 39 (9.0) | - |
| - | Europe | 78 (29.5) | 64 (24.2) | 20 (7.6) | 42 (15.9) | 10 (3.8) | 42 (15.9) | 8 (3.0) | - |
| University | Private | 24 (11.5) | 52 (25.5) | 30 (14.5) | 17 (8.0) | 14 (6.5) | 54 (26.5) | 15 (7.5) | 0.016** |
| - | Public | 141 (18.2) | 203 (26.4) | 107 (13.7) | 101 (13.0) | 44 (5.6) | 145 (18.8) | 32 (4.2) | - |
| - | Total | 165 (16.9) | 255 (26.0) | 137 (14.0) | 118 (12.1) | 58 (5.9) | 199 (20.3) | 47 (4.8) | 979 (100.0) |
Bold values mean different from others within the groups.
according to Fisher’s exact (comparisons were made vertically).
** according to Chi-square test (comparisons were made vertically). # only participants who were taking distance learning.
$ participants could score more than one answer when using more than one technology; thus, the total exceeds the number of participants.
Table 6 Difficulties and benefits related to distance lectures/activities for professors.
| Difficulties #$ | - | - | - | - | - | - | - | - | - | - | - | |||||||
|---|---|---|---|---|---|---|---|---|---|---|---|---|---|---|---|---|---|---|
| - | - | Internet access | Low student participation | Difficulty recording classes | Difficulty in synthesizing lessons' content | Lack of knowledge of videoconferencing technologies | Lack of interaction with students | Lack of motivation to prepare online lessons | Others& | I didn't have difficulties | p-value | |||||||
| Sex | Female | 82 (17.7) | 76 (16.5) | 25 (5.4) | 33 (7.1) | 80 (17.3) | 114 (24.7) | 17 (3.7) | 8 (1.6) | 27 (5.8) | 0.309** | |||||||
| - | Male | 52 (14.2) | 68 (18.6) | 19 (5.2) | 31 (8.5) | 46 (12.6) | 95 (26.0) | 19 (5.2) | 7 (2.0) | 28 (7.7) | ||||||||
| Age | No answer | 21 (18.6) | 21 (18.6) | 8 (7.1) | 8 (7.1) | 11 (9.7) | 29 (25.7) | 7 (6.2) | 2 (1.8) | 6 (5.3) | 0.011* | |||||||
| - | 21-30 | 7 (16.7) | 12 (28.6) | 2 (4.8) | 1 (2.4) | 3 (7.1) | 14 (33.3) | 2 (4.8) | 1 (2.4) | 0 (0.0) | - | |||||||
| - | 31-40 | 42 (15.5) | 52 (19.2) | 12 (4.4) | 26 (9.6) | 34 (12.5) | 73 (26.9) | 16 (5.9) | 4 (1.5) | 12 (4.4) | - | |||||||
| - | 41-50 | 36 (16.7) | 34 (15.8) | 9 (4.2) | 17 (7.9) | 35 (16.3) | 53 (24.7) | 8 (3.7) | 5 (2.3) | 18 (8.4) | - | |||||||
| - | 51-60 | 22 (15.1) | 23 (15.8) | 7 (4.8) | 9 (6.2) | 32 (21.9) | 36 (24.7) | 2 (1.4) | 3 (2.1) | 12 (8.2) | - | |||||||
| - | 61-70 | 5 (15.2) | 2 (6.1) | 5 (15.2) | 3 (9.1) | 8 (24.2) | 3 (9.1) | 1 (3.0) | 0 (0.0) | 6 (18.2) | - | |||||||
| - | 71-80 | 1 (14.3) | 0 (0.0) | 1 (14.3) | 0 (0.0) | 3 (42.9) | 1 (14.3) | 0 (0.0) | 0 (0.0) | 1 (14.3) | - | |||||||
| Continent | North America | 8 (13.6) | 10 (16.9) | 6 (10.2) | 2 (3.4) | 7 (11.9) | 19 (32.2) | 4 (6.8) | 0 (0.0) | 3 (5.1) | 0.007* | |||||||
| - | Latin America | 36 (23.4) | 22 (14.3) | 7 (4.5) | 20 (13.0) | 20 (13.0) | 35 (22.7) | 4 (2.6) | 5 (3.1) | 5 (3.2) | - | |||||||
| - | Asia/Oceania/Middle East | 4 (28.6) | 3 (21.4) | 0 (0.0) | 1 (7.1) | 0 (0.0) | 4 (28.6) | 1 (7.1) | 0 (0.0) | 1 (7.1) | - | |||||||
| - | Brazil | 77 (14.7) | 98 (18.7) | 28 (5.3) | 39 (7.4) | 88 (16.8) | 129 (24.6) | 26 (5.0) | 7 (1.4) | 32 (6.1) | - | |||||||
| - | Europe | 9 (11.8) | 11 (14.5) | 3 (3.9) | 2 (2.6) | 11 (14.5) | 22 (28.9) | 1 (1.3) | 3 (3.9) | 14 (18.4) | - | |||||||
| University | Comunitary | 2 (10.5) | 4 (21.1) | 1 (5.3) | 2 (10.5) | 4 (21.1) | 4 (21.1) | 1 (5.3) | 0 (0.0) | 1 (5.3) | 0.698* | |||||||
| - | Private | 50 (17.2) | 56 (19.2) | 18 (6.2) | 19 (6.5) | 31 (10.7) | 75 (25.8) | 13 (4.5) | 7 (2.3) | 22 (7.6) | - | |||||||
| - | Public | 59 (14.5) | 63 (15.5) | 21 (5.2) | 35 (8.6) | 76 (18.7) | 101 (24.9) | 18 (4.4) | 6 (1.2) | 27 (6.7) | - | |||||||
| - | Public / private | 23 (20.7) | 21 (18.9) | 4 (3.6) | 8 (7.2) | 15 (13.5) | 29 (26.1) | 4 (3.6) | 2 (1.8) | 5 (4.5) | - | |||||||
| - | Total | 134 (16.2) | 144 (17.4) | 44 (5.3) | 64 (7.7) | 126 (15.2) | 209 (25.3) | 36 (4.4) | 15 (1.8) | 55 (6.7) | 827 (100.0) | |||||||
| Benefits #$ | - | - | - | - | - | - | - | - | - | - | - | - | - | - | ||||
| - | - | Access to digital innovation | There are no benefits | Add knowledge | Provide better lessons' content | Better learning | Do not lose course content | Save transportation expenses | Possibility of being at home | Safety in the isolation period | I feel more comfortable | Activities - students are not idle | Others&& | - | ||||
| Sex | Female | 148 (15.6) | 8 (0.8) | 93 (9.8) | 12 (1.3) | 78 (8.2) | 136 (14.3) | 68 (7.2) | 115 (12.1) | 170 (17.9) | 15 (1.6) | 102 (10.7) | 6 (0.6) | 0.101** | ||||
| - | Male | 100 (14.2) | 11 (1.6) | 56 (7.9) | 19 (2.7) | 59 (8.4) | 106 (15.0) | 60 (8.5) | 88 (12.5) | 108 (15.3) | 21 (3.0) | 75 (10.6) | 3 (0.4) | - | ||||
| Age | No answer | 30 (14.7) | 3 (1.5) | 17 (8.3) | 3 (1.5) | 18 (8.8) | 27 (13.2) | 17 (8.3) | 31 (15.2) | 31 (15.2) | 4 (2.0) | 22 (10.8) | 1 (0.5) | 0.437* | ||||
| - | 21-30 | 10 (10.9) | 1 (1.1) | 12 (13.0) | 3 (3.3) | 6 (6.5) | 17 (18.5) | 7 (7.6) | 10 (10.9) | 12 (13.0) | 4 (4.3) | 10 (10.9) | 0 (0.0) | - | ||||
| - | 31-40 | 76 (14.3) | 3 (0.6) | 54 (10.2) | 8 (1.5) | 47 (8.9) | 80 (15.1) | 43 (8.1) | 66 (12.4) | 90 (16.9) | 8 (1.5) | 53 (10.0) | 3 (0.6) | - | ||||
| - | 41-50 | 73 (16.1) | 2 (0.4) | 31 (6.8) | 8 (1.8) | 39 (8.6) | 64 (14.1) | 33 (7.3) | 57 (12.6) | 81 (17.9) | 9 (2.0) | 52 (11.5) | 4 (0.9) | - | ||||
| - | 51-60 | 45 (15.4) | 4 (1.4) | 28 (9.6) | 8 (2.7) | 20 (6.8) | 42 (14.3) | 22 (7.5) | 31 (10.6) | 52 (17.7) | 8 (2.7) | 32 (10.9) | 1 (0.3) | - | ||||
| - | 61-70 | 12 (17.4) | 6 (8.7) | 6 (8.7) | 1 (1.4) | 5 (7.2) | 9 (13.0) | 4 (5.8) | 5 (7.2) | 11 (15.9) | 2 (2.9) | 8 (11.6) | 0 (0.0) | - | ||||
| - | 71-80 | 2 (13.3) | 0 (0.0) | 1 (6.7) | 0 (0.0) | 2 (13.3) | 3 (20.0) | 2 (13.3) | 3 (20.0) | 1 (6.7) | 1 (6.7) | 0 (0.0) | 0 (0.0) | - | ||||
| Continent | North America | 11 (10.7) | 3 (2.9) | 10 (9.7) | 3 (2.9) | 8 (7.8) | 15 (14.6) | 14 (13.6) | 17 (16.5) | 13 (12.6) | 2 (1.9) | 7 (6.8) | 0 (0.0) | <0.0001* | ||||
| - | Latin America | 47 (15.3) | 0 (0.0) | 23 (7.5) | 6 (1.9) | 28 (9.1) | 43 (14.0) | 30 (9.7) | 41 (13.3) | 52 (16.9) | 9 (2.9) | 26 (8.4) | 3 (1.0) | - | ||||
| - | Asia/Oceania/Middle East | 4 (14.3) | 0 (0.0) | 1 (3.6) | 0 (0.0) | 2 (7.1) | 3 (10.7) | 3 (10.7) | 4 (14.3) | 5 (17.9) | 2 (7.1) | 4 (14.3) | 0 (0.0) | - | ||||
| - | Brazil | 160 (15.0) | 10 (0.9) | 110 (10.3) | 13 (1.2) | 84 (7.9) | 161 (15.1) | 66 (6.2) | 117 (11.0) | 193 (18.1) | 13 (1.2) | 132 (12.4) | 5 (0.5) | - | ||||
| - | Europe | 26 (16.9) | 6 (3.9) | 5 (3.2) | 9 (5.8) | 15 (9.7) | 20 (13.0) | 15 (9.7) | 24 (15.6) | 15 (9.7) | 10 (6.5) | 8 (5.2) | 1 (0.6) | - | ||||
| University | Comunitary | 5 (11.1) | 0 (0.0) | 5 (11.1) | 2 (4.4) | 3 (6.7) | 7 (15.6) | 4 (8.9) | 6 (13.3) | 7 (15.6) | 2 (4.4) | 4 (8.9) | 0 (0.0) | 0.787* | ||||
| - | Private | 102 (15.4) | 3 (0.5) | 60 (9.0) | 12 (1.8) | 60 (9.0) | 101 (15.2) | 53 (8.0) | 78 (11.7) | 111 (16.7) | 14 (2.1) | 70 (10.5) | 0 (0.0) | - | ||||
| - | Public | 113 (15.0) | 12 (1.6) | 70 (9.3) | 15 (2.0) | 61 (8.1) | 99 (13.1) | 50 (6.6) | 94 (12.5) | 129 (17.1) | 19 (2.5) | 84 (11.1) | 9 (1.2) | - | ||||
| - | Public / private | 28 (14.5) | 4 (2.1) | 14 (7.3) | 2 (1.0) | 13 (6.7) | 35 (18.1) | 21 (10.9) | 25 (13.0) | 31 (16.1) | 1 (0.5) | 19 (9.8) | 0 (0.0) | - | ||||
| - | Total | 248 (15.0) | 19 (1.1) | 149 (9.0) | 31 (1.9) | 137 (8.3) | 242 (14.6) | 128 (7.7) | 203 (12.3) | 278 (16.8) | 36 (2.2) | 177 (10.7) | 9 (0.5) | 1657 (100.0) | ||||
Bold values mean different from others within the groups.
according to Fisher's exact (comparisons were made vertically).
** according to Chi-square test (comparisons were made vertically). # only participants who were taking distance learning.
$ participants could score more than one answer; thus, the total exceeds the number of participants.
& Application of active methodologies at a distance, absence of practical activities, I take longer because I speak slowly, difficulty in carrying out evaluations, external interferences, not having adequate equipment.
&& Flexibility in time management, maintaining research activity.
Table 7 Difficulties and benefits concerning to distance lessons/activities for students.
| Difficulties#$ | - | - | - | - | - | - | - | - | - | - | - | - | ||||||
|---|---|---|---|---|---|---|---|---|---|---|---|---|---|---|---|---|---|---|
| Variables | - | Lack of content | Internet access | Lack of knowledge of videoconferencing technologies | Lack of interaction with students and professors | Lack of motivation about online lessons | I was unable to install the video conferencing software | I can't focus | Not having adequate equipment | I didn't have difficulties | Resolution of lessons' questions | p-value | ||||||
| Sex | Female | 50 (5.7) | 217 (24.8) | 45 (5.2) | 85 (9.6) | 193 (22.1) | 8 (0.9) | 203 (23.3) | 8 (0.9) | 27 (3.1) | 38 (4.4) | 0.416* | ||||||
| - | Male | 24 (8.8) | 60 (21.6) | 16 (5.9) | 27 (9.9) | 56 (20.5) | 4 (1.5) | 60 (22.0) | 5 (1.8) | 13 (4.8) | 9 (3.3) | - | ||||||
| Age | No answer | 1 (1.7) | 13 (21.7) | 3 (5.0) | 7 (11.7) | 12 (20.0) | 2 (3.3) | 16 (26.7) | 0 (0.0) | 3 (5.0) | 3 (5.0) | 0.643* | ||||||
| - | 11-20 | 10 (5.6) | 37 (20.8) | 6 (3.4) | 19 (10.7) | 43 (24.2) | 1 (0.6) | 46 (25.8) | 2 (1.1) | 5 (2.8) | 9 (5.1) | - | ||||||
| - | 21-30 | 57 (6.9) | 205 (24.8) | 44 (5.3) | 77 (9.3) | 181 (21.9) | 9 (1.1) | 186 (22.5) | 10 (1.2) | 25 (3.0) | 34 (4.1) | - | ||||||
| - | 31-40 | 6 (9.0) | 16 (23.9) | 6 (9.0) | 9 (13.4) | 12 (17.9) | 0 (0.0) | 11 (16.4) | 1 (1.5) | 5 (7.5) | 1 (1.5) | - | ||||||
| - | 41-50 | 0 (0.0) | 5 (38.5) | 1 (7.7) | 0 (0.0) | 1 (7.7) | 0 (0.0) | 4 (30.8) | 0 (0.0) | 2 (15.4) | 0 (0.0) | - | ||||||
| - | 51-60 | 0 (0.0) | 1 (50.0) | 1 (50.0) | 0 (0.0) | 0 (0.0) | 0 (0.0) | 0 (0.0) | 0 (0.0) | 0 (0.0) | 0 (0.0) | - | ||||||
| Continent | North America | 1 (4.8) | 4 (19.0) | 1 (4.8) | 4 (19.0) | 5 (23.8) | 1 (4.8) | 4 (19.0) | 0 (0.0) | 1 (4.8) | 0 (0.0) | <0.0001* | ||||||
| - | Latin America | 10 (3.7) | 74 (27.1) | 15 (5.5) | 33 (12.1) | 53 (19.4) | 2 (0.7) | 58 (21.2) | 4 (1.5) | 4 (1.5) | 20 (7.3) | - | ||||||
| - | Brazil | 45 (7.1) | 118 (18.5) | 28 (4.4) | 64 (10.0) | 146 (22.9) | 7 (1.1) | 176 (27.6) | 6 (0.9) | 21 (3.3) | 26 (4.1) | - | ||||||
| - | Europe | 18 (8.3) | 81 (37.3) | 17 (7.8) | 11 (5.1) | 45 (20.7) | 2 (0.9) | 25 (11.5) | 3 (1.4) | 14 (6.5) | 1 (0.5) | - | ||||||
| University | Private | 15 (5.1) | 73 (24.2) | 10 (3.0) | 27 (8.8) | 68 (22.9) | 3 (1.0) | 76 (25.3) | 4 (1.3) | 7 (2.4) | 18 (6.1) | 0.204* | ||||||
| - | Public | 59 (7.0) | 204 (24.0) | 51 (6.1) | 85 (9.9) | 181 (21.4) | 9 (1.1) | 187 (22.0) | 9 (1.1) | 33 (3.9) | 29 (3.5) | - | ||||||
| - | Total | 74 (6.4) | 277 (24.1) | 61 (5.3) | 112 (9.8) | 249 (21.7) | 12 (1.0) | 263 (22.9) | 13 (1.1) | 40 (3.5) | 47 (4.1) | 1148 (100.0) | ||||||
| Benefits #$ | - | - | - | - | - | - | - | - | - | - | - | - | - | - | ||||
| - | - | Access to digital innovation | Access to digital innovation | Add knowledge | I can pay more attention | Dynamic way of learning | Do not lose course content | Save transportation expenses | Activities - not idle and anxious | Possibility of being at home | Safety in the isolation period | I feel more comfortable | Others& | - | ||||
| Sex | Female | 119 (9.3) | 22 (1.7) | 76 (5.9) | 30 (2.3) | 60 (4.7) | 187 (14.5) | 190 (14.8) | 73 (5.7) | 223 (17.4) | 238 (18.5) | 58 (4.5) | 8 (0.8) | 0.934** | ||||
| - | Male | 46 (10.1) | 9 (2.0) | 28 (6.3) | 9 (1.8) | 26 (5.8) | 63 (13.9) | 69 (15.5) | 24 (5.4) | 73 (16.4) | 75 (16.8) | 28 (6.1) | 0 (0.0) | - | ||||
| Age | No answer | 10 (12.2) | 0 (0.0) | 2 (2.4) | 2 (2.4) | 5 (6.1) | 10 (12.2) | 14 (17.1) | 7 (8.5) | 15 (18.3) | 14 (17.1) | 3 (3.7) | 0 (0.0) | 0.318* | ||||
| - | 11-20 | 16 (7.8) | 10 (4.9) | 9 (4.4) | 4 (1.9) | 7 (3.4) | 36 (17.5) | 28 (13.6) | 10 (4.9) | 34 (16.5) | 45 (21.8) | 6 (2.9) | 1 (0.5) | - | ||||
| - | 21-30 | 121 (9.6) | 21 (1.7) | 81 (6.4) | 30 (2.4) | 63 (5.0) | 181 (14.3) | 188 (14.8) | 71 (5.6) | 215 (17.0) | 224 (17.7) | 66 (5.2) | 5 (0.5) | - | ||||
| - | 31-40 | 14 (9.5) | 0 (0.0) | 11 (7.5) | 1 (0.7) | 9 (6.1) | 18 (12.2) | 24 (16.3) | 7 (4.8) | 26 (17.7) | 27 (18.4) | 9 (6.1) | 1 (0.7) | - | ||||
| - | 41-50 | 3 (10.0) | 0 (0.0) | 1 (3.3) | 2 (6.7) | 2 (6.7) | 4 (13.3) | 4 (13.3) | 2 (6.7) | 6 (20.0) | 3 (10.0) | 2 (6.7) | 1 (3.3) | - | ||||
| - | 51-60 | 1 (33.3) | 0 (0.0) | 0 (0.0) | 0 (0.0) | 0 (0.0) | 1 (33.3) | 1 (33.3) | 0 (0.0) | 0 (0.0) | 0 (0.0) | 0 (0.0) | 0 (0.0) | - | ||||
| Continent | North America | 3 (9.1) | 0 (0.0) | 1 (3.0) | 1 (3.0) | 3 (9.1) | 4 (12.1) | 6 (18.2) | 1 (3.0) | 7 (21.2) | 5 (15.2) | 2 (6.1) | 0 (0.0) | <0.0001* | ||||
| - | Latin America | 47 (11.8) | 5 (1.3) | 31 (7.8) | 0 (0.0) | 19 (4.8) | 56 (14.1) | 64 (16.1) | 6 (1.5) | 72 (18.1) | 77 (19.4) | 17 (4.3) | 3 (0.8) | - | ||||
| - | Brazil | 73 (8.7) | 21 (2.5) | 57 (6.8) | 16 (1.9) | 42 (5.0) | 120 (14.3) | 101 (12.0) | 79 (9.4) | 123 (14.6) | 183 (21.7) | 24 (2.9) | 3 (0.3) | - | ||||
| - | Europe | 42 (9.1) | 5 (1.1) | 15 (3.2) | 22 (4.8) | 22 (4.8) | 70 (15.2) | 88 (19.0) | 11 (2.4) | 94 (20.3) | 48 (10.4) | 43 (9.3) | 2 (0.4) | - | ||||
| University | Private | 44 (11.3) | 14 (3.7) | 19 (5.0) | 8 (2.1) | 17 (4.2) | 61 (15.7) | 51 (13.1) | 12 (3.1) | 63 (16.3) | 81 (21.0) | 15 (3.9) | 2 (0.6) | 0.012** | ||||
| - | Public | 121 (9.0) | 17 (1.3) | 85 (6.4) | 31 (2.3) | 69 (5.1) | 189 (14.0) | 208 (15.5) | 85 (6.3) | 233 (17.3) | 232 (17.3) | 71 (5.3) | 6 (0.6) | - | ||||
| - | Total | 165 (9.5) | 31 (1.8) | 104 (6.0) | 39 (2.2) | 86 (5.0) | 250 (14.4) | 259 (14.9) | 97 (5.6) | 296 (17.1) | 313 (18.1) | 86 (5.0) | 8 (0.6) | 1734 (100.0) | ||||
Bold values mean different from others within the groups.
according to Fisher's exact (comparisons were made vertically).
** according to Chi-square test (comparisons were made vertically). # only participants who were taking distance learning.
$ participants could score more than one answer; thus, the total exceeds the number of participants.
& Were cited: Absence of distraction due to students' behavior in class, possibility of accessing lectures from other universities, possibility of reviewing classes.
DISCUSSION
The Covid-19 outbreak increased distance learning worldwide, as an alternative to face-to- face education, due to distance and social isolation measures (2). Thus, this study aimed to verify the experience of professors and students of dental schools from some countries using distance learning technologies.
The results show that all the factors studied influenced the use and experience with the tools. Motivation of teaching of female professors was more affected by social isolation. Simultaneously, the opposite occurred with students, with men being the most affected, although female were more concerned with the academic future. Studies suggest that biological differences between the sexes (e.g., due to differences between sex chromosomes, sex hormones, and brain lateralization) make female more sensitive to personal and other people's concerns. At the same time, men are guided by trends of control, aiming at assertiveness, self-confidence, and dominance, thus focusing on themselves (15). In this sense, it can be inferred that given these biological differences and the pandemic situation, female professors' motivation was more affected than male professors. These professors’ need to adapt to digital resources and transmit knowledge through distance learning may cause more significant concern. Personal issues, including family safety, child members confined at home, economic difficulties, may exacerbate this lack of motivation. These differences may also justify female students' more significant concern for the academic future. It is crucial to address the possible role of domestic work, usually female- exclusive in some cultures, influencing the present results. Female professors and students at home should pay attention to their remote learning duties and assume domestic work. This overload of responsibilities could affect their motivation more than male professors and students. On the other hand, for male students, this new teaching modality can be understood as a lack of control due to uncertainties regarding the new dental education path, affecting the learning process.
Among younger students, concern about the educational future may reflect academic immaturity (2). These students are usually at the beginning of the undergraduate course, making them more susceptible to face-to-face teaching disruption. Furthermore, the learning change from passive professor-centered learning to a more active posture focused on self-learning and self-discipline (7,10,16). This fact can be justified by the greater anxiety/stress of these students with the adaptation to distance learning, especially among students aged up to 21 years. These students are also studying more with distance learning and less alone, indicating the need for the professor's figure to guide their studies. According to these results, it was found that undergraduate students also had higher levels of anxiety/stress associated with remote lectures. Thus, it can be considered that postgraduate students already have greater maturity and academic autonomy. These findings may be since face-to- face learning has been the primary teaching method for undergraduate students (17,18), while for postgraduate teaching experiences, hybrid teaching methods have already been applied in educational institutions worldwide (4).
Students from all countries/continents used mainly computer/laptop for accessing distance lessons. Although mobile devices also provide access to the internet and, thus, to lessons' content, it can be suggested that mobility was not a requirement among students because they are confined at home. Besides, mobile devices could be perceived for leisure activities, such as access to social networks (19), not academic activities. A larger screen monitor may improve viewing the lectures' content, helping them solve the educational activities.
Concerning the type of institution, it was found that 29.5% of public universities were not getting online lessons. With that, part of their students answered that they were studying alone or not studying at all. In contrast, students at private universities considered they were studying more with remote lectures. Confirming these findings, private university professors also indicated sending more academic activities to students than public university professors. Thus, the higher economic resources to acquire digital communication technologies and platforms could explain the private institutions' higher adaptation to distance learning. Moreover, their student population comes from higher-income families with the proper equipment and internet access. In contrast, even if public universities have digital communication technologies and platforms, adaptation is more complicated if the student population cannot access the information.
Furthermore, it was found that professors from private universities preferred university communication platforms for transmitting lectures. As there was little time for adapting to distance learning, these institutions probably chose institutional platforms for usage standardization among professors and students (20). This choice avoids the migration between technologies and maximizes the institution's resources, either to pay for the use of these services and to hire personnel for professors' and students' training. This fact can be seen in the present study since private institutions provided more training for these technologies than other institutions.
Although the internet and technology are present in people's lives, distance learning was not yet a routine in dental professors' and students' academic lives. Therefore, training is an essential aspect of using communication technologies focused exclusively on distance learning and facilitating adaptation with this teaching modality (2,7,9). In this sense, as students may be even less adapted to using these technologies than professors, it was found that students from North America and Europe received more comprehensive support using them. In contrast, digital resources in distance learning could be more limited before the pandemic among developing countries. For this, in Latin American countries, the emphasis was placed on this training to better use digital resources.
It appears that among the available technologies to transmit the online lectures and for answering questions, the best option among professors in Europe was synchronous video services. These services have the advantage of better interaction with students since classes occur in real-time (10), similar to face-to-face teaching. Confirming these findings, this was the most used option for answering questions among students in Europe.
Students in Brazil preferred text messages applications for answering questions, opposite to professors and students from countries in North America and Europe. Applications examples include Whatsapp®, which allows checking whether users are online and whether messages have been read. In addition to creating groups and sharing content (text messages, audio, video, and image files) and allowing small groups "online meetings" (21). There are some examples in the literature about its use in the health field (21,22,23). However, despite the ease of communication about email, it should be considered that faculty members can feel comfortable because they have to share their cell phone numbers and be consulted at any time by students (21). Countries in Europe and North America culturally use these applications less, while in some countries, such as Brazil, this is the main communication application used today. Thus, the results demonstrate that personal habits about using technology have been transferred to professional matters.
The application of innovative and interactive pedagogical approaches to assessment, such as survey systems, has been verified as an option by students in Latin America. The survey system provides a dynamic form of evaluation due to the competitive nature it adds to the evaluation process, increasing students' interest and involvement (24). Because it was the most used during confinement, the use of this technology was the most recommended by Latin American students when returning to face-to-face activities. On the other hand, this tool was the least used among students in Brazil, so the option least indicated by professors and students to be used when returning from face-to-face lessons, suggesting a lack of habit or knowledge of the functionalities of this digital resource.
Still, about the tools to be used when the face-to-face lectures return, it was observed that online meetings were pointed out more frequently by both professors and students. This data is relevant, as this type of meeting allows the integration of several professionals and students, whether to teach a class, resolve administrative matters, participate in admissions and assessment processes, with fewer time and costs.
Among the limitations of distance learning, we can see that a generations' challenge was a reality in this research since older age professors (61 to 80 years old) had difficulties recording the lectures and using video conferencing tools. It is known that young people use digital technology efficiently (2,25), as new generations grew up with the emergence and evolution of the internet, while previous generations had to adapt to these technologies gradually. However, it should be noted that learning this is possible, as some older professors (61 to 70 years) also indicated that they had no difficulty with remote lectures.
While difficulty accessing the internet was indicated mainly in developing countries (9,25), problems with the internet connection was also a limitation indicated by students from Europe. A possible explanation could be many families that started using the residential links for work purposes instead of the corporate links used before this pandemic. Thus, equity in access to distance learning is a factor to be considered independently from the country's economic development.
It should be noted that, although professors and students in Brazil indicated that distance learning was meaningful for students not to be idle, an issue shown by students was the difficulty of concentration, as was also verified in a previous study (25). This is a crucial point to be observed in this type of learning, as it is necessary to have a peaceful environment and family support so that students can watch the content of the lectures. This environment influences even the execution of extra- class activities, which can be more difficult, with several family members being confined at home.
It is observed that a limitation of the present study was in relation to the differences in the number of participants among the countries, despite the efforts of researchers to further disseminate the questionnaire. This fact is a reflection of surveys with questionnaires that depend on the willingness/ availability of participants to answer the questions. Moreover, not all universities make available the email addresses of professors/students on their websites, in addition to the vacation/recess period of some colleges when conducting this research. However, care was taken to ensure that the statistical analyzes minimized the differences in sample sizes in the countries/continents.
Despite all the difficulties imposed by the pandemic in the teaching-learning process, it was an opportunity to learn about new technologies in education, which can be applied more efficiently in new contagion waves or pandemics (8). It is also essential to consider that distance learning, as a complement to face-to-face teaching, came to stay with us, requiring adequate knowledge on the part of teachers and students so that it is possible to apply the benefits of the available tools fully.
CONCLUSION
It was shown that professors and students struggled with digital technologies to promote distance learning during the isolation caused by the COVID-19 pandemic. Gender, age, countries/ continent, and type of university influenced the technologies used, feelings, and experiences around this adaptation process. Finally, some of the preferred distance learning technologies could be applied when returning to face-to-face activities, especially among professors and students from Latin America and Brazil.

