


 Spanish (pdf)
 Article in xml format
 Article references
 Send this article by e-mail
 Cited by SciELO
  Similars in
SciELO
Similars in
SciELO 
 Permalink
1.Introduction
Tourism in Latin America has been a relevant economic activity, forecasts suggest continued growth (Correia,Santos and Pestana, 2007). The later situation can be explained because of Latin America’s sheer diversity in scenic beauty, cuisine and cultures have combined with an increasingly sophisticated domestic industry to cater to every kind of traveler. Historical views from Mayas to Incas permitted to attain a variety of motives to visit. In addition, natural landscapes also attract a different kind of tourists.
Since the subprime crisis of 2009, tourism’s direct contribution to Gross Domestic Product (GDP) in Latin America grew significantlyto reach an estimated $121 billion in 2016, which represents 3,2% of GDP.Also, the touristic industry contributes to almost 2,9% of the total share of employment data2. It is projected that the touristic contribution to GDP rises to 3,5% in 2027. Forecasts for contribution to employment will be 3,3% of GDP3 (Figure 1).
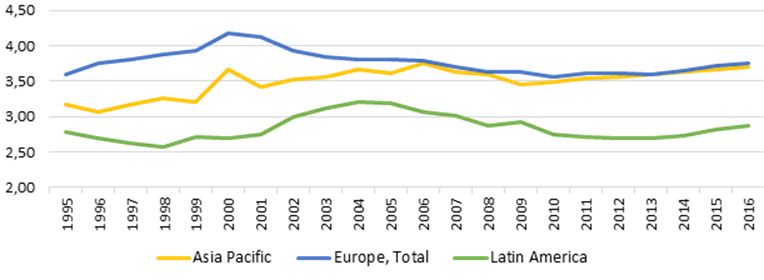
Source: Own elaboration based on World Travel and Tourism Council
Figure 1 Direct contribution to employment (% share of total employment).
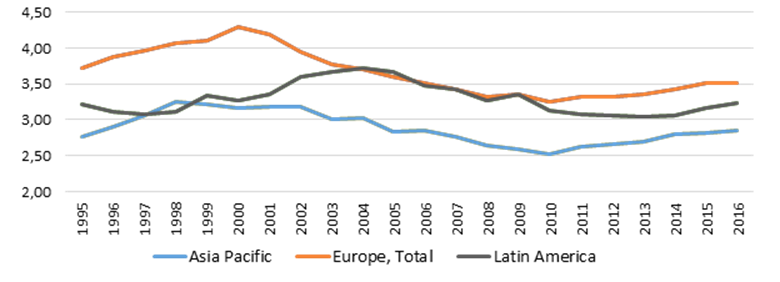
In comparison to other emerging areas, the tourism in North-East Asia and Asia Pacific Area has a contribution to GDP below Latin America (Figure 2), (2,5% and 2,8% respectively). Therefore, the industry of tourism in Latin America is very important. Only in the Caribbean area the contribution to GDP is 4,7% but is only reports an approximate total contribution of US$ 17,9 billion (World Travel and Tourism Council (WTTC), 2016; World Bank, 2016).
Looking at the individual country´s performance, there is some heterogeneity. Economic growth and government policy of tourism led to a stunning 50 percent growth in direct GDP contribution in Peru, but a decline of over 40 percent in Suriname Brazil, the region’s largest country, is also its tourism power player, here the contribution to GDP is 3,2% with a maximum of 4,2% in 2003. In the case of Venezuela, the contribution is not doing an outstanding performance. Since the latter country has political problems, the tourism contribution varies from 3,6%in 2009 to 3,2% in 2016(WTTC, 2016; World Bank 2016).
We will explore relationships between tourism expenditure, motivation to visit the country as well as the socioeconomic characteristic of foreign travelers for an emerging economy that belongs to the Latin American Region: Peru. According to the data shown above, this country is relevant in the area in the touristic industry.
This research has the aim and objective of developing a SEM of the Peruvian tourism demand as well as using this model for explaining tourists’ behavior. The paper is organized as follows: the next section will have a literature review for the touristic demand, then we propose the SEM. Section 4 explains the results and finally, we conclude.
2.Literature review of demand for tourism
In the existing literature, there are not several studies that pay attention to traveler’s expenditure. Mitchell and Reid (2001) find some socioeconomic benefits in Taquile Island for most residents due to touristic activity in an integrated community.
Also, for Desforges (2000) Peru is a good case study of touristic reform after the neoliberal structural adjustment. The author reports changes in the sector since the market open in the country in 1990. These changes focus on the role of government and the private sector as well. The latter strategy has benefited Peruvian tourism since it increased significantly. The Peruvian touristic model cannot be compared yet on an international scale.
Moreover, Divino and MacAleer (2010) show for an empirical result that international tourist arrivals and their growth rates are stationary. The authors run a Dickey Fuller test to proceed with their hypothesis, estimated symmetric and asymmetric conditional volatility models all fit the data extremely well and the behavior of the touristic arrivals behave like financial variables.
Our study explores the determinants of expenditure like above, but the approach is different since we use a technique that captures qualitative data in the SEM framework. In this case, there is not any seminal paper that hits this point and from the mentioned approach. In the literature, there is an estimation of determinants of traveler’s expenditure for countries like Brazil, Mexico, South Africa, USA, and European Countries by using panel data models.
Chaitip, Chaiboonsri, Kovács, and Balogh (2010) used the SEM to analyze touristic demand for the case of Greece. In this study, a survey containing Likert scale questions was conducted to collect data from 100 tourists who had traveled to Greece’s tourist destination. With the help of factor analysis, four dimensions were identified for scales used in the study: travel cost satisfaction, tourism product, tourism product attributes, and tourism product management.
Also, Dong-Wan and Stewart (2002)4 tests the structural equation model between residents’ perceived tourism impacts and attitudes toward the host community. The study is run for residents of Cheju Island, Korea. The construct community satisfaction was influenced by the perception of tourism impacts.
Besides motive variables, sociodemographic variables have been widely used to predict the level of travel or recreation expenditure. Dardis, Derrick, Lehfeld, and Wolfe (1981) utilized 1972-73 Consumer Expenditure Survey conducted by the US Bureau of Labor Statistics to investigate the impact of various socio-demographic characteristics on recreation expenditures in the US.
Dardis, Soberon-Ferrer, and Patro (1994) found that income5was again found to be an influencing factor in explaining variations of household expenditures on three categories of recreation items including visiting museums, attending sports events, and other recreation and entertainment. Mok and Lam (1997) found that the Taiwanese tourists concentrate more on shopping than any other category, this behavior can be attributed to a cultural value of keeping relationships through giving a gift.
Saaymanand Saayman (2014) incorporated socio-economic variables and income variables as well. They also include the length of stay as a determinant of tourist expenditure. For the same authors, the variable sex is also incorporated but they found it irrelevant. For other authors like Lehto, O’Leary, and Morrison(2004) women spend more than men but for Jones,Wood, Catlin, and Norman (2009) the result is just the opposite. The latter is interesting for touristic planning segmentation across gender.
Age is an important variable that may explain touristic demand. Younger people tend to be interested in adventurous activities such as wildlife viewing and beach holidays. With advances in age, individuals search for holiday activities that can give them more knowledge and understanding of issues outside their usual environment of life, particularly cultural activities (Van der Merwe,Slabbert , and Saayman,2011).
Besides socio-demographic characteristics, Kruger(2009) added cultural differences that may explain the touristic demand.
The next section will explain the SEM model that runs the assessment of determinants of the demand for tourism.
3.Structural Equation Model of the demand fortourism
Structural Equation Model6 (SEM) is well known in the business literature (Jöreskogand Sörbom, 1982) it may capture relationship between qualitative variables and quantitative variables as well. In the literature of tourism Chaiboonsriand Chaitip(2010) run an analysis between tourist travel motivations (travel cost satisfaction and tourist demographics) and tourist destination (tourism product, tourism product attributes, and tourism product management).
Results for latter authors indicated that the travel cost satisfaction of international tourists had a positive influenced on tourism product attributes. Also, the travel cost satisfaction had a positive influence on tourism product management. The tourist demographics had a positive influenced on tourism product and tourist demographics, which had a positive influenced on tourism management.
Swansonand Horridge(2004) studied the Structural Equation Modeling to test the causal relationships between tourist travel motivations (travel activities and tourist demographics) and souvenir consumption (souvenir products, product attributes, and store attributes). The results indicated that the travel activities of tourists had positive correlations with souvenir consumption, while tourist demographics had no correlation.
Our model considers socio-economic variables and motive variables as well. We classify the motives into three different categories: Leisure, Health and Education and Other. The latter can include up to religious motives to travel such as conferences or events. Tables 1 and 2 describe some statistics of our variables.
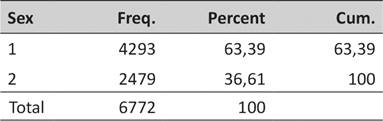
Table 2 Descriptive Statistics of Motives to Travel
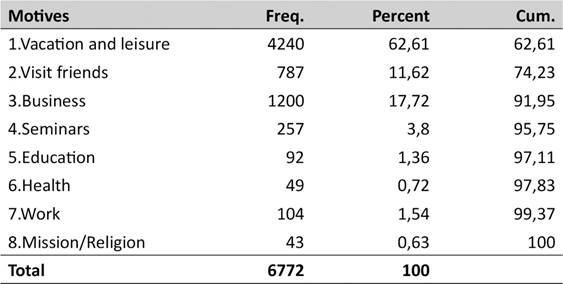
Note: Motive 1, Leisure: 1, 2, and 3; Motive 2, Education and Health: 4, 5, and 6; Motive 3, Other: 7 and 8
Source: Survey Promperu.
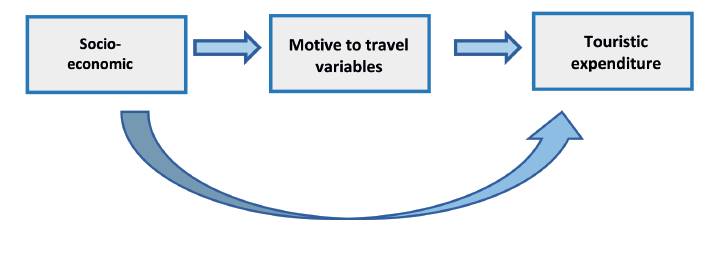
Basically, the theoretical model is shown in Figure 3. We can see that we attempt to capture socio-economic variables and motives with touristic expenditure. We control for correlations between the variables. Among the different categories for the Structural Equation Model, we consider Path Model Analysis since we are not able to construct latent variables7. The model in Figure 3 considers indicators of socio-economic, motive, and touristic expenditure variables. Since we have a mix of dummies, continue and ordinal variables then we must apply weighted Maximum Likelihood Estimation.
The next section will describe the data before introducing the results of the model presented here.
4.Dataanalysis
According to Tables 1 and 2, most of the people are males in the sample conducted by Promperu which is the main regulator of tourism in Peru. We have 6772 respondents.Table 2 contains the motive variables which are classified into three different categories: Leisure, Health and Education and Other.
The answers ‘vacation and leisure’, ‘visit friends’and ‘business seminars’are considered as Leisure motive. The answers ‘education and health’are Education and health motive, and ‘work mission/religion is considered as another motive.
According to the literature previously discussed, Mitchell and Reid (2001) and Dardis, Derrick, Lehfeld, and Wolfe (1981) found the significant and relevant influence of socio-economic variables in the touristic sector but the result contrasts with Swansonand Horridge (2004). Also, motive is widely discussed with a positive significant effect on tourism expenditure as well.
The available information of the survey run by Promperuallows us to consider the latter variables plus the touristic expenditure for our analysis.
5.Results of the Model
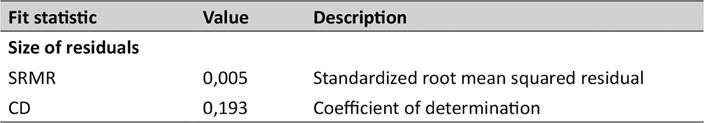
Table 3 shows some relevant results in terms of Fitness of the Model, the indicator of Standardized Root Mean Residual was below 0,10, so the fitness of the model8 describe above is almost perfect. Also, the Coefficient of determination was 0,19, low but we are not predicting the touristic expenditure but find its determinants. The model is estimated using a weighted maximum likelihood, so we have just these two tests to verify the fitness of the model. Since there is a mix of dichotomic and continuous variables, we use the later estimator.
Table 3 Fitness of the Model
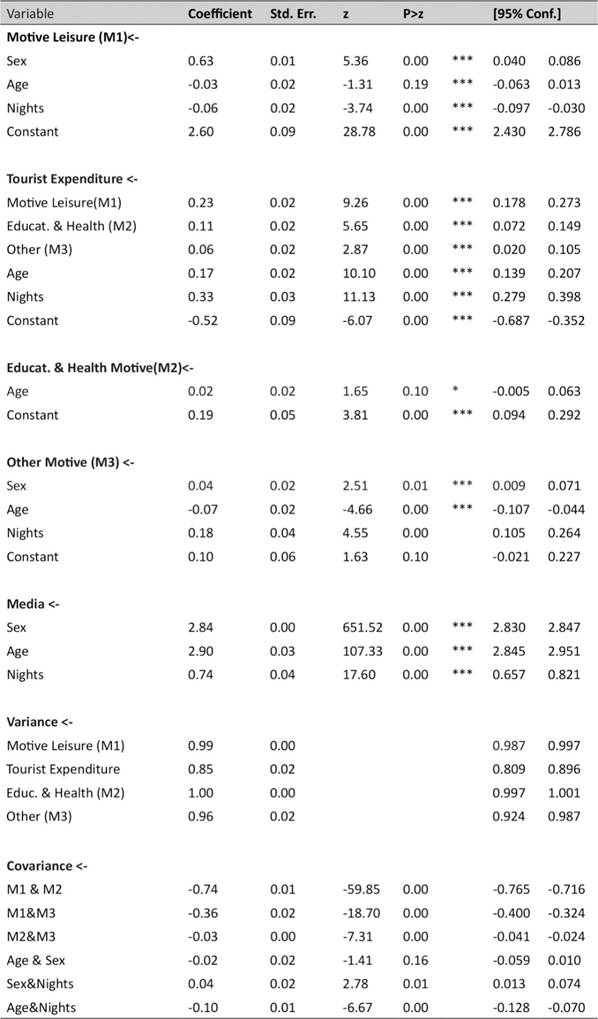
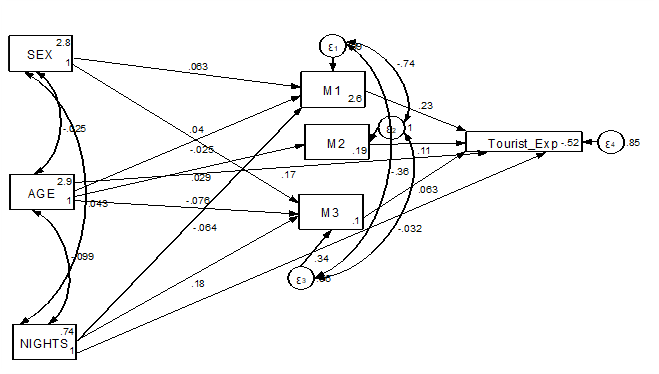
Also,Table4and Figure 4, shows the results of the structural model set up in the previous section of the paper. From Table 1 we can infer that almost all the variables are significant except for the constant where motive 3 is endogenous.
Figure 4 contains the weights for each of the relationships among the variables. The variables are not latent but indicators, so the model to be estimated in a Path Analysis Model instead of a pure Structural Model. All these weights are significant at 99% of confidence. As we have discussed before, the results are robust since the indicator of Standardized Root Mean Squared Residuals(SRMR)9 was low, which make us trust the result obtained in Table 4.
Touristic expenditure is explained by the three different motives: Leisure, Education and Health and Other. So foreign visitors may come following either one of the three models explained. The coefficient Leisure motive was the highest followed by Education& Health and Other Motive. This result goes along the results found by Chaitip et al. (2010) for a different sample set.
Also, as the people get older the expenditure is higher and the number of nightsinfluences positively the touristic expenditure as well. The result goes along the line for a different sample set Dardis et al. (1981; 1994). There is more than one direction of causality in the model and the goodness of the Path Analysis conducted here is that we can capture all positive correlations and relationships. The Fitness of the model described permits us to trust this final specification as the best we can conduct among several different combinations.
The socio-economic variables ‘sex’ and ‘night’ explain the motives Leisure and Other, while age explains Education and Health and othermotives to travel. Being maleinfluences positively the three different motives to travel. Being older motive the motive Education and Health but there is a negative relationship with respect to other motives. The number of nights influence positively the variable Other Motive but negatively Leisure motive. Besides the relationship between motive variables and socioeconomic variables, it is interesting to look at the influence between socioeconomic and motive variables. There is not a homogeneous relationship between socioeconomic and motive to travel variables.
In addition, motives are correlated with each other negatively and significantly, so if the visitor comes for Leisure, it is also not necessarily expected than they come for a Business or Religious motive at the same time. The latter is an interesting result for marketing segmentation in order to find a better demand for visitors.
6.Conclusions
This research provides some feedbacks for policymakers in the area of touristic segmentation. This is an interesting model brand new in the literature of Tourism Economics which can find the determinants of touristic demand in terms of socio-economic variables but considering the idea of several relationships in a conceptual map model.
Structural Equation Model is not widely used in this area, we have estimated a Path Analysis which is a variety of a Structural Equation Model. Despite there is a lack of information, the results obtained in the research permit us to make some inference about the relationship between the described variables.The goodness of fitness was clearly robust, and we can infer that motives of leisure, business andother influence expenditure of the tourist. More weight can be attributed to leisure and socio-economic variables like age, the number of nights and sex also influence the expenditure of the tourist as well.
This paper can be used for marketing segmentation10 in our database of foreigners visiting Peru for the most recent period. Further investigation may compare if there is a structural change among these periods of time.Also, our limitation is that the database considered a survey for foreigners but not domestic visitors.

