


 Inglés (pdf)
 Articulo en XML
 Referencias del artículo
 Enviar articulo por email
 Citado por SciELO
  Similares en
SciELO
Similares en
SciELO 
 Permalink
Introduction
Sandy beaches are very common formations on tropical coasts (Gerrard, 2007). They are transitional coastal forms between marine and terrestrial environments (Dingler, 2005). The erosion of sandy beaches can be analyzed as a negative balance between the dynamic entry and exit of sediments occurring in a beach resulting in a morphological change that is commonly perceived by the occupants of these spaces as a retreat of the shoreline (Masselink, 2012). A negative balance can be created by a wide variety of events such as: changes in land use within hydrographic basins, decrease in the contribution of river sediments resulting from the construction of dams, coastal infrastructure development, changes in wind, waves, the pattern of storms or mean sea level.
According to Silva, et al. (2014), in Latin America coastal erosion is not a widespread problem, however, it is prevalent and a serious problem in certain places. In the case of Costa Rica, in the past 15 years some researchers have warned about the effects of changes in the Pacific shoreline (Lizano et al., 2002; Denyer et al., 2004 and Ortiz, 2012). More recently, Lizano (2013) reports erosion processes on beaches that are found in protected areas and tourism sites on the Costa Rican Caribbean coast; such events are rapidly associated with climate change (Quesada & Molina, 2016) without there being studies that quantify the erosion process, establish trends or explore alternative causes.
In this sense, the investigation carried out in the framework of the Costa Rican Coastal Marine Biodiversity, Development of Capabilities and Adaptation to Climate Change (BIOMARCC-SINAC-GIZ, 2013) Project, developed a map exhibiting the potentially affected coastal areas as a result of the increase in sea level and wherein five exposure categories are proposed based on their elevation measured in meters above sea level (masl), namely: very high, 0-1 masl; high, 1-2 masl; average, 2-4 masl; low, 4-8 masl; and very low, 8-16 masl. Based on this categorization, the Costa Rican Caribbean coastal would experience a large impact due to the change in sea level associated with climate change. According to this same study, the Caribbean Sea shows a tendency towards increasing sea level (1-2 mm/year), however, it is also pointed out that such trend can be attributed to the multidecadal variability of the ENSO phenomenon, or to a change in the Circulation of the Caribbean Current (CC) and the Giro Panama-Colombia (GPC).
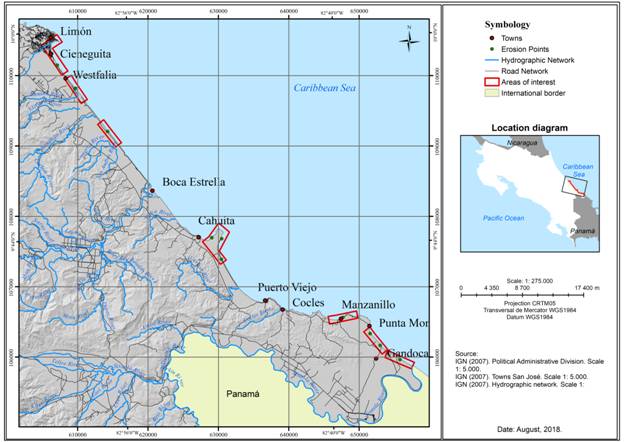
It should be noted that an accelerated erosion process has been reported in several sectors of the south Caribbean coastal, in beaches such as Cieneguita (Bosque, 2016, Mora, 2015, Barrantes, et al., 2017), Cahuita National Park (Soto, 2014) and the Gandoca-Manzanillo Wildlife Refuge (Quesada & Molina, 2016). Due to the above, the present investigation was developed to identify and quantify the areas of greatest erosion, termed hotspots (Finkl, 1993), in the beaches located between Puerto Limón and the mouth of the Sixaola River, at the international border with Panama. Hotspots identification and precise quantification is vital for coastal region planning, particularly in places where infrastructure already exists (Anthony, 2005).
Calculation of coastal erosion
Coastal erosion can be studied in different spatial-temporal frames, which are related to the processes causing changes, as well as to the methods and techniques employed for their study (Table 1).
Table 1 Scales of analysis of coastal erosion
| Period | Spatial and temporal scale | Processes that influence changes | Study methods and techniques |
|---|---|---|---|
| Very short-term | -mm to m -Seconds to hours | Waves, currents and winds | - Colored or fluorescent dyed tracer sand - Segmented aluminum rods |
| Short-term | -m to km -Hours to years | Waves, winds, tides, tidal surges, seasonal changes and storms | - Changes in beach profile - Differential GPS |
| Medium-term | -km -Years to decades | Changes in wave regime, severe storms, changes in the contribution of rivers sediments, costal civil works (infrastructure) | - Aerial photographs - Satellite images and GIS-analyzed orthophotographies |
| Long-term | -Tens of km -Decades to centuries | Changes in sediment transport and changes in sea level | Quaternary techniques (photo-geomorphology, archeology, sedimentology, among others) |
| Very long- term | -Hundreds of km - Centuries to millennia | Changes in sea level, variations in the contribution of sediments and changes of regional swell. | Quaternary techniques (photo-geomorphology, archeology, sedimentology, among others) |
Source: own elaboration based on (Taveira-Pinto et al. 2011) and Gracia et al., (2005).
Due to the type of sources used and the methods of analysis, the time scale of the present investigation pertains only to medium-term time frame. Additionally, the rates of erosion can be calculated by means of three alternative methods (Ojeda, 2000, Prieto, 2017):
• Distance calculation (m/year): determined from the record of shoreline retreat distances of two or more shoreline. It can also be obtained by means of beach profiles or field measured distances from fixed reference points.
• Surface calculation (m2/year): based on the elaboration of polygons between two shoreline surveyed on different dates.
• Volume calculation (m3/year): it requires topographic surveys with high precision altimetry of the beach under study.
Of these methods, volume calculations provide the most information as they encompass three-dimensional (3D) analysis but are very expensive due to the required equipment (differential GPS or airborne LIDAR sensors). For the implementation of a two-dimensional (2D) analysis surface calculation method, a proxy coastal line must be defined that can be recognized in aerial photographs or satellite images. Finally, the distance calculation method is widely used because it allows data comparison with other case studies as well as being very comprehensible for decision makers. However, distance calculation methods only offer unidimensional analysis. Based on the available information sources and the selected analysis spatial-temporal scale, the surface calculation procedure was chosen.
Study area
Costa Rica is located in Central America, it has shoreline in the Pacific Ocean and in the Caribbean Sea. The Caribbean shoreline runs approximately 220 km, almost five times less than the Pacific shoreline (Vargas, 2006) due to the borders established with Nicaragua to the north and Panama to the south, as well as to a more rectilinear Caribbean shoreline. The climate in the Caribbean coast is characterized by an undefined dry season, having two periods in which precipitation decreases, the first from February to March and the second between September and October (IMN, 2017). Herrera (1986) classifies the Caribbean south climate as hot-humid with short dry periods.
As for tides, the Caribbean coast presents a micro-tidal condition where tides rarely exceed 30 cm (Murillo, 2001). Waves usually come from the northeast direction with average wave periods of 7.38 s of markedly local character, with higher energy during the last and the first months of the year and lower energy from September to October when the trade winds diminish (Lizano, 2007). The main currents along the coast run from northwest to southeast, as part of the so-called cyclonic circulation of the Giro Panama-Colombia (GPC) (Andrade et al., 2003).
From a geological and geomorphological perspective, the Caribbean coast can be divided into two regions, the north and the south. The northern region presents characteristics of a passive continental margin and an extensive tectonic regime (normal faults) while the southern region presents a compressive regime with the occurrence of major earthquakes (Alvarado & Cárdenas, 2016). Geomorfologically, the northern region shows a relatively rectilinear configuration, with the presence of sandy beaches, sand bars, coastal lagoons and a system of artificial canals. The southern region, on the other hand, is characterized by the proximity of a mountainous system to the coast; between Puerto Limón and Puerto Viejo there are extensive sandy beaches, however, starting at the latter town, the shoreline becomes more intricate, the beaches shorten until developing into so-called pocket beaches which intercalate with coastal rocky formations (Figure 1).
The Caribbean south coast contrasts with the uniformity of the Caribbean north coast. The south coast alternates between areas where coastal plains have a considerable extension, with others where hills up to 100 m high almost reach the shoreline (Battistini & Bergoeing, 1984). There are rocky promontories associated to a reef complex attributed to the Middle Pleistocene, known as the Puerto Viejo Formation, which has rocky outcrops in Puerto Limón, Cahuita and Puerto Viejo, as well as along the rocky coast that occurs between Puerto Viejo and Punta Mona. According to Battistini & Bergoeing (1984) they are coral massifs that alternate with coral breccias as well as old fossilized beach beds (black sandstones). This complex overlays in some sectors like Limón a similar formation called Portete, of lower Pleistocene age. Moreover, rocky coastal sectors exhibit exposed reef platforms or reef platforms located at or near the current sea level, that came about their position after the 1991 Limón earthquake; behind ese recently erected platforms, it is common to find other terraces, between 2 and 4 m above current sea level, which may have been formed by earthquakes prior to 1991, although their current position may also have been influenced by quaternary eustatic movements (Denyer, et al., 1994). Additionally, in sectors such as Cahuita and Manzanillo, especially, we find recent extensive submerged reef platforms.
Administratively, the Caribbean south coast lies between the municipalities of Limón and Talamanca, which, as of 2011 (UNDP, 2013), ranked in positions 74 and 62 of the Human Poverty Index amongst the 81 cantons that make up Costa Rica, and positions 73 and 80 of the Human Development Index, respectively; such metrics reveal the lag in economic development of the region and related social problems aggravated by unemployment. The main economic activities of the Caribbean region are beach and nature tourism, port activities and banana cultivation.
Methodology
The employed methodology is based on the change of position of the shoreline, defining this as the precise limit between land and sea. Although shoreline delineating is usually made following the mean sea level, the difficulty of identifying the sea level in the surveyed terrains required the alternative approach, that consist to use the vegetation limit as a the shoreline proxy. Alternatively, beachfront public infrastructure was also used as shoreline indicators. When the mean sea-level methodology (Moore, 2000) is not practical, the use of the vegetation limit proxy is recommended if beach erosion study is the emphasis of the investigation (Boak & Turner, 2005).
Aerial photography and satellite images were used as information sources. In order to comply with the objective of establishing coastal erosion rates, only photographic sequences that covered a large-scale area and to which orthorectification had been applied were selected. Available aerial photographs from 1956 to 1993 were not used due to the variations in their scales (most of them between 1:60000 and 1:40000) or the inexistence of camera calibration parameters data necessary for carrying out orthorectification processing, thus making these photographs inappropriate for quantitative work (Thiele & Danforth, 1994; Moore, 2000).
Following the above criteria, a mosaic of orthophotographs from the year 2005, at scale of 1:5000, were selected (spatial resolution of 0.5 m per pixel); the orthophotographs were commissioned by the National Registry and endorsed by the National Geographic Institute (IGN). Likewise, a set of orthophotographs (1:1000 scale, spatial resolution 0.1 m per pixel) from 2016 were chosen, these had been commissioned by the National Commission for Risk Prevention and Emergency Response (CNE) as part of a LIDAR survey study of the coastal zone. Because of the prolonged period from 2005-2016 and, with the intention of evaluating temporal trends in greater detail, six very high spatial resolution (0.5 and 0.6 m) panchromatic satellite images with rigorous orthorectification were acquired to cover the year 2010 at 1:5000 scale.
Once the data sources were defined, GIS-assisted digitalization of the shoreline for the years 2005, 2010 and 2016 was performed and digitalized data homogenized to 1:1000 scale. Two periods of analysis were established for comparison, namely 2005 to 2010 and 2010 to 2016.
Subsequently, the changes in shoreline position were classified as advance, backward and stable. The first case occurs when the shoreline advances towards the sea between the initial and final years; the second when the line retreats inland between the initial and final years and stable occurs when the lines of the initial and final years register but little change between them. For the beaches showing the greatest shoreline retreat, we proceeded to estimate the aerial regression rate (m2/year) (Ojeda, 2000) for periods 2005-2010 and 2005-2016. In this way it was possible to determine if the trend observed in the first time series is maintained, increased or decreased relative to the second period. Once the rate has been calculated, a field verification is carried out to check whether the result found by means of photographic interpretation techniques correspond to an accelerated beach erosion process.
Results
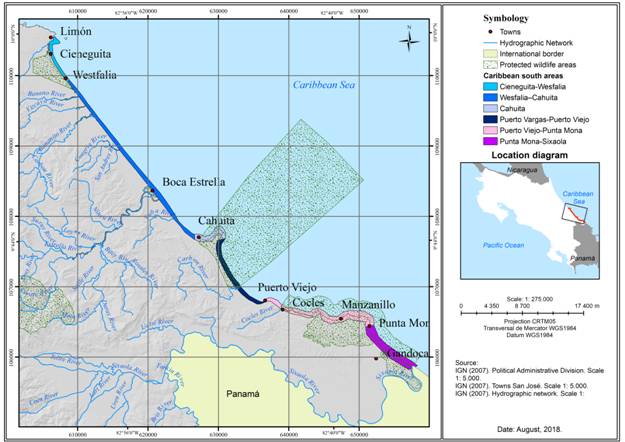
To facilitate the interpretation of the obtained results, the study area was divided into six sectors according to the configuration of the coast (Figure 2), namely:
Cieneguita-Westfalia: sector located at the northwest end, characterized by possessing an extensive beach with a slight concavity pointing north opening to the Caribbean Sea, mainly in the sector closest to the rocky promontory where the city of Limón is located. Cieneguita Beach has a jetty approaching the middle of the beach.
Westfalia-Cahuita: this sector appears as a rectilinear coast having in its surrounding the presence of the mouths of important fluvial systems and wetlands (estuaries).
Cahuita: small peninsular sector having two sections where the rocky reef platform is interspersed by a sandy beach (Cahuitas’s Blanca Beach); on the smallest section of the platform sits the town bearing the same name (Spanish ¨Playa Blanca¨), and on the other a section of land called Punta Cahuita. Both Blanca Beach and Punta Cahuita are part of a wildlife protected area (Cahuita National Park). Among the current main features of the park is the presence of an important coral reef.
Puerto Vargas-Puerto Viejo: this corresponds to a straight to slightly concave shoreline sector spanning from the old berth town of Puerto Vargas to the town of Puerto Viejo; shoreline concavity opening to the Caribbean Sea. The continuity of this shoreline is only interrupted by the mouth of the Carbón River.
Puerto Viejo-Punta Mona: this sector is comprised of relatively short and pocket beaches interspersed with ledges, rocky promontories and outcrops of the Pleistocene reef formations in the form of terraces.
Punta Mona-Sixaola: rectilinear shoreline interrupted by ancient estuaries and wetlands; only the initial section of Punta Mona is rocky. It ends at the southern tip of Costa Rica, at the mouth of the Sixaola River which serves as the Costa Rica-Panama international border.
Registered changes in the shoreline recorded between the 2005-2010 and 2010-2016 periods revealed 11 coastal erosion hotspots in the Costa Rican Caribbean south as presented below for each established sector:
Cieneguita-Westfalia Sector
In the norther section of this sector is an urbanized area called Barrio Cieneguita, officially called the Cristóbal Colón sector, and to the south, the Limón Airport (Figure 3.b). The Cieneguita-Westfalia sector is influenced by the presence of an important wetland that is located inland; it is a protected area called the Limoncito Wildlife Refuge. The shoreline retreat is more evident south of the jetty (Figure 3.a), an area where the coastal drift of sediments was cut by the construction of said structure. To the south, the shoreline already reaches manmade public infrastructure (sidewalks, bicycle ways and public lighting posts).
The sector between the jetty and the airport runway is considered an erosion hotspot registering a retreat rate of 1,430 m2/year for the 2005-2010 period and 3,936 m2/year for 2010-2016. According to these data, the retreat rate almost tripled in the second period (Figure 3.a). The above points to an apparent erosion process indeed confirmed by field inspection, during which it was also evidenced the resulting deterioration of public infrastructure and the ongoing maintenance works to contain further downgrade by placement of stones and wire meshing (Figures 4 and 5).
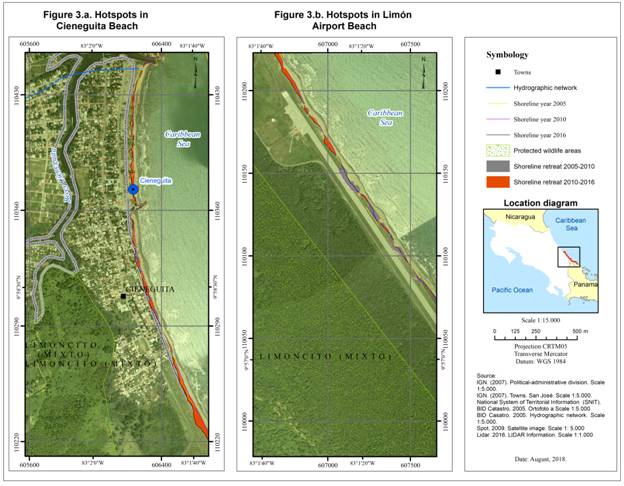
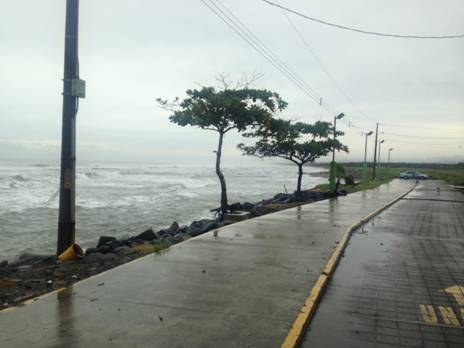
Figure 4 Placement of rocks for public infrastructure protection in Cieneguita Beach. Source: Photograph by G. Barrantes, 2017
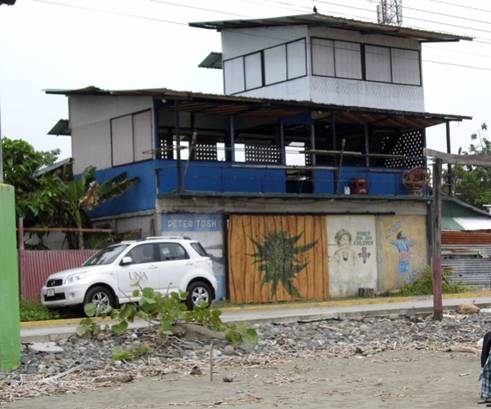
Figure 5 Stone and wire mesh lining for road protection in Cieneguita Beach. Source: Photograph by G. Barrantes, 2017
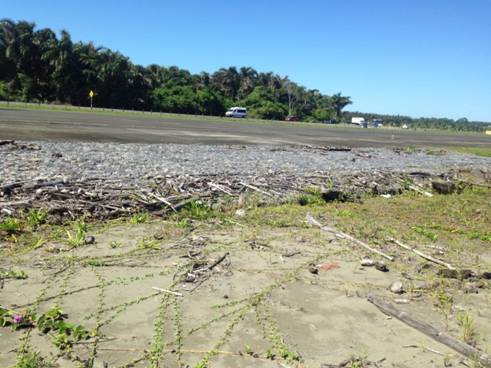
Another erosion hotspot is near the airport (Figure 3.b). For the period 2005-2010, the erosion rate of this sector was 8,801 m2/year and, for the period 2010-2016, it decreased to 1,599 m2/year. To the south of the airport there is a wetland characterized by the presence of small elongated lakes interconnected by channels that drain before reaching the town of Westfalia, thus suggesting an alteration of part of the Cieneguita wetland. The erosion of the beach has affected the asphalt layer of the runway; for its protection, rock and wire mesh covering has been installed (Figure 6).
Westfalia-Cahuita Sector
This is a sector with extensive beaches interspersed with the mouths of important river systems (Figure 2). The littoral dynamic manifests itself in drastic changes in the shape of the shoreline, mainly due to the migration of the mouths. In this sector, the changes in the mouth of the Banano River stand out (Figure 7.a, top left) as causing the local retreat of the shoreline associated with the erosion of the left margin of the mouth and the accumulation of sediments on the right margin. Other river mouths causing significant shoreline changes are those of the Vizcaya River, Bananito River and La Estrella River (Figure 7.b, 7.c and 7.d, respectively).
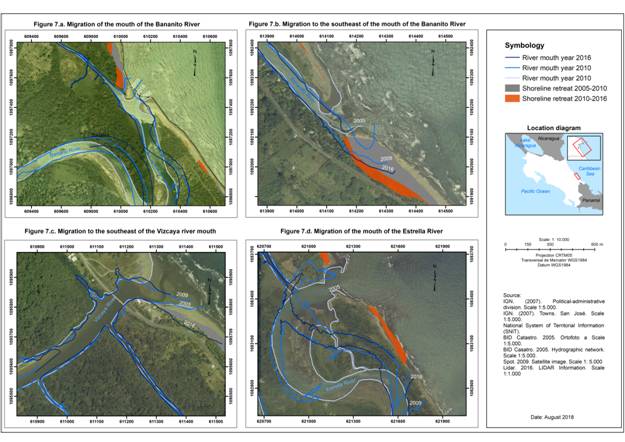
Figure 7 Coastal erosion and migration of river mouths in the Westfalia-Cahuita sector. Figure 7.a. Migration of the mouth of the Bananito River. Figure 7.b. Migration to the southeast of the mouth of the Bananito River. Figure 7.c. Migration to the southeast of the Vizcaya river mouth. Figure 7.d. Migration of the mouth of the Estrella River
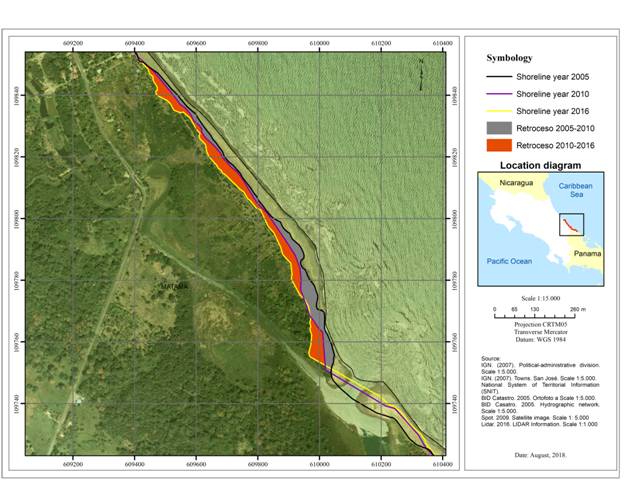
The first hotspot in this sector is located south of the town of Westfalia and is associated with the migration of the mouth of the Banano River (Figure 8). In this section the shoreline has experienced an erosion rate of 4,842 m2/year in the period 2005-2010, a value that increased to 6,471 m2/year between 2010-2016, which shows an increase in erosion dynamics.
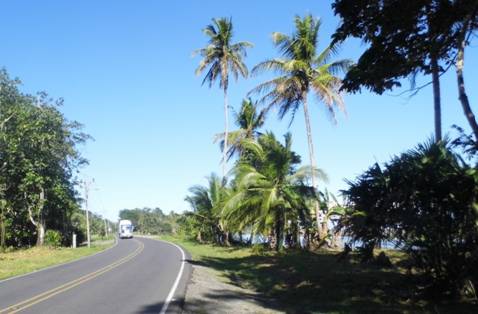
Another critical point of erosion was located at the mouth of the Bananito River (Figure 7.a) where, as in the previous cases, it is related to the migration of the river course. In this case, the proximity of the shoreline with the road threatens the integrity of the main road that gives access to the rest of the region (figure 9). The erosion rate at this point is 2,817 m2/year in the period 2005-2010 and 2,793 m2/year between 2010-2016, which indicates that the rate remains similar between the two periods.
Cahuita Sector
This sector is characterized by the presence of rocky promontories related to an ancient coral paleo-platform described by Battistini & Bergoeing (1984), as well as by the presence of life coral formations in front of Punta Cahuita and protected by the existence of Cahuita National Park (Figure 2).
The first point of accelerated erosion is found within Cahuita National Park, specifically in the area known as Cahuita (Figure 10.a). In this area of the park, shoreline retreat for the period 2005-2010 was 1,300 m2/year, a value that increased to 4,598 m2/year for the 2010-2016 period. These values show that the erosion rate tripled in the most recent period.The other hotspot is in the other area of Punta Cahuita, known as Puerto Vargas (Figure 10.b). At this point the erosion rate was 2,480 m2/year in the period 2005-2010 reaching 9,510 m2/year in 2010-2016. In this area, as in Cahuita National Park, the last period showed a triple increase relative to the 2005-2010. Heavy erosion is quite evident along the access trail to old Puerto Vargas.
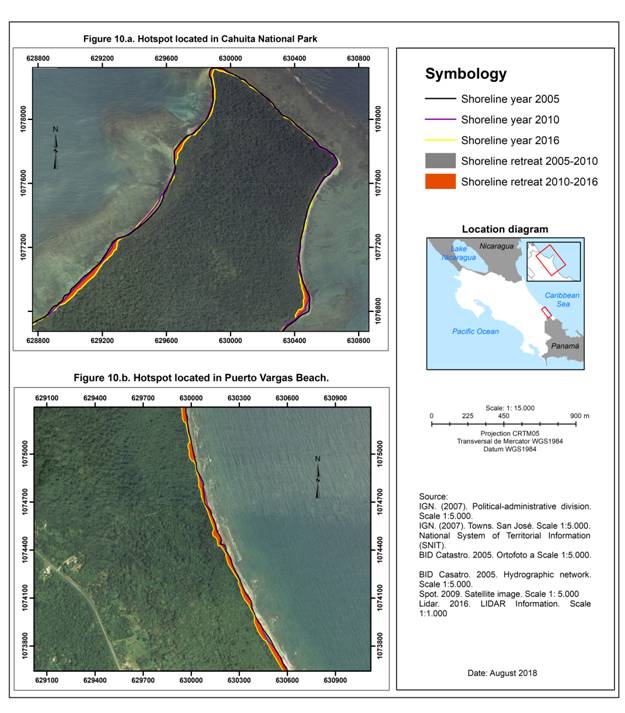
Figure 10 Hotspots located around the Cahuita National Park area. Figure 10.a. Hotspot located in Cahuita National Park. Figure 10.b. Hotspot located in Puerto Vargas Beach.
In the previous points, it is notable that the presence of an extensive current reef, considered the largest in Costa Rica (Cortés et al., 2010), does not seem to represent a natural barrier against erosion, despite harboring the coast in front of the critical points of this land section. It is possible that local variations in depth, together with the presence of rocky channels, could create wave refractions and a redistribution of drift currents thus partially explaining the presence of these two erosion hotspots.
Puerto Vargas-Puerto Viejo Sector
This sector comprises an extensive beach that begins south of Punta Cahuita and ends at Negra Beach in Puerto Viejo, right before the town bearing the same name (Figure 2). In this sector a hotspot is located in the vicinity of the access road to the Puerto Vargas sector of the Cahuita National Park that extends to the south (Figure 10.b). Despite being located within the park, as opposed to the previous sector, these beaches are not protected from the waves by the coral reef.
The erosion in Puerto Vargas Beach recorded 986 m2/year between 2005-2010 and increased remarkably to 8,953 m2/year in 2010-2016 representing a nine-fold increase.
Puerto Viejo-Punta Mona Sector
In this sector we find pocket beaches and some more extensive ones, such as Cocles beach, alternating with rockier areas where the reef formations of the Pleistocene flourish. Near sea level the reef lifted by the 1991 earthquake becomes prominent. Also, underwater reef patches appear. Almost the entirety of this sector is located within the Gandoca-Manzanillo Wildlife Refuge which is managed under a mixed state-private administration model (Figure 2).
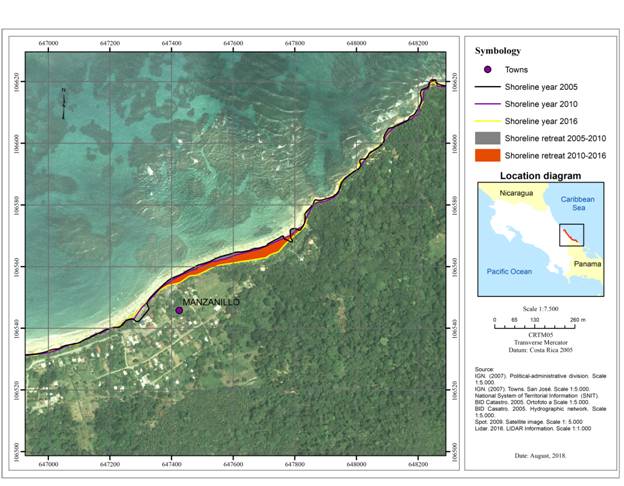
Manzanillo Beach is located in front of a reef that is considered by Cortés et al., (2010) as an incipient crest of algae; according to these authors, as of 2003, the life coral formation covered only 7% of the extension of the beach. As in the case of the previously described sectors, the erosion rate of the beach was moderate in the period 2005-2010 reaching a value of 745 m2/year, which increased to 1,678 m2/year between 2010-2016; this represents a two-fold increase (Figure 11).
Punta Mona-Sixaola Sector
It is an extensive convex beach facing the Caribbean Sea interrupted by current and ancient estuaries that are currently maintained as wetlands (Figure 2). The area includes two long beaches: Mile Creek and Gandoca. The town of Gandoca is located within this sector and has a low population density.
Three hotspots have been discovered in this sector, the first in Mile Creek, a locality also known as Quebrada Milla (Figure 12.a). In this case, the section of shoreline retreat extends along the beach. For the period 2005-2010, the erosion rate was 626 m2/year, a value that increased more than seven-fold in the second period from 2010-2016, reaching a value of 4,865 m2/year.
The second hotspot is found near the access road to Gandoca Beach (Figure 12.b). It is a small area where, as in the previous case, erosion was lower for the 2005-2010 period with a rate of 1,194 m2/year that increased three times to 3,642 m2/year for the period 2010-2016.
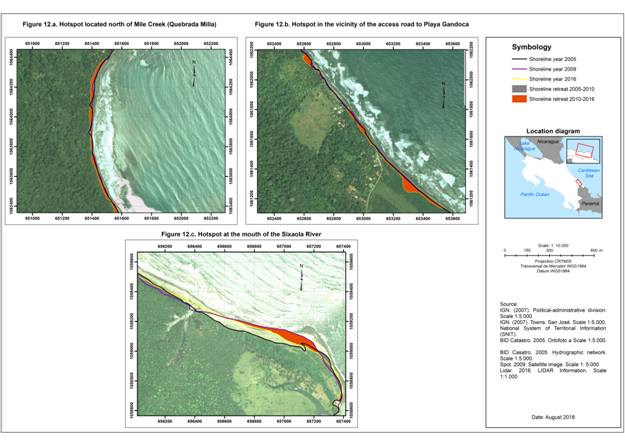
Figure 12.b Hotspot in the vicinity of the access road to Playa Gandoca. Figure 12.c. Hotspot at the mouth of the Sixaola River
The last section of this sector is the beach located between the Gandoca Lagoon and the Sixaola River (Fig. 12.c), in this point erosion rate reached 1,697 m2/year in the period 2005-2010 and, increased more than four-fold to 7,456 m2/year in the period 2005-2016.
Discussion
A division of the shoreline into sectors based on geomorphological similarities was made for referencing purposes while analyzing accelerated erosion processes in beaches of the Caribbean south of Costa Rica. In all the defined sectors, hotspots of coastal erosion were found. The shoreline retreat occurs in extensive straight and concave beaches, in the presence of river mouths, pocket beaches, even in areas protected from direct waves by coral reefs. This leads to the conclusion that Costa Rica’s Caribbean south coast is experiencing an extended process of coastal erosion that manifests itself in eleven critical points along the coast.
The beaches that have experienced the greatest surface area loss for the 2005-2010 period were: the section near Puerto Vargas (71,924 m2), Westfalia (63,038 m2), Puerto Vargas Beach south of the old berth (58,650 m2) and Bananito Beach to the south of the mouth of River of the same name (53,599 m2).
Table 2 and Table 3 summarize the beaches that experienced the highest erosion rates in the two analyzed periods.
Table 2 Beaches with the highest erosion rates in the period 2005-2010.
| Locality | Rate | Period |
|---|---|---|
| Limón Airport | 8,801 m2/año | 2005-2010 |
| Westfalia | 4,842 m2/año | 2005-2010 |
| Puerto Vargas in Punta Cahuita | 2,972 m2/año | 2005-2010 |
| Mouth of Bananito River | 2,817 m2/año | 2005-2010 |
Source: own elaboration.
Table 3 Beaches with the highest erosion rates in the period 2010-2016.
| Locality | Rate | Period |
|---|---|---|
| Puerto Vargas in Punta Cahuita | 9,510 m2/year | 2010-2016 |
| Puerto Vargas Beach south of the old berth | 8,953 m2/year | 2010-2016 |
| Gandoca Beach up to the mouth of the Sixaola River | 7,456 m2/year | 2010-2016 |
| Westfalia | 6,471 m2/year | 2010-2016 |
Source: own elaboration.
The greatest increase in erosion rates for the period 2010-2016, compared to the previous period 2005-2010, was seen in Cahuita, specifically in the Puerto Vargas section, followed by Gandoca in Mile Creek Beach and between Gandoca Lagoon and at the mouth of the Sixaola River. Conversely, the beaches where the erosion rate was reduced were Bananito Beach and Limón Airport Beach (Table 2 and 3).
Even though correlation analyses are not carried out in the present investigation, it is conceivable to analyze some possible causes of the presence and increase in erosion processes in the Caribbean south coast of Costa Rica. In the first place, the presence of shoreline civil works (i.e. buildings) seem to explain the erosion found only in Cieneguita Beach, due to the presence of a jetty that, according to the evidence found in aerial photography and the detailed study of shoreline evolution in this sector made by Barrantes et al., (2017), would explain the accelerated erosion that occurs south of the buildings, a process that may even be affecting a hotspot located near Limón Airport Beach. The other beaches lack civil works that could significantly alter the distribution of sediments by coastal drift or wave conditions.
As for the supply of sediment by rivers, no construction of reservoirs and dams have been confirmed that would limit sediment transport to the coast. Although dredging has been performed to mitigate floods, they are punctual in time and space, so their impact is limited.
Similarly, no significant changes in land which can modify the availability of sediments have been experienced. However, like in the rest of the country, the watersheds that flow into this area have experienced an increase in forest coverage that may be causing a decrease in the contribution of sediments, without there being studies to substantiate this idea.
Regarding the increase in sea level, BIOMARCC-SINAC-GIZ (2013) presents annual rates of around 2 mm/year this region, a value that does not differ from world average. This constant increase in sea level can be one of the causes of the erosion process. However, local geodynamics play a first order role in compensating for this effect. In this sense, the seismic lifting associated with the 1991 Limón earthquake provoked a generalized coastal uplift, a process that favored shoreline displacement towards the sea. Currently, no data is available to assess the participation of local geodynamics in the observed coastal erosion processes.
In this sense, regional tectonics may be playing a role in costal erosion processes, similar to the interplay observed in the coast of the Nicoya Peninsula. In this sector of the north Pacific, earthquakes that raise the coast alternate with periods of absent littoral activity lasting approximately 50 years, due to plate coupling in a subduction zone, consequently creating a downward drag of the upper plate (Norabuena et al., 2004; M. Protti, Güendel, & Malavassi, 2001). The Caribbean south is also known for presenting periodic earthquakes causing coastal uplift (Alvarado & Cárdenas, 2016 P. Denyer, Arias, & Personius, 1994, J. S. Marshall, 2007). Although the geodynamics and tectonics of this Caribbean margin do not correspond to a subduction zone proper, the mechanism of strain accumulation and coastal subsidence that could exist between periods of large uplifting earthquakes have also not been studied in detail, conditions/phenomena that could help explain the accelerated erosion processes that, so far, lack a clear explanation.
Other possible explanatory variables are related to climate variability, in particular, "El Niño" phenomenon, fluctuations in local marine currents, changes in wave patterns related to cyclonic storms for which limited data are known to allow correct assessment of their contribution to the erosion processes.
Conclusions
We identified 11 hotspots of coastal erosion in the Caribbean south of Costa Rica. These beaches are located in Cieneguita, Limón Airport, Westfalia, Bananito Beach, Blanca Beach of Cahuita, Puerto Vargas around the old berth, Puerto Vargas Beach south of the access road, Manzanillo, Mile Creek, Gandoca and Sixaola.
The location of these hotspots includes the different types of shoreline described, according to the delimitation used, which includes: extensive straight beaches exposed to waves, with the presence of river mouths, small horseshoe shaped beaches between rocky promontories (pocket beaches), and even areas protected from direct waves by coral reefs. This fact leads to affirm that an extensive process of accelerated erosion is occurring in the Caribbean south of Costa Rica.
The beaches that experienced the greatest surface area loss during the study period (2005-2010) were: Westfalia, Puerto Vargas, Puerto Vargas Beach south of the old berth, and Bananito Beach south of the mouth of the Bananito River. Likewise, the greatest increase in erosion rates in the second analyzed period (2010-2016) were recorded in Puerto Vargas around the old berth and in Gandoca. Conversely, beaches showing a decreased erosion rate were Bananito Beach and Limón Airport Beach.
Erosion processes are evident in the field and have even led to mitigation works, among which the covering with rocks and the construction of stone walls stand out as community protective measures in the beaches of Cieneguita, Limón Airport and along National Route 36 near the mouth of the Bananito River.

