


 Spanish (pdf)
 Article in xml format
 Article references
 Send this article by e-mail
 Cited by SciELO
  Similars in
SciELO
Similars in
SciELO 
 Permalink
Introduction
To assess the impact of land use change (LUC) on the water balance of watersheds across scales is one of the major challenges in research (1). This can be achieved by using hydrologic models for the simulation of possible land use change scenarios (2). Increasing studies of land use change impacts on the water balance budget of watersheds have shown the importance of hydrologic modeling for evaluating such impacts (3) (4) (5) (6) (7).
However, for scenario analysis a well-calibrated model is required in order to achieve reliable predictions (8), (9). This can be achieved in well-monitored watersheds but is a challenge in areas with scarce data availability or ungauged basins (10). One way to overcome data scarcity is the use of remotely sensed data for improving evapotranspiration estimations and/or hydrologic modeling (11) (12) (13) (14) (15) (16).
The Costa Rican Irazú Volcano erupted in 1963. Volcanic ash along with climatic conditions struck Taras and Cartago cities with land and mudslides (17). In order to stabilize the soils, a forest plantation was established upstream the Reventado river sub-basin (18). The reforestation took place in 1964-65 with exotic and native species (18). Since then, these plantations have not received any silvicultural treatments. There is an interest on behalf of the National System of Conservation Areas (SINAC) to rehabilitate this area. Thus, the “Ecological rehabilitation pilot plan of the Irazú Volcano National Park - Prusia Sector” intends to develop the ecological rehabilitation plan by studying current conditions and simulate different rehabilitation approaches. One of the most important aspects of the rehabilitation plan is to understand how land cover changes may affect the hydrologic balance of the sub-basin.
This study aims to understand the variations in the hydrologic cycle of the Reventado river sub-basin, if exotic forest plantations are changed to 1) pasture, and 2) natural forest. Pasture represents the worst and unlikely case scenario, whereas evergreen forest denotes the best-case scenario -that is the rehabilitation plan. Since scarce climatic data was an issue for this study area and no field data was available for calibrating the hydrological model, an analysis was conducted in order to establish if evapotranspiration values extracted form MODIS16A2 dataset could be used for calibration. The analysis was made comparing results of two calibration models 1) parameterized but non-calibrated approach (PNCA), and 2) parameterized and calibrated approach (PCA).
Material and methods
Study site
The study area corresponded to the Reventado river sub-basin, located in Cartago Province, Costa Rica. The area of the sub-basin was 21.5 km². The average annual precipitation was 1 837 mm and the average annual temperature corresponded to 14.6 °C, according to Llano Grande weather station. The climate diagram from 2006-2016 can be found in figure 1.
As shown in figure 1 dry season goes from January to March, while April and December might be considered as transitional months, and from May to November the rainy season occurs. This seasonality behavior is more like the Pacific Climate Regime than the Atlantic Regime, according to the National Meteorological Institute of Costa Rica (19).
This sub-basin is of great importance for its role in water production for human consumption, as well as irrigation for food production -concentrated in the middle part of the sub-basin. Figure 2 shows the location of the sub-basin as well as its main land use cover -according to SWAT land use and land cover classification: 37 % Agriculture (AGRL), 8 % Eucalyptus sp. (EUCA), 1 % Pinus sp. (PINE), 42 % Evergreen forest (FRSE), 3 % Pasture (PAST), and 1% High-density urban area (URHD). Cupressus lusitanica (Mill) cover was considered as Pinus sp. for this study.
SWAT model inputs
QSWAT 1.4 was used in QGIS Brighton 2.6.1, this software uses four main inputs:
1. Digital Elevation Model (DEM): ALOS PALSAR RTC DEM with a resolution of 30 m was used (20) to delineate the watershed boundaries, the sub-basins and stream network in QSWAT. This DEM had the strongest correlation with field data of the study area. Using this information, SWAT delineated eight sub-basins within the Reventado river sub-basin- shown previously in Figure 2.
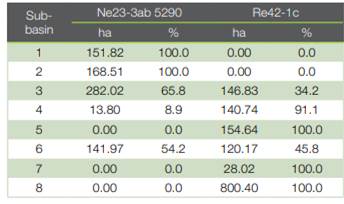
2. Soil layer: Food and Agriculture Organization of the United Nations & United Nations Educational Scientific and Cultural Organization (21) soil layer was used. The spatial resolution of this layer is approximately 5.5 km. Soil distribution by sub-basin can be seen in table 1, two main soils were found in the study area:
- Ne23-3ab: sub-basins 1, 2, 3, 4 and 6.
Eutric nitosols, with 20 % or more of humic andosols and less than 20 % of vertic cambisols (21). It presents a fine texture (21).
- Re42-1c: sub-basins 3, 4, 5, 6, 7 and 8.
Eutric regosols, where lithosols are dominant and presence of humic andosols is estimated -with coarse texture (21).
3. Land use and land cover data: A supervised classification of a Copernicus Sentinel-2 image (22) using SCP (Semi-Automatic Classification Plugin - available through QGIS) was performed. An overall 68 % of classification precision was estimated from field data collected in 2017. Table 2 shows the land use distribution by sub-basin.
The agricultural areas in the Reventado river sub-basin, consists in vegetables crops such as onions, carrots and potatoes according to (23) and field trip observation along the sub-basin.
4. Meteorological data: The Meteorological National Institute (24) facilitated daily data from two weather stations for the period 2006-2014: Llano Grande and Irazú. Llano Grande had temperature and rainfall data. Meanwhile, Irazú had temperature, rainfall, relative humidity, solar radiation & wind. Rainfall data of Prusia was available from 2015 to 2016 (25); this information was used in order to determine if rainfall data of Llano Grande and/or Irazú could be used.
There are two main climate regimes in Costa Rica, the Pacific and the Caribbean (19). Prusia and Llano Grande rainfall data suggests they have a Pacific regime behavior, whereas Irazú a Caribbean more likely behavior. Thus, rainfall data from Irazú was dismissed.
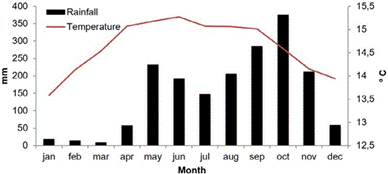
Figura 1. Climograma de la estación climática Llano Grande, basado en datos de 2006 a 2016.
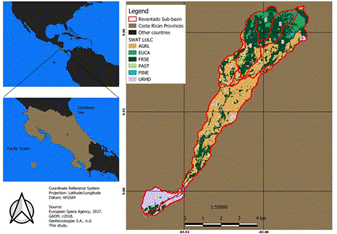
Figura 2. Ubicación de la sub-cuenca del río Reventado y su cobertura de uso del suelo.
Missing values in the Llano Grande weather station dataset were estimated using regression analysis.
Model set up
SWAT defines Hydrologic Response Units (HRUs) using land use, soil layer and a slope map. Thus, the software is able to identify areas that behave in a similar way. The slopes were grouped as follows: 0-30 %, 30-60 % and more than 60 %. A total number of 117 HRUs were estimated by SWAT.
The analysis was performed from January 2006 to December 2013.
Four variables were used for parameterization (PNCA & PCA models). The values were set following recommendations of (26) as:
• BLAI (Maximum potential leaf area index): for forest cover = 10
• ALAI (minimum leaf area index): for forest cover = 5
• CN (curve number): 35 for forest cover
• Irrigation: Auto irrigation for crop areas, heat units = 0.2
Further parameterization could not be made, as scarce data is an issue for the study area.
MOD16A2 product
MOD16A2 product (27) refers to 8-day accumulated evapotranspiration estimation at 500 meter pixel resolution. It is based on the Pennman-Monteith equation and considers albedo and land cover (28). Table 3 shows the amount of pixels by sub-basin, but it is important to point out that the raster dataset presented missing values due to cloud cover especially in wet season and the upper part of the sub-basin. Hence the number of pixels for 8 day accumulated evapotranspiration for every sub-basin varied through time.
Calibration process
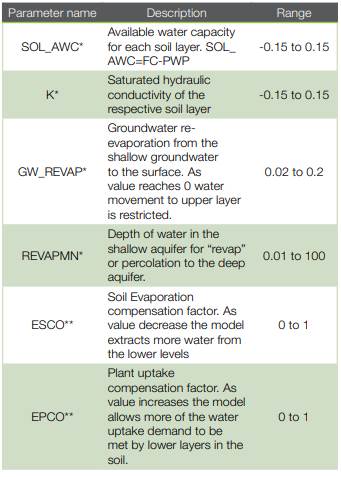
In order to better represent simulated evapotranspiration, we have generated a set of 500 combinations of parameters listed in table 4. These parameters influence the simulated evapotranspiration and have been selected according to (29). The parameter sets have been determined by varying the parameters in given ranges (table 4) with a Latin-Hypercube based algorithm within the R-Software (30).
Table 2 Land use distribution by sub-basin according to SWAT’s classification system: AGRL: Agricultural area; EUCA: Eucalyptus; FRSE: Evergreen forest; PAST: Pasture, PINE: Pine (for the purposes of this study cypress was considered as pine); URHD: High-density urban area.
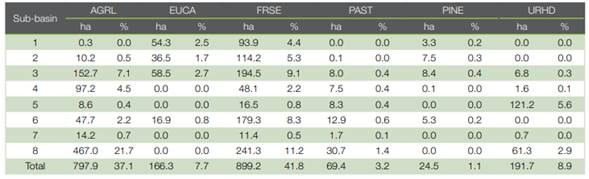
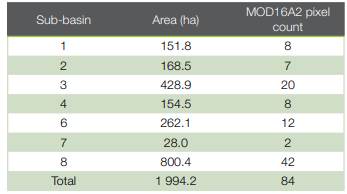
Table 4 Description of parameters and ranges used in the calibration process; * parameter changed relatively to initial value from the database; ** parameter change separately for the land use classes PINE, AGRL, EUCA, FRSE, PAST.
For each parameter set, a model simulation has been carried out and results were saved for each run. Results were analyzed in R-studio through the calculation of the coefficient of determination of simulated and observed 8-day accumulated ET in order to identify the parameter set that presented the strongest relation with the MOD16A2 product following the analysis of (14) (15) (16), (29).
The time-series for both the calibration and validation analysis were four years each. Data from 2010-2013 was used for calibration, whereas the validation process data from 2006-2009 was used.
Scenarios
The parameter set of the run with the strongest relation with the MOD16A2 was updated in SWAT in order to determine the impact in the water balance at the sub- basin scale due to changes in land cover. The main objective of the ecological rehabilitation plan is to change the exotic forest plantations (Pinus sp., Eucalyptus sp., and Cupressus lusitanica) for a more natural ecosystem. Therefore three scenarios were considered: 1) “Current”, refers to current land use; 2) “Forest”, indicates exotic plantations converted to evergreen forest -which denotes a total increase from 899.2 ha to 1 090 ha of evergreen forest; 3) “Pasture”, denotes exotic plantations converted to pasture -which implies an increase from 69.4 ha to 260.2 ha of pasture.
Therefore, the impact of land use change was analyzed in two dimensions, the Reventado river basin and the impacted sub-basins within the Reventado river basin - presented previously in table 5. Moreover, top four runs from the calibration process parameter sets were updated in SWAT for the impacted sub-basins, and the following five output variables were analyzed: evapotranspiration (ET), percolation (PERC), surface runoff contribution to stream flow (SURQ), ground water contribution to stream flow (GWQ) and water yield (WYLD).
Results and discusión
Calibration comparison analysis
Twenty-four parameter sets had a determination coefficient of 0.5. Table 6 and 7 exhibits the results of the top 5 runs for the calibration and validation analysis, respectively.
As shown in figure 3, as MODIS 8-day accumulated ET increases the simulated 8-day accumulated ET (Run 062) decreases. This result suggests that MOD16A2 overestimates ET. We found high values of ET in months that are considered to be dry season, for instance in sub-basin 1 in March 2009 MOD16A2 product reported an 8-day accumulated ET of 43 mm whereas simulations show an 8-day accumulated ET of 3 mm. The average precipitation in March is around 8 mm, it is highly unlikely that an ET of 43 mm could happen. Another explanation would be a high groundwater levels in this area, which could sustain transpiration of the vegetation in dry periods. Nonetheless, no good coefficient of determination could be found when separating wet and dry season (all those values for the 8 sub-basins were under 0.1). One reason for it could be that for wet season cloudy conditions are expected, thus MOD16A2 has higher missing values and there is a high possibility that clouds cover might have been unmasked. According to (31), MOD16A2 8-day accumulated ET overestimation can be explained due to: 1) overestimated MODIS Leaf Area Index data, 2) Enhanced Vegetation Index inaccuracy values and 3) misclassification issues.
The best run (#062) was selected based on the coefficient of determination value performance in the calibration and validation analysis (Table 6 and 7). Therefor the parameter set from this run was selected for further scenario analysis. Table 8 shows annual outputs of the two models analyzed.
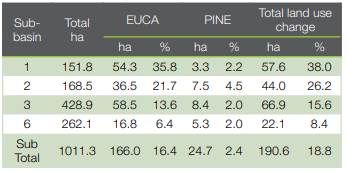
Table 6 Top 5 coefficient of determination values out of 500 runs, calculated from the simulated (runs) and observed ET values (MOD16A2), both 8-day accumulated data by sub-basin for the calibration process.
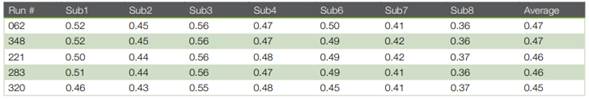
Table 7 Top 5 coefficient of determination values out of 500 runs, calculated from the simulated (runs) and observed ET values (MOD16A2), both 8-day accumulated data by sub-basin for the validation process.

PCA displayed lower values in ET, and higher values in PERC, SURQ, GW & WYLD compared to PNCA. These results suggest that ET calibrated data have an important impact in hydrological SWAT modeling. Moreover, ET value of PNCA suggests an over-prediction, also reported by (14).
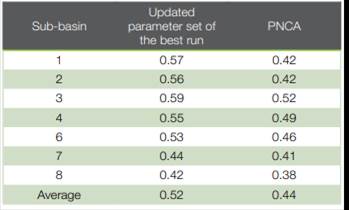
The coefficient of determination for the comparison between the PNCA and the updated parameter set of the best run with MOD16A2 data is shown in table 9.
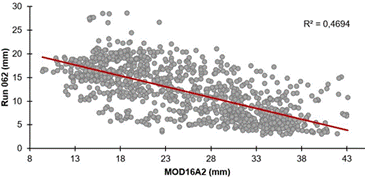
Figure 3 Scatter plot with ET (mm) data for calibration purposes between the best-selected run (062) and MOD16A2 product dataset.
Figura 3. Gráfico de dispersión con datos ET (mm) para fines de calibración entre la mejor corrida (062) y datos del producto MOD16A2.
An overall better performance was found by updating the parameter set chosen in the calibration process. Specially, sub-basins 1, 2, 3 and 6 presented better results, which may suggest that EPCO and ESCO values for evergreen forest, Eucalyptus sp. and Pinus sp. helped improving the results.
Since 1) statistical differences were observed between PNCA and PCA, 2) several studies (11), (14), (15), (32) have reported better estimates as a result of calibration process with remotely sensed evapotranspiration data, and 3) the coefficient of determination for the updated parameters set values was higher than the PNCA (0.52 vs 0.44, respectively), those parameters set values were used for modeling impacts in water balance of the sub- basin due to changes in land cover.
Table 8 Annual output comparison values for parameterized but non-calibrated approach (PNCA) and parameterized and calibrated approach (PCA).
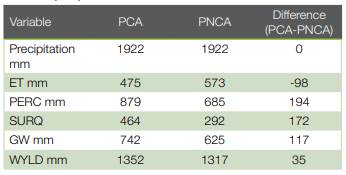
Table 9 Coefficient of determination for PNCA and the updated parameter set of the best run compared to MOD16A2 data - per sub- basin.
Impact of land cover changes in water balance components
Reventado river sub-basin
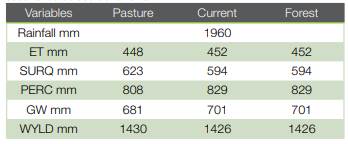
For this study, land use changes in the exotic plantations areas were used to model impacts in the water balance of the sub-basin. Nonetheless, those areas represent 9% of the sub-basin, thus small changes were expected. Table 10 exhibits the annual average values for the output variables considered.
Differences between “Current” and “Forest” cover were expected to be low, because of the similar hydrological response of forest plantations and evergreen forest, e.g. interception and infiltration. Land use change from exotic plantations to pasture showed an increase in surface flow by 5 % annually (higher values are observed in rainy season) and 3 % annual decrease in ground water contribution to stream (lower values observed in dry season). Distinct variations in SURQ and GW are shown in Figures 4 and 5.
In both figures (4 and 5) the green line is closer to zero; therefor differences between current plantation cover and a natural forest scenario are low. Whereas the blue line often moves away from zero, reflecting a different hydrological response of the watershed if forest plantations are changed to pasture. This is also shown in Figure 6.
The amount of surface runoff contribution from stream flow is one of the components with the highest percentage differences, of 5 % annual.
Other authors also found increases in surface runoff and decreases in ground water flow as a result of the conversion of forest to other land use, such as agricultural land (33), or pasture (6). If current forest plantations are converted to pasture, an increase on stream-flow is to be expected (as stated by (34)), especially in rainy season, as reported by (33), (2), and (35). Meanwhile, groundwater contribution to stream decreases, which might have an important impact in irrigated crop areas along the middle part of the sub-basin and the water flow in the dry season-which relies on groundwater flow.
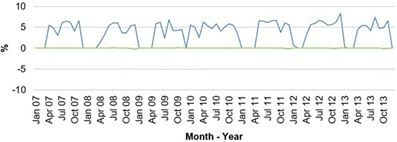
Figure 4 Percentage differences of SURQ (amount of surface runoff contribution from stream-flow) in changes of land cover between current and pasture (blue line), & current and natural forest (green line).
Figura 4. Diferencia en porcentaje de SURQ (cantidad de escorrentía superficial que llega al cauce) debido al cambio de uso entre la cobertura actual a pasto (línea azul), y entre la cobertura actual a bosque natural (línea verde).
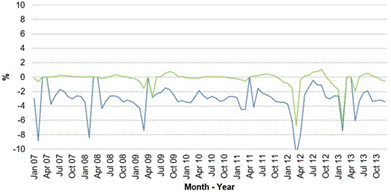
Figure 5 Percentage differences in GW (ground water contribution to stream) changes of land cover between current and pasture (blue line), & current and natural forest (green line).
Figura 5. Diferencia en porcentaje de GW (contribución del agua subterránea al caudal) debido al cambio de uso entre la cobertura actual a pasto (línea azul), y entre la cobertura actual a bosque natural (línea verde).
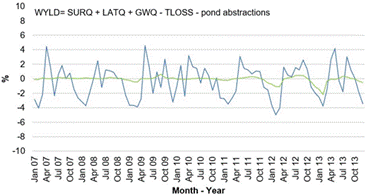
Figure 6 Percentage differences in WYLD (water yield) changes of land cover between current and pasture (blue line), & current and natural forest (green line).
Figura 6. Diferencia en porcentaje de WYLD (producción de agua) debido al cambio de uso entre la cobertura actual a pasto (línea azul), y entre la cobertura actual a bosque natural (línea verde).
Directly impacted sub-basins due to land cover change
Sub-basins 1, 2, 3 and 6 will be directly impacted due to land cover change. Therefore, larger differences in the water balance were expected. Land use changes from exotic plantations to pasture showed an increase in surface flow of 12 % annually (higher values are observed in rainy season) and 3 % annual decrease in ground water contribution to stream (lower values observed in dry season). Results per sub-basin can be seen in table 11.
The analysis of the impacted sub-basins allowed observing differences that were unmasked in the overall Reventado river sub-basin. Sub-basin 3 showed important hydrologic behavior differences, especially in the “Pasture” scenario: a considerable increase in SURQ and lower values in PERC & GWQ were observed.
Sub-basin 1 shows similar response in all three scenarios, whereas sub-basin 3 represents the one with biggest differences in all 4 variables. Those differences might be explained because sub-basin 3 had the highest sum area to be changed (66.9 ha), followed by sub-basins 1, 2 and 6. Moreover, it seems that for sub-basin 1 land use is not an important factor in water balance budget. In contrast, sub-basin 6 which has the least amount of hectares been impacted directly constitutes the second sub-basin with more averaged impacts in all 4 analyzed variables, only surpassed by sub-basin 3.
Table 11 Annual output average values (mm) of the updated parameter set of the top four runs, for three land use scenarios for the impacted sub- basins- period 2006-2013, coefficient of variation in brackets.

The green line was closer to zero (especially in figure 7 and 9) therefor differences between current plantation cover and natural forest scenario was low. Whereas the blue line often moves away from zero, reflecting a different hydrological response of the watershed if forest plantations are changed to pasture. Moreover, differences are larger in the impacted sub-basins, than the Reventado river sub-basin. For instance, SURQ showed near 40 % increase values if exotic plantations are changed to pasture, whereas GW presented decreases of near 8 % in the same land use scenario.
Ecological rehabilitation for Prusia
Results of this study suggest an increase in surface runoff and consequently erosion for the pasture scenario, which can have great consequences in various water users along the sub-basin. Therefore, careful planning must be undertaken for the conversion of forest plantations to natural forest, especially in sub-basin 3. The pilot project is considering a plan for changing current plantations cover to natural forest in a long time-period -depending on results of the pilot areas that have been established for selecting the best method for ensuring a rapid growth of natural forest. Results of this study reinforce the approach of carrying out an intervention in small areas over a prolonged time period, ensuring that pasture-like cover areas are small and quickly replaced by natural forest. Furthermore, it is expected that a buffer area around pine, cypress and eucalyptus plantations will be affected due to cutting and wood extraction, this can have an additional impact in the hydrological response of the sub-basin. Therefore, cutting and wood extraction must be well planned and carefully executed. In some areas-especially in steep conditions- some soil conservation works may be required to decrease runoff speed and, consequently erosion.
Moreover, an important variable needs to be considered: presence of hydrophobic soils. This happens in the first 5 cm of soil (36), this layer is most likely to be removed or perturbed during wood extraction. Therefor infiltration rate is expected to increase, this may have an effect in percolation and groundwater that the hydrological model is currently not “perceiving”.
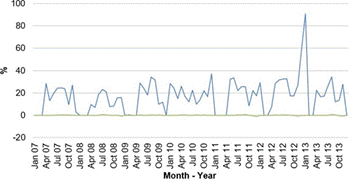
Figure 7 Percentage differences of SURQ (amount of surface runoff contribution from stream-flow) in changes of land cover between current and pasture (blue line), & current and natural forest (green line) for the impacted sub-basins.
Figura 7. Diferencia en porcentaje de SURQ (cantidad de escorrentía superficial que llega al cauce) debido al cambio de uso entre la cobertura actual a pasto (línea azul), y entre la cobertura actual a bosque natural (línea verde) para las sub-cuencas impactadas.
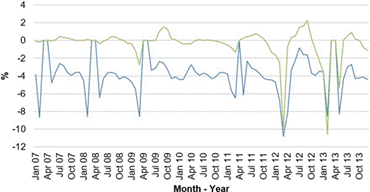
Figure 8 Percentage differences in GW (ground water contribution to stream) changes of land cover between current and pasture (blue line), & current and natural forest (green line) for the impacted sub-basins.
Figura 8. Diferencia en porcentaje de GW (contribución del agua subterránea al caudal) debido al cambio de uso entre la cobertura actual a pasto (línea azul), y entre la cobertura actual a bosque natural (línea verde) para las sub-cuencas impactadas.
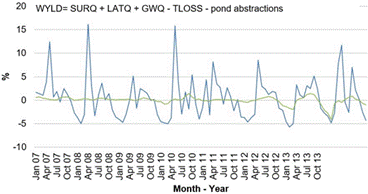
Figure 9 Percentage differences in WYLD (water yield) changes of land cover between current and pasture (blue line), & current and natural forest (green line) for the directly impacted sub-basins.
Figura 9. Porcentaje de diferencias en WYLD (producción de agua) debido al cambio de uso entre lo presente actualmente a pasto (línea azul), y entre lo presente actualmente a bosque natural (línea verde).
It is important to consider that other land use changes may occur in the study area that are not being contemplated, for instance urban expansion in the mid and low part of the sub-basin. Such changes may result in an increase on surface runoff, as reported by (5).
Because no field data on water flow was available, we cannot affirm that ET calibration results in better estimates. Nonetheless, in un-gauged basins ET calibration process from freely accessible datasets such as MODIS provide a useful tool to calibrate hydrological models and constrain parameter ranges.
Conclusions
Calibration process with MODIS16A2 actual evapotranspiration data results in statistical differences in evapotranspiration, soil water content, percolation, surface runoff contribution to stream flow and ground water contribution to stream flow compared to parameterized but non-calibrated model. As past studies have shown promising results in using MODIS16A2 product for calibration this dataset was used for modeling land use changes in the sub-basin.
The amount of surface runoff contribution to stream- flow as well as groundwater contribution to stream flow are the variables mostly affected if current exotic forest plantations are converted to pasture -,+ 5 % difference (especially in rainy season) and -3 % annual differences values (especially in dry season), respectively.
Small percentage differences were found if current forest plantations are converted to evergreen forest - in rare occasions percentage differences where higher or lower than 2 % annually. Therefor it is expected that the ecological rehabilitation will at least preserve current hydrological behavior in time, assuming same precipitation and temperature regimes.
Greater differences were observed in directly impacted sub-basins, especially in sub-basins 3 and 6. Surface runoff contribution to stream-flow was higher in those sub-basins if current plantations are changed to pasture, whereas a decrease in groundwater contribution to stream was estimated.
The results of this paper suggest that careful wood extraction and rehabilitation planning is needed in order to assure low impacts in the hydrology behavior of the sub-basin. Overall, woodcutting, and extraction activities should procure low buffer area impacts whereas rehabilitation plan should attend fast vegetation cover in bare soils.
Long period and well instrumented watersheds can be used to try different hydrological inputs of remote sensing datasets in order to determine uncertainties and novel methodologies for un-gauged watersheds in neo- tropical countries.

