


 Inglés (pdf)
 Articulo en XML
 Referencias del artículo
 Enviar articulo por email
 Citado por SciELO
  Similares en
SciELO
Similares en
SciELO 
 Permalink
1. Introduction
This study analyzes the empirical connection between macroeconomic figures linked to the economic cycle (i.e., gross domestic product (GDP) per worker) and the rate of work accidents in Peru's industries during 2016-2021.
Occupational accidents are unintended events that have a major negative impact on workers and their families (Hämäläinen et al., 2017; ILO, 2019; Lafuente & Abad, 2021). According to the International Labor Organization (ILO, 2019) more than 2.78 million workers die each year from work accidents and occupational diseases and 374 million workers suffer non-fatal work accidents that result in more of 4 days of work absenteeism. The ILO (2019) estimates that the annual economic burden of poor work safety practices represents about 3.94 percent of the global GDP.
In Peru, the rate of work accidents (number of accidents per 100,000 workers) has increased by 66% between 2011 and 2018. This is evidence of a public problem which might be caused by limited occupational health and safety practices and controls. To deal with this social and economic problem, the Peruvian government has enacted the 'National Policy on Safety and Health at Work' whose objective is to reduce 20% the rate of work accidents and occupational diseases by 2030 (CONSSAT, 2021). This national plan recommends generating government structures, as well as a work culture that promotes occupational safety among Peruvian businesses through education and the implementation of work safety practices that allows reducing occupational risks (Lafuente & Abad, 2021). In addition, the plan promotes the timely notification of accidents and occupational diseases to learn about trends that not only facilitate the identification of unsafe working conditions but also allow to develop strategies and action plans to improve businesses' work safety management.
This article focuses on the study of the relationship between occupational accidents and economic activity in Peru. In this sense, I address the following questions: is there a causal relationship between economic activity and work accidents in Peru's industries? And, if so, are the analyzed causality effects consistent across industries?
To answer these questions empirically, the empirical application employs panel data techniques (fixed-effects models and panel VAR models) on a sample of 15 industries during the period 2016-2021. The empirical results confirm the pro-cyclical relationship between the rate of work accidents and economic activity (GDP per worker) in Peru. Additionally, the findings reveal that the short-run causal relationship between GDP per worker and work accident rates is more prevalent in sectors traditionally defined as risky to workers, namely primary industries (mining, agriculture and fishing), construction, manufacturing, and transportation.
The relevance of this research surpasses an empirical exercise and has implications for policy makers interested in improving work safety conditions. Occupational accidents are a negative consequence of economic activity, and the analysis presented in this study offers arguments that further validate the importance of improving the monitoring activity of the country's safety system over businesses' operations, especially in accident prone industries. Additionally, to the best of my knowledge, this is the first study addressing the relationship between work accidents and economic activity in Peru. Therefore, this article updates the limited evidence on this statistical association in developing settings.
The rest of the paper is organized as follows. Section 2 presents the background theory. Section 3 deals with the data and the empirical strategy. Section 4 presents the empirical results, while Section 5 offers the concluding remarks, implications, and future research lines.
2. Background theory
Rooted in the seminal work by Kossoris (1938) , and subsequent significant contributions by, among others, Nichols (1989) , scholars and policy makers have made considerable efforts to evaluate the relationship between macroeconomic figures and the rate of work accidents (Davies et al., 2009; Asfaw et al., 2011; Boone et al., 2011; Fernández-Muñíz et al., 2018; Wu et al., 2018; Lafuente & Daza, 2020; Lafuente & Abad, 2021; Murrell-Blanco, 2023).
In theorizing the relationship between economic activity and work accidents, the dominant framework supports the view that economic activity and, in particular, the state of the economic cycle (expansion or recession) conditions resource exploitation, especially labor. Therefore, the economic activity is a powerful factor explaining the longitudinal variations in work accident rates across territories.
These arguments are used to explain the observed trends in work accident rates in periods of economic expansion and recession. When the economy grows, businesses tend to increase their activity to satisfy market demands and, consequently, employment figures improve. It follows that the intensification of the workforce will likely increase the rate of work accidents due to increased workloads among both experienced and inexperienced workers (Nichols, 1989; Asfaw et al., 2011). Additionally, it has been found a greater reporting of accidents by workers and businesses during periods of economic growth (Gerdtham & Ruhm, 2006; Davies et al., 2009). It has been suggested that the relative abundance of job opportunities in growth periods gives workers incentives to report all minor work accidents (Ruhm, 2000; Boone & Van Ours, 2006; Boone et al., 2011; Li et al., 2011; Fernández-Muñíz et al., 2018).
Nichols (1989) extended the work by Kossoris (1938) and offers an alternative theoretical explanation for the connection between work accidents and economic activity. Within this strand, academics have employed behavioral and labor-market arguments to explain decreases in the rate of work accidents in periods of economic slowdown. The positive correlation between macroeconomic figures and work accident rates implies the decrease of the latter in periods of economic downturn. It has been argued that the fall in work accidents during recession periods is caused by the lower accident reporting by workers due to the fear of losing their job (Boone & Van Ours, 2006; Lafuente & Abad, 2021; Delgado-Sánchez 2023).
In addition, the characteristics of labor markets contribute to explain the lower work accident rates observed in recession periods. Businesses primarily reduce their workforce to mitigate the negative effects of reduced economic activity. But Sedano-de la Fuente et al. (2014) found that, in the Spanish case, firing permanent or more experienced employees is costly for businesses so; therefore, they mostly fire unexperienced workers who arguably have a greater probability to experience work accidents.
Building on the vulnerability approach by Nichols (1989) , prior work uses similar arguments to explain the increase of work accident rates in growth periods. In line with the arguments outlined in Kossoris (1938) intensification theory, research suggests that in periods of economic expansion businesses amplify their labor force which, in turn, produces a natural increase in the rate of work accidents because the relatively higher proportion of unexperienced workers are more likely to experience a minor accident (Fernández-Muñíz et al., 2018).
Finally, it is worth highlighting that different studies have evaluated the evolution of work accident rates in periods of growth and slowdown at the industry level. Overall, these studies have documented that some industries are more accident prone, being the characteristics of production processes, the most prominent argument underlying the higher work accident rate reported in primary sectors (agriculture and mining), construction, and manufacturing (Davies et al., 2009; Asfaw et al., 2011; Sedano-de la Fuente et al., 2014; Fernández-Muñiz et al., 2018).
3. Data and method
3.1 Data
The data used in this study come from multiples official sources. First, information on the total working population at industry level was obtained from the Statistical Yearboos of Peru's Ministry of Labor and Employment Promotion (MTPE). Second, data on macroeconomic figures-i.e., Gross Domestic product (GDP) and workers' wage-was obtained from the National Institute of Statistics and Information Technology (INEI, Peru). For analytical purposes, GDP figures are deflected by inflation and economic values are expressed in million of Peruvian soles at 2021 constant prices (URL: https://www.gob.pe/institucion/inei/informes-publicaciones/3655985-compendio-estadístico-peru-2022).
Third, the information on the number of occupational accidents for the period 2016-2021 was obtained from the records made available by the Ministry of Labor and Employment Promotion (MTPE), through the Computer System for Work Accidents, Incidents and Occupational Diseases (SAT) (URL: https://www2.trabajo.gob.pe/estadisticas/estadistica-de-accidentes-por-actividad-economica ).
The key variables used in this study to evaluate the relationship between economic cycle and work accidents in 15 Peruvian industries over the period 2016-2021 follow: economic activity measured as the level of GDP per worker, and the rate of work accidents defined as the number of accidents by 100,000 workers. Finally, the mean wage per worker is defined as the average monthly economic compensation of workers.1
Table 1 summarizes the analyzed data, whereas Figure 1 presents the evolution of both GDP per worker and work accident rates during the studied period.
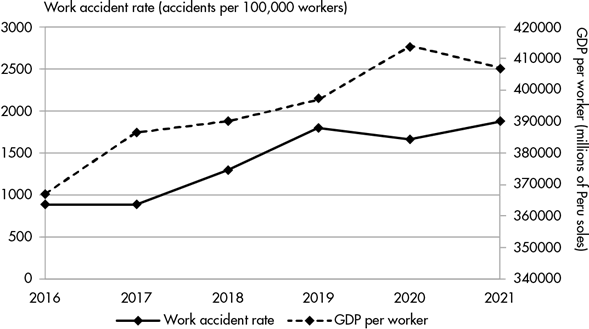
Figure 1: Evolution of work accident rates (accidents per 100,000 workers) and GDP per worker (at constant 2021 prices) in Peru between 2016 and 2021.
Table 1: Descriptive statistics (2016-2021)
| Work accident rate | GDP per worker | Mean wage per worker | ||
|---|---|---|---|---|
| Panel A: Full sample (N = 90) | ||||
| Average (std. dev.) | 1394.64 (3022.66) | 393450.40 (929233.00) | 1959.19 (792.61) | |
| Panel B: Industry statistics | ||||
| 1 | Agriculture, livestock, hunting, and forestry | 79.35 (13.21) | 73176.47 (9247.47) | 1079.81 (64.10) |
| 2 | Mining | 1564.29 (349.66) | 501198.60 (25101.74) | 3999.13 (228.36) |
| 3 | Fishing | 572.22 (181.96) | 73034.05 (10171.93) | 1987.78 (126.12) |
| 4 | Utilities (electricity, gas, water) | 510.48 (128.49) | 422057.60 (34028.76) | 3083.43 (216.25) |
| 5 | Construction | 1345.84 (363.86) | 126407.20 (11392.01) | 1843.85 (104.28) |
| 6 | Manufacturing | 1050.80 (287.56) | 106400.90 (4285.89) | 1693.52 (58.89) |
| 7 | Trade (wholesale and retail) | 418.99 (94.11) | 74474.25 (2720.63) | 1496.63 (50.14) |
| 8 | Transportation and warehousing | 850.96 (286.54) | 142471.40 (2356.10) | 1636.54 (81.46) |
| 9 | Real estate and rental and leasing | 590.17 (158.58) | 55501.03 (1245.37) | 1647.81 (38.91) |
| 10 | Financial intermediation | 27.26 (18.98) | 155385.50 (17845.23) | 2925.41 (81.16) |
| 11 | Educational services | 38.84 (16.14) | 85039.35 (10633.89) | 1741.11 (35.19) |
| 12 | Health care and social assistance | 1483.77 (172.62) | 149641.40 (2591.22) | 1509.24 (22.65 |
| 13 | Accommodation and food services | 411.23 (191.29) | 80193.21 (11180.11) | 1021.58 (61.61) |
| 14 | Other services (except government) | 606.07 (159.06) | 49465.30 (3961.17) | 1417.28 (34.57) |
| 15 | Public administration and defense | 11369.30 (5477.91) | 3807310 (296938.10) | 2304.67 (127.73) |
Note: Standard deviation is presented in parenthesis. The rate of work accidents is the number of accidents per 100,000 workers, whereas monetary values are expressed at 2021 constant prices (GDP per worker = million of Peruvian soles, mean wage per worker = Peruvian soles).
3.2 Method
To evaluate the relationship between the rate of work accidents and economic activity in Peru between 2016 and 2021 I employ a two-step methodology based on panel-data models (Wooldridge, 2002) and panel-data VAR model (Holtz-Eakin et al., 1988).
The analysis is conducted at industry level (i= 1,…, N=15), and in the first stage the model used to test the empirical connection between work accident rates and GDP per worker is based on a standard Cobb-Douglas production function:
 (1)
(1)
In equation (1), Y is the rate of work accidents for each industry (i) during the study period (t), A is the constant term, T is the set of variables capturing time-related effects (λ), and ε is the error term. For the variables GDP per worker (G) and mean wage per worker (W) the terms β and δ are, respectively, the model coefficients to be estimated. The variables GDP per worker and mean wage per worker are deflated with respect to inflation and are expressed at constant 2021 prices.
The resulting log-linearized Cobb-Douglas function used in this study follows:
 (2)
(2)
In equation (2)T is a set of (T-1) dummy variables that account for potential time effects linked to unobserved changes in environmental conditions that are common to all industries (i), while the error term has two components: a time-invariant effect controlling for industries' unobserved heterogeneity (η), and a normally distributed error (ε) that varies cross-industries and cross-time (t).
Equation (2) is estimated via fixed-effects models with robust standard errors to correct for autocorrelation of errors due to constant industry-specific effects (Wooldridge, 2002).
In the second stage, I complement the analysis by applying the following panel VAR model (Holtz-Eakin et al., 1988):
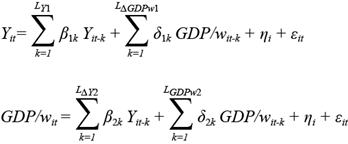 (3)
(3)
In equation (3)Y is the rate of work accidents, GDP/w is the GDP per worker, the terms β and δ are the model parameters, η i is the industry-specific fixed effects term, and ε it is the error term. Following Holtz-Eakin et al. (1988) , the panel-data VAR model assumes that, for the analyzed industries, coefficients (β and δ) are estimated by a homogeneous data generation process. Equation (3) is computed using the GMM estimator (Arellano & Bond, 1991).
With model estimations in hand (equation (3)), the Granger causality Wald test which evaluates whether one times series is valid to forecast another (null hypothesis: all parameters on the lag of the study variables are jointly zero in each equation), is used to corroborate the causal relationship between economic activity and work accident rates.
4. Results
4.1 Baseline results
This section presents the results of the fixed-effects model analyzing the relationship between the rate of work accidents, economic activity (GDP per worker) and workers' mean wage (equation (2)). In Table 2, model 1 includes GDP per worker while model 2 incorporates workers' compensation into the analysis.
Concerning the key variable analyzed in this study, the results for the coefficient linked to the (ln) GDP per worker indicate that economic activity is positively correlated with the rate of work accidents. The coefficients for the GDP per worker are stable and statistically significant, and they range between 1.1319 (model 1) and 1.5094 (model 2). From the result of the full model (specification 2) it can be seen that a 1% variation in the GDP per worker is associated with a change in the work accident rate of 1.51% (∆Y = ∆Y β ∴ ∆Y= 1.011.5094 = 1.51%).
This finding highlighting the pro-cyclical relationship between economic activity and the rate of work accidents has been widely documented in previous research (Boone & Van Ours, 2006; Asfaw et al., 2011; Boone et al., 2011; Cioni & Savioli, 2016; Fernández-Muñíz et al., 2018; Lafuente & Daza, 2020; Lafuente & Abad, 2021; Murrell-Blanco, 2023). Based on the notion that work accidents occur within work environments, this finding corroborates that work accidents are a negative, unintended consequence of economic activity.
The coefficient for the variable linked to workers' economic compensation is negative and significant. Among Peru's industries and during the 2016-2021 period, the result suggests that a 10% increase in workers' average wage is associated with a fall of 19.32% in the rate of work accidents. This finding indicates that industries reporting higher wages, which can be linked to higher levels of human capital among workers, will likely show lower work accident rates.
Table 2: Fixed-effects regression model: Summary results
| Dependent variable: ln work accident rate | Model 1 | Model 2 |
|---|---|---|
| ln GDP per worker (Eq. (2): β) | 1.1319 (0.6356)* | 1.5094 (0.6304)** |
| ln mean wage per worker (Eq. (2): δ) | -2.2527 (1.0291)** | |
| Time dummies | Yes | Yes |
| R2 (within) | 0.5264 | 0.5741 |
| R2 (overall) | 0.3076 | 0.3664 |
| F test | 24.32*** | 15.09*** |
| Observations (industries) | 90 (15) | 90 (15) |
Robust standard errors are in parentheses. *, **, *** = significant at 10%, 5% and 1%, respectively.
4.2 Complementary analysis: panel VAR results
This section presents the complementary analysis based on the panel VAR model. Table 3 shows the findings of the VAR model (equation (3)), whereas the results of the Granger causality test evaluating the connection between economic activity (GDP per worker) and work accident rates are shown in Table 4.
In constructing vector autoregression models, the lag length and the evaluation of the stability of parameters are relevant aspects that should be considered. Concerning the lag length notice that, given the exploratory nature of this study and the limited time-span of the available data series, all models were estimated using 1 lag of the key variables. To ensure the goodness of fit of the proposed approach the stability test was conducted. Here, the diagnostic statistics for the eigenvalue stability condition show that all eigenvalues are below unity, thus corroborating the validity and stability of the panel-data VAR model (range: 0.0402-0.5908).
Additionally, in order to evaluate the stationarity in the time series unit root tests were performed on the data. The results for panel unit root tests (Im-Pesaran-Shin test) (Im et al., 2003), presented in Table 3, indicate that the two analyzed data sets are stationary, which validates the use of the Granger causality test to study the potential causal relationships between the rate of work accidents and GDP per worker.
Table 3: Panel unit root tests: Summary results
| Variables | Im-Pesaran-Shin test (1 lag) |
| △ Work accident rate | -2.4001 (0.0000) |
| △ log GDP per capita | -12.6393 (0.000) |
All results are based on CADF regressions that include an intercept and a time trend. Values in parenthesis are the p-values of the unit root tests. For all variables the results indicate that the null hypothesis of non-stationarity (against the alternative of trend stationarity) is rejected at conventional significance levels.
From the results in Table 4 it can be observed that, despite the magnitude and significance of coefficients is weaker compared to the fixed-effects model (Table 2), the results of the panel VAR model in Table 4 are qualitatively similar to those computed via the fixed-effects regression: at the industry level, economic activity (GDP per worker) is a significant predictor of the rate of work accidents in Peru between 2016 and 2021.
In the case of the equation modeling the work accident rate, the coefficient for the variable GDP per worker indicates that a 1% growth in GDP per worker would increase the work accident rate by 1.422%. That is, changes in industries' economic activity are positively correlated with work accident rates in the short-run.
When the dependent variable is the GDP per worker, the results in Table 3 indicate that variations in the work accident rate do not affect GDP per worker in a significant way.
The results in Table 5 for the Granger causality Wald test after the panel VAR model support the findings presented in Tables 2 and 4 for Peruvian industries: there is causal relationship in the short-run from economic activity to the rate of work accidents.
Finally, Table A1 in the Appendix presents, for the 15 industries analyzed in this study, the results of the Granger causality Wald test evaluating the connection between economic activity and the rate of work accidents. The findings indicate that the general panel VAR model (Tables 4 and 5), which suggests a unidirectional causal relationship in the short-run between economic activity and work accident rates, is especially evident in six industries often considered accident-prone sectors because they are labor intensive or involve high-risk industrial processes: Agriculture, livestock, hunting, and forestry, fishing, utilities, construction, manufacturing, transport and warehousing.
On contrary, the analysis detected partial evidence that the rate of work accidents affects GDP per worker in the short-run in industries related to trade (wholesale and retail), business- and consumer-oriented services (i.e., real estate, financial intermediation, accommodation and food services, and other services), and public administration and defense.
Table 4: Panel VAR regression: Summary results
| Work accident rate | GDP per worker | |
| Work accident rate (lag 1) | 0.2653* (0.1516) | 0.0516 (0.0440) |
| GDP per worker (lag 1) | 1.4192* (0.7881) | 0.3657* (0.2182) |
Robust standard errors are in parentheses. *, **, *** indicate significance at 10%, 5% and 1%, respectively.
Table 5: Granger causality test after panel VAR model: Summary results
| Null hypothesis: | Chi2 statistic | p-value | Verdict |
|---|---|---|---|
| GDP per worker does not Granger-cause Work accident rate | 3.24* | 0.0720 | x→y |
| Work accident rate does not Granger-cause GDP per worker | 1.38 | 0.2410 | x↛y |
The table reports the results of the Granger non-causality test with one lag on the panel data series. The 'Verdict' column summarizes the results of the test: x→y indicates that the focal independent variable 'does Granger cause' the dependent variable, and x↛y indicates that the focal independent variable 'does not Granger cause' the dependent variable. *, **, *** indicate significance at the 10%, 5% and 1%, respectively.
5. Concluding remarks, implications and future research
5.1 Concluding remarks
This study offers novel evidence on the relationship between occupational accidents and economic activity in a developing country, namely Peru, between 2016 and 2021.
Work accidents are a negative consequence of economic activity, and the relevance of the proposed analysis not only relies on the value of generating new evidence on the relationship between work accidents and GDP per worker figures, but also on the fact that the proposed analysis focused on an unexplored developing setting offers some light of the effectiveness of the safety system-i.e., the institutional setting designed to improve work conditions-in Peru.
Overall, the results corroborate the positive effect of economic activity (GDP per worker) on the rate of work accidents reported in prior research (Davies et al., 2009; Asfaw et al., 2011; Fernández-Muñíz et al., 2018; Lafuente & Daza, 2020; Murrell-Blanco, 2023).
Additionally, it was found that the effect of GDP per worker and work accident rates is heterogeneous across Peru's industries, a pattern that I link to operational differences in terms of the processes of the analyzed industries. This result, which highlights the prevalence of the reported unidirectional causal relationship in certain industries, is in line with prior work emphasizing that the relationship between economic activity and work accidents might be more significant in labor intensive industries or in sectors involving high-risk operational processes (Davies et al., 2009; Andersen et al., 2018; Lafuente & Daza, 2020).
5.2 Implications
This paper has important implications for scholars and policy makers. First, from an academic viewpoint, this is the first study analyzing the connection between macroecoomic figures and work accident rates in Peru. Also, this research is related with prior studies emphasizing that the economic activity (in this work, GDP per worker) affects the temporal evolution of work accidents rates at territorial and industry level (Ruhm, 2000; Davies et al., 2009, Asfaw et al., 2011; Fernández-Muñíz et al., 2018; Lafuente & Daza, 2020; Lafuente & Abad, 2021; Murrell-Blanco, 2023). Also, the findings suggest that this relationship is heterogeneous across Peru's industries. In this case, the reported differences across industries might be associated with the marked discrepancies that characterize the production process of the analyzed industries.
From a policy perspective, the results of this study, together with the observed increase in the rate of work accidents during the analyzed period, allow to partially and indirectly analyze the role of the country's safety regulation system and the effectiveness of occupational health and safety plans across industries.
At the industry level, the findings imply that policy decisions affecting Peru's safety system should be connected to the specific characteristics of production processes. For example, policy makers should consider industries' operational heterogeneity when designing policies targeting the reduction of work accidents. Also, it is recommended that policy makers pay close attention to the role of safety inspectorate (Lafuente & Abad, 2021).
Between 2016 and 2021 the average rate of work accidents more than doubled, and this trend of work accidents might sign a failure in the management of safety and health at work. Arguably, scarce resources dedicated to monitor work safety (safety inspectors) in Peru's National Superintendence of Labor Inspection might partially explain the more than proportionate increase in work accidents, compared to the evolution of the economy. In this sense, the more in-depth analysis of the statistics available on work accidents and labor intensity across industries might constitute a valid tool to evaluate and monitor work safety across Peru's industries.
Finally, from the analysis it was detected an underreporting of accidents and occupational diseases caused by the strong informal (unregulated) sector in Peru (Mejía et al., 2015). In this case, it is necessary to strengthen the legal framework as well as the administrative mechanisms in order to improve both the quality of information systems and the full implementation of safety controls among Peru's businesses.
5.3 Limitations and lines of future research
As with any study, the results of this work open relevant line for future research. First, and similar to previous studies on the relationship between economic activity and occupational accidents and illnesses (Davies et al. 2009; Asfaw et al., 2011; Fernández-Muñiz et al., 2018), the data used in this study do not allow the direct analysis of the underlying processes causing work accidents across industries. From a policy perspective, future research can address this point by evaluating how the industries' specific operations impact the rate of occupational accidents.
Second, work-safety regulation and monitoring actions are heterogeneous across industries. In this sense, the reported estimations may well result from the specific characteristics of industrial processes. Future comparative studies should evaluate the effectiveness of different safety systems, distinguishing more accident-prone industries from industries whose operational processes are associated with a reduced number of work risks. Finally, in a related manner, future work on the relationship between economic activity and work accidents in developing settings should focus on this connection at business level.

