


 Inglés (pdf)
 Articulo en XML
 Referencias del artículo
 Enviar articulo por email
 Citado por SciELO
  Similares en
SciELO
Similares en
SciELO 
 Permalink
1. Introduction
Today we live in an information age driven by different technologies that materialize in the application of big data, algorithms, cloud computing, and social networks. This new environment- which primarily results from the information technology revolution-is creating a global digital platform economy built around multiple market players, including digital platforms, entrepreneurs, and individual users who simultaneously interact with governments interested in regulating the new digital markets (Goldfarb and Tucker, 2019; Acs et al., 2021).
The interconnections between economic agents-i.e., entrepreneurs and individual users, platforms and governments-in the digital economy bring important challenges to digital platforms- interested in capitalizing on their internal architecture by connecting users and businesses-and to policy makers who are now faced with the responsibility of designing digital infrastructures and regulations that increase the efficiency of digital markets.
These market and regulatory issues have been largely addressed in the US and European economies (see, e.g., Rochet and Tirole, 2006; Sussan and Acs, 2017; Goldfarb and Tucker, 2019; Song, 2019). Nevertheless, and despite in the last decade Latin American countries have shown important progress in terms of various digitization metrics (e.g., broadband infrastructure, Internet adoption and social media coverage) (Katz and Callorda, 2018), important questions related to the digital ecosystem remain unanswered. Specifically, what are the characteristics (and drivers) of the digital ecosystem in Latin America? Moreover, are there relevant differences in the configuration of the Latin American digital ecosystem when compared to that in other developed economies (i.e., USA and Canada)?
To address these questions empirically, the objective of this note is to evaluate the digital ecosystem in Latin America and in developed American economies (USA and Canada). The empirical application employs the ‘Benefit of the Doubt’ (BOD) weighting method (Cherchye et al., 2007) on a unique data set including information on the properties of the digital ecosystem-measured by the Digital Ecosystem Index (DEI) (Sussan and Acs, 2017)-in North America (USA and Canada) and 16 Latin American countries for the year 2019.
For their capacity to compile into a single metric complex constructs that cannot be fully captured with one variable, composite indicators-such as the one proposed in our note based on the BOD model-have gained increased popularity among scholars and policy makers (Cherchye et al., 2007). Composite indicators constitute valuable tools for policy makers interested in identifying benchmarks as well as setting policy priorities (OECD, 2008). Studies based on composite indicators computed via the BOD method have been used in different fields including, among others, economics (e.g., internal market index, global competitiveness index or county competitiveness), human development (e.g., human development index), quality of life (e.g., better life index), or business competitiveness (Despotis, 2005; Cherchye et al., 2008; Mizobuchi, 2014; Alonso-Ubieta and Leiva, 2019; Araya-Solano, 2019; Lafuente, Araya, Leiva, 2020).
Our model is in line with prior work emphasizing the layered structure that characterizes the relationships between ecosystem participants (Parker et al., 2017; Cennamo, 2019; Li et al., 2019): governments, digital platforms, new and incumbent firms, and individual users.
The main findings of the study reveal significant discrepancies in the efficiency level of the digital ecosystem in Latin America and North American economies. Also, it was found that the performance gap in digital ecosystem performance is in large part explained by differences in the configuration of the ecosystem between North America and developing Latin American countries.
The results of our study have important implications for scholars and policy observers interested in digital ecosystems. Economically meaningful policy to improve the digital ecosystem should be based on accurate analyses. From the perspective of the digital ecosystem, the proposed analysis contributes to understand the factors shaping the digital ecosystem in North America and Latin America. Also, our analysis provides nuanced guidance on how to support high-tech entrepreneurship by developing tailor-made policies that, at the same time, can contribute to strengthen the local digital ecosystem.
The plan of the paper follows. Section 2 presents the digital platform economy index, while Section 3 deals with the data and the description of the analytical method. Section 4 presents the results and Section 5 offers the concluding remarks, implications and future research lines.
2. Measuring the digital ecosystem: The digital platform economy index
In order to measure the magnitude of the digital platform economy (DPE), Acs et al. (2021) propose the Digital Platform Economy Index (DPE Index). The DPE integrates two inter-related literatures on ecosystems, namely, digital ecosystem and entrepreneurial ecosystem by situating at the core of the digital ecosystem framework different economic agents, including: users, entrepreneurs, digital platforms, and institutions. This way, the DPE works under the presumption that for technology to be successfully introduced both the digital ecosystem and the entrepreneurial ecosystem need to be developed simultaneously. The full description of the DPE computation method is presented in Appendix 1.
Concerning the measurement issues, the Digital Platform Economy Index (DPE) integrates 12 pillars grouped in four interconnected ecosystem constituents (Table 1): (1) Digital User Citizenship which includes users on the demand-side and the supply-side; (2) Digital Technology Entrepreneurship that incorporate app developers and various agents that contribute to entrepreneurial innovation and value creation on platforms; (3) Digital Multi-sided Platforms that coordinate social and economic activities between users and agents; and (4) Digital Technology Infrastructure including all regulations governing all the activities of the digital technology.
The sub-indicator dealing with Digital User Citizenship emphasizes the value of users’ privacy protection for a healthy and active digital ecosystem. This building block of the DPE addresses the explicit legitimization and implicit social norms that enable users to participate in the digital society in order to increase public trust and the sustainability of the digital ecosystem (Sussan and Acs, 2017, p. 64 ). Variables related to digital literacy, digital openness and digital rights are critical aspects of this sub-indicator (Table 1).
The second DPE sub-indicator, Digital Technology Entrepreneurship, brings forth entrepreneurial innovation and, subsequently, increases platforms’ efficiency. For a sustainable DPE, economic agents engaging in entrepreneurial innovation and knowledge exchange (e.g., add developers) contribute to narrow the gap between supply opportunity and demand need within platforms that increase platform efficiency (Song, 2019). In this case, decisive elements of a solid digital technology entrepreneurship environment include: digital adaptation, technology absorption and technology transfer (Table 1).
The Digital Multi-sided Platforms sub-indicator highlights the key role played by digital platforms as innovation bridges of the information technology revolution (e.g., Rochet and Tirole, 2006; Gawer 2009; Evans and Schmalensee, 2016). Saadatmand, Lindgren and Shultze (2019) describe “digital platforms as an emergent organizational form characterized by technology and social processes”. By governing the mutually dependent relationships between the economic agents that consolidate the platforms’ value proposition (e.g., app developers and users), digital platforms operate in multiple markets that are essential to most consumers in our contemporary economy. In order to take into account the various properties of platforms’ economic environment, this sub-indicator include a number of constructs, including: networking, matchmaking, and financial facilitation (Table 1).
Table 1: The Digital Platform Economy index (DPE)
| DIGITAL PLATFORM ECONOMY | Sub-indexes | Pillars | Variables (entrepreneurship / digital) |
|---|---|---|---|
| Digital Technology Infrastructure | Digital access | Digital access / Institutions | |
| Digital access / Digital technology | |||
| Digital freedom | Digital Freedom / Institutions | ||
| Digital Freedom / Digital technology | |||
| Digital protection | Digital protection / Institutions | ||
| Digital protection / Digital technology | |||
| Digital User Citizenship | Digital literacy | Digital literacy / Institutions | |
| Digital literacy / Users | |||
| Digital openness | Digital openness / Institutions | ||
| Digital openness / Digital technology | |||
| Digital rights | Digital rights / Institutions | ||
| Digital rights / Digital technology | |||
| Digital Multi- sided Platform | Networking | Networking / Agents | |
| Networking / Users | |||
| Matchmaking | Matchmaking / Agents | ||
| Matchmaking / Users | |||
| Financial facilitation | Financial facilitation / Agents | ||
| Financial facilitation / Users | |||
| Digital Technology Entrepreneurship | Digital adaptation | Digital adoption / Agents | |
| Digital adoption / Digital technology | |||
| Technology absorption | Technology absorption / Agents | ||
| Technology absorption / Digital technology | |||
| Technology transfer | Technology transfer / Agents | ||
| Technology transfer / Digital technology |
Source:Acs et al. (2021)
Finally, the Digital Technology Infrastructure sub-indicator captures the mechanisms that facilitate the functioning of the platform economy. Digital infrastructures represent the technologies of the digital age jointly with the regulations that govern their effective implementation. Appropriate technological infrastructures are essential prerequisites for the efficient operation of the digital platform ecosystem that is also responsible for ensuring an open and secure digital economy. Digital access, digital freedom, and digital protection are the components included in this sub-indicator.
3. Design and methods
3.1 Sample and the digital ecosystem pillars
The data used in this study to assess the digital ecosystem (DPE) in the American continent come from the Digital Platform Economy Index databases made available by the Global Entrepreneurship and Development Institute (www.thegedi.org) (Acs et al., 2021).
The DPE scores-and DPE constituents-were computed for a sample of 18 countries for the year 2019, including both North America and Latin America and the Caribbean islands: Argentina, Brazil, Canada, Chile, Colombia, Costa Rica, Dominican Republic, Ecuador, El Salvador, Guatemala, Honduras, Jamaica, Mexico, Panama, Paraguay, Peru, United States, and Uruguay.
Table 2: BOD model (equation (1)): Descriptive statistics for the output set (DPE sub-indicators)
| USA | Canada | Latin America | Total | |
| Panel A: Output set (DPE sub-indicators) | ||||
| Digital technology infrastructure | 80.73 | 75.37 | 25.21 (8.65) | 31.08 (18.94) |
| Digital user citizenship | 79.00 | 81.34 | 26.52 (10.22) | 32.48 (19.83) |
| Digital multisided platforms | 87.41 | 78.83 | 23.90 (8.33) | 30.48 (20.74) |
| Digital technology entrepreneurship | 92.22 | 77.13 | 24.43 (7.42) | 31.13 (20.85) |
| Panel B: DPE pillars | ||||
| Digital openness | 70.44 | 74.49 | 23.28 (16.25) | 28.75 (22.06) |
| Digital freedom | 91.00 | 68.46 | 32.50 (9.07) | 37.74 (17.91) |
| Digital protection | 91.57 | 84.57 | 24.02 (9.79) | 31.13 (22.69) |
| Digital literacy | 100.00 | 82.07 | 25.04 (7.55) | 32.37 (22.70) |
| Digital access | 92.33 | 85.38 | 19.08 (13.78) | 26.83 (26.04) |
| Digital rights | 57.79 | 79.39 | 41.21 (19.20) | 44.25 (20.43) |
| Digital networking | 89.08 | 79.07 | 30.13 (9.51) | 36.13 (19.67) |
| Digital matchmaking | 100.00 | 76.69 | 24.99 (10.50) | 32.03 (23.09) |
| Financial facilitation | 90.04 | 82.57 | 19.27 (8.13) | 26.71 (23.02) |
| Digital adoption | 100.00 | 79.34 | 25.65 (8.38) | 32.76 (22.43) |
| Technology absorption | 100.00 | 73.66 | 27.58 (9.29) | 34.16 (21.53) |
| Technology transfer | 100.00 | 79.71 | 22.75 (8.62) | 30.20 (23.42) |
| Digital openness | 70.44 | 74.49 | 23.28 (16.25) | 28.75 (22.06) |
Standard deviation is presented in parentheses. The Latin America group includes 16 countries: Argentina, Brazil, Chile, Colombia, Costa Rica, Dominican Republic, Ecuador, El Salvador, Guatemala, Honduras, Jamaica, Mexico, Panama, Paraguay, Peru, and Uruguay. Source: The Global Entrepreneurship and Development Institute (www.thegedi.org).
Concerning the output set, as we indicated in Section 2 the DPE index includes four sub-indicators that represent different constituents of the digital ecosystem: digital infrastructure governance, digital user citizenship, digital multisided platforms, and digital technology entrepreneurship. Summary statistics for the four DPE sub-indicators as well as the 12 DPE pillars are presented in Table 2. For illustrative purposes, the full data set used in this study is presented in the Appendix 2. Also, Appendix 3 includes the data for the 12 pillars included in the DPE index.
At this point, an important consideration is in order. For the purposes of this study, notice that the 12 DPE pillars were grouped into the four DPE sub-indicators (outputs) which are introduced in equation (1) to obtain the digital ecosystem performance measure (DPEBOD) (y=y1,…,yk ɅK=4): y1: digital infrastructure governance, y2: digital user citizenship, y3: digital multisided platforms, and y4: digital technology entrepreneurship. Because the sample is relatively small (i.e., 18 observations), an efficiency model with 12 outputs would produce biased results that would become evident in a large number of artificially efficient countries (Cook et al., 2014). Thus, the proposed BOD model with four outputs seeks to reduce the potential loss of discriminatory power of BOD models with large numbers of inputs and/or outputs, relative to the number of units.1
3.2 Method: Benefit of the Doubt (BOD) weighting
We propose that the digital ecosystem is the result of the mutual interactions between various economic agents (i.e., users, businesses, digital platforms, and public administrations) functioning in local settings with different institutional and environmental conditions. By taking this relevant property of this ecosystem into account, our analysis seeks to evaluate the digital ecosystem around the globe as well as its strengths and weaknesses with the objective to identify potentially optimal ecosystem-enhancing policies.
To construct the composite indicator, we employ the benefit-of-the-doubt (BOD) model (e.g., Cherchye et al., 2007). Rooted in non-parametric data envelopment analysis (DEA) techniques (for a survey on DEA see, e.g., Cooper et al. (2011) ), the BOD weighting is among the methods suggested by the OECD (2008) for computing objective, non-arbitrary composite indicators (CIs). The BOD model, originally proposed by Melyn and Moesen (1991) and further developed by, among others, Cherchye et al. (2007), Sahoo et al. (2017) and Karagiannis and Karagiannis (2018) , is a special case of the input-oriented DEA model (Charnes et al., 1978) with a single constant input (vector of 1s) (Lovell and Pastor, 1999; Karagiannis and Lovell, 2016).
Formally, for the 18 countries (i = 1,…,N = 18), the BOD weighting model used in this study considers the 4 DPE sub-indicators (y= y 1,…,y k ɅK=4) and employs a set of endogenous weights (w) to compute the weighted average of the seven indicators (y) that maximize the DPE score. The following linear program solves the BOD weighting problem and computes the optimal DPE value for each county (i):
 (1)
(1)
sujeta to:
Equation (1) computes for each country a vector of endogenous weights for the 4 DPE sub-indicators (w k = w 1 ,…,w 4 ) that maximizes the value of the DPE. The optimal DPE performance value is bounded (DPE BOD ≤1). For efficient countries on the frontier DPE BOD =1, while for inefficient territories DPE BOD <1 and 1-DPE BOD is the degree of inefficiency (i.e., the output expansion required to reach the frontier). Two properties of the BOD model (equation (1)) are worth highlighting. First, weights are constrained to be non-negative, which makes the composite indicator a non-decreasing function of the output set. However, the non-negativity constraint on the weights allows for extreme scenarios that might render DPE estimations inaccurate (e.g., high number of artificially efficient countries). Thus, additional restrictions on the weights are needed in order to account for the relative importance of all DEEBOD sub-indicators. In this study, we added to equation (1) a ‘pie share’ restriction (Cherchye et al., 2007): L k <Σ K k w ik y ik <U k . This proportional restriction is attractive because pie shares (w ik y ik ) do not depend on measurement units and they directly show the individual contribution of each pie share to the DEEBOD, while allowing for weight heterogeneity within and between countries. In equation (1), Lk and Uk are the lower and upper bound for each pie share, respectively. The endogenous weights are country-specific and the sum of the re-scaled pie shares equals the DEEBOD score (equation (1)).
The second property deals with the relative importance-i.e., weights and limits (L k and U k )-of the DPEBOD sub-indicators. Instead of employing homogeneous ex-post weights resulting from the optimization model in equation (1), the DPEBOD weights were generated via the data driven method described in equation (1) in which the DPEBOD score is maximized based on the configuration of the efficient benchmark countries as well as on the position of the focal country in the technology hyperplane shaped by the output set (i.e., the 4 DPE sub-indicators).
4. Results
4.1 Analysis of the digital ecosystem worldwide
This section presents the results of the evaluation of the digital ecosystem based on the measures computed via equation (1). We first analyze the results of the efficiency analysis of the digital ecosystem (DPE BOD model: equation (1)). The second part of the section deals with the analysis of the configuration of the digital ecosystem among the sampled countries.
Overall, from Table 3 we observe that the relative efficiency of the digital ecosystem is 36.43% (average DPE BOD =0.3643). This finding indicates that American economies have a large room for improving their digital ecosystem. Specifically, countries in the continent can enhance the quality of their digital ecosystem 63.57% by investing-in terms of physical resources and reforms-in the different constituents of the ecosystem. Obviously, significant variations in the quality of the ecosystem are detected among the sampled countries.
The United States is the only country reporting an efficient digital ecosystem, in terms of the BOD estimations (DPE BOD =1). According to our BOD model (equation (1)), Canada ranks second in our digital ecosystem composite indicator (DPE BOD =0.9202).
The group of Latin American countries lags behind the USA and Canada. Also, for this group we observe that only four countries report an above-average DPE BOD score, namely: Chile (DPE BOD =0.4514), Uruguay (DPE BOD =0.4028), Costa Rica (DPE BOD =0.4014), and Brazil (DPE BOD =0.3661). On the other hand, Honduras (DPE BOD =0.1595) and Guatemala (DPE BOD =0.1686) are the countries with the poorest digital ecosystem level (DPE BOD ).
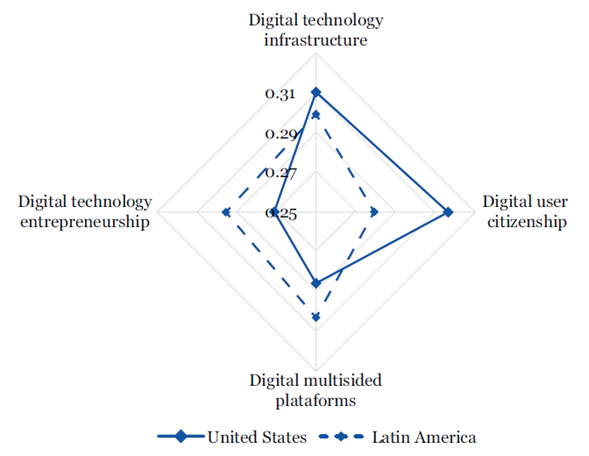
To analyze the configuration of the digital ecosystem among the sampled countries, we employ the weights computed via equation (1) (Table 3) to aid in the identification of the strategic patterns that characterize the digital ecosystem. The descriptive results are summarized in Table 4. Additionally, Figure 1 shows the configuration of the digital ecosystem for the benchmark (efficient) peer-i.e., the United States-and for the group of Latin American countries.
Table 3: BOD model: DPEBOD results (scores and ‘pie shares’) and ranking
| Country | Ranking | DPEBOD (eq. (1)) | Output weights (w) | |||
|---|---|---|---|---|---|---|
| y1: Digital technology infrastructure | y2: Digital user citizenship | y3: Digital multisided platforms | y4: Digital technology entrepreneurship | |||
| United States | 1 | 1.0000 | 0.3100 | 0.3160 | 0.2860 | 0.2710 |
| Canada | 2 | 0.9202 | 0.3050 | 0.2830 | 0.2920 | 0.2980 |
| Chile | 3 | 0.4514 | 0.3070 | 0.2920 | 0.2730 | 0.3060 |
| Uruguay | 4 | 0.4028 | 0.3370 | 0.1940 | 0.3110 | 0.3280 |
| Costa Rica | 5 | 0.4014 | 0.3270 | 0.2790 | 0.2840 | 0.2860 |
| Brazil | 6 | 0.3661 | 0.3100 | 0.3280 | 0.2520 | 0.2940 |
| Argentina | 7 | 0.3543 | 0.2780 | 0.2670 | 0.3110 | 0.3160 |
| Mexico | 8 | 0.3426 | 0.2720 | 0.2720 | 0.3250 | 0.3050 |
| Colombia | 9 | 0.3276 | 0.2600 | 0.2980 | 0.3150 | 0.3030 |
| Panama | 10 | 0.3260 | 0.2760 | 0.2880 | 0.3440 | 0.2700 |
| Peru | 11 | 0.2760 | 0.2840 | 0.2820 | 0.3390 | 0.2730 |
| Ecuador | 12 | 0.2473 | 0.2780 | 0.2540 | 0.3310 | 0.3090 |
| Jamaica | 13 | 0.2298 | 0.3150 | 0.2770 | 0.2560 | 0.3280 |
| Dominican Republic | 14 | 0.2082 | 0.1680 | 0.3560 | 0.3230 | 0.3260 |
| El Salvador | 15 | 0.1937 | 0.3130 | 0.3010 | 0.2780 | 0.2890 |
| Paraguay | 16 | 0.1817 | 0.3020 | 0.2570 | 0.3410 | 0.2760 |
| Guatemala | 17 | 0.1686 | 0.3950 | 0.2560 | 0.2810 | 0.2530 |
| Honduras | 18 | 0.1595 | 0.3680 | 0.2660 | 0.2870 | 0.2630 |
| Total | 0.3643 | 0.2979 | 0.2814 | 0.3040 | 0.2941 |
The United States, the efficient country, has a balanced digital ecosystem (Table 4 and Figure 1). The results of the BOD model (DPEBOD in equation (1)) indicate that the digital ecosystem in this country is primarily driven by the sub-indicator related to ‘user citizenship’ (0.3160) and ‘technology infrastructure’ (0.3100). On contrary, ‘technology entrepreneurship’ (0.2710) and ‘multi-sided platforms’ (0.2860) are relatively less important factors shaping the country’s ecosystem.
Although the descriptive result in Figure 1 suggests a balanced ecosystem, we observe two distinctive patterns in the configuration of the digital ecosystem of the group of Latin American countries. On the one hand, for the group of countries with an above-average DPEBOD score-i.e., Chile, Uruguay, Costa Rica-the ‘technology infrastructure’ sub-indicator is the most relevant aspect of their digital ecosystem whereas ‘user citizenship’, the top priority DPE indicator in the USA, is the weakest aspect of the ecosystem in these countries (Table 4). Because public trust is a critical prerequisite to user participation in the digital economy, this group Latin American countries should emphasize improvements in ‘user citizenship’ if the promotion of quality improvements in the digital ecosystem is the desired goal. For example, the development and sustainability of the digital ecosystem requires clear rules in terms of protection of personal data and enhanced privacy terms in digital platforms. Both aspects-which are included in the ‘user citizenship’ pillar-should be targeted by policy makers from these countries if the promotion of quality improvements in the digital ecosystem is the desired goal.
Table 4: Configuration of the digital ecosystem: Summary results
| Group | Digital ecosystem: Top policy priority | Digital ecosystem: Weakest sub-indicator |
| Panel A: Benchmark country (United States) | User citizenship | Technology entrepreneurship |
| Panel B: Inefficient countries | ||
| Canada | Technology infrastructure | User citizenship |
| Chile | Technology infrastructure | Multi-sided platforms |
| Uruguay | Technology infrastructure | User citizenship |
| Costa Rica | Technology infrastructure | User citizenship |
| Brazil | User citizenship | Multi-sided platforms |
| Argentina | Technology entrepreneurship | User citizenship |
| Mexico | Multi-sided platforms | User citizenship / |
| Technology infrastructure | Multi-sided platforms | Technology infrastructure |
| Colombia | Multi-sided platforms | Technology infrastructure |
| Panama | Multi-sided platforms | Technology entrepreneurship |
| Peru | Multi-sided platforms | Technology entrepreneurship |
| Ecuador | Multi-sided platforms | User citizenship |
| Jamaica | Technology entrepreneurship | Multi-sided platforms |
| Dominican Republic | User citizenship | Technology infrastructure |
| El Salvador | Technology infrastructure | Multi-sided platforms |
| Paraguay | Multi-sided platforms | User citizenship |
| Guatemala | Technology infrastructure | Technology entrepreneurship |
| Honduras | Technology infrastructure | Technology entrepreneurship |
On the other hand, the DPE sub-indicator related to ‘multi-sided platforms’ is the most important factor of the digital ecosystem among the majority of countries with a below-average DPEBOD score, namely: Ecuador, Colombia, Mexico, Panama, Paraguay, and Peru (Table 4). Despite the reported similarity in the policy priority in these countries, we observe marked differences in what concerns their least relevant DPE factor.
4.2 The connection between the digital ecosystem and countries’ economic performance
The supplementary analysis presented in this section explores the relationship between economic performance and the quality of the digital ecosystem among the sampled countries. Specifically, we assess if the quality of the digital ecosystem, measured via the BOD efficiency scores (equation (1)), correlates with countries’ economic results, measured as the GDP per capita. Notice that the GDP data was obtained from the World Bank databases and is expressed at 2011 prices in PPP international dollars. Summary descriptives for the two variables are presented in Table 5, while Figure 2 offers a visual representation of the connection between the DPEBOD score (equation (1)) and GDP per capita.
A first descriptive result indicates that there is a close connection between economic development and the digital ecosystem: Pearson correlation coefficient = 0.8732 (p-value < 0.000). The findings presented in Figure 2 further verify the reported strong correlation between the digital ecosystem and economic development. Notice that this result does not imply a causal relationship. We simply refer to the strong connection between economic development and the digital ecosystem among the sampled American economies.
Table 5: Summary statistics: The connection between the digital ecosystem and GDP per capita
| Country | DPEBOD (equation (1)) | GDP per capita (PPP in international dollars) | ||
| Mean | Ranking | Mean | Ranking | |
| United States | 1.0000 | 1 | 62,794.60 | 1 |
| Canada | 0.9202 | 2 | 48,130.30 | 2 |
| Chile | 0.4514 | 3 | 25,222.50 | 4 |
| Uruguay | 0.4028 | 4 | 23,572.20 | 5 |
| Costa Rica | 0.4014 | 5 | 18,671.10 | 8 |
| Brazil | 0.3661 | 6 | 16,096.40 | 10 |
| Argentina | 0.3543 | 7 | 20,610.60 | 6 |
| Mexico | 0.3426 | 8 | 19,844.60 | 7 |
| Colombia | 0.3276 | 9 | 15,012.90 | 11 |
| Panama | 0.3260 | 10 | 25,553.70 | 3 |
| Peru | 0.2760 | 11 | 14,418.10 | 12 |
| Ecuador | 0.2473 | 12 | 11,734.40 | 14 |
| Jamaica | 0.2298 | 13 | 9,326.66 | 15 |
| Dominican Republic | 0.2082 | 14 | 17,748.20 | 9 |
| El Salvador | 0.1937 | 15 | 8,331.80 | 17 |
| Paraguay | 0.1817 | 16 | 13,599.90 | 13 |
| Guatemala | 0.1686 | 17 | 8,462.37 | 16 |
| Honduras | 0.1595 | 18 | 5,138.75 | 18 |
| Overall | 0.3643 (0.2343) | 20,237.17 (14,316.55) |
Standard deviation is presented in parentheses.
Second, by observing the specific position of any given country below or above the computed trend line in Figure 2 we can offer a second descriptive analysis that is appropriate for comparison purposes. For example, the United States is the only efficient country in the American continent (DPEBOD = 1.00), while Canada reports the second highest value for the digital ecosystem score (DPEBOD = 0.92). But, both countries have a different position in the scatter plot presented in Figure 2. In the case of the USA, the descriptive result indicates a balanced configuration between economic development and the quality of the digital ecosystem. For Canada, the descriptive finding in Table 5 suggests that the country’s digital ecosystem is potentially above the mean level expected for developed economies with a similar economic development level.
Finally, for the two countries with the poorer results (Honduras and Guatemala) the result in Figure 2 indicates that the quality of the digital ecosystem is in accordance with the economic development level of these countries.
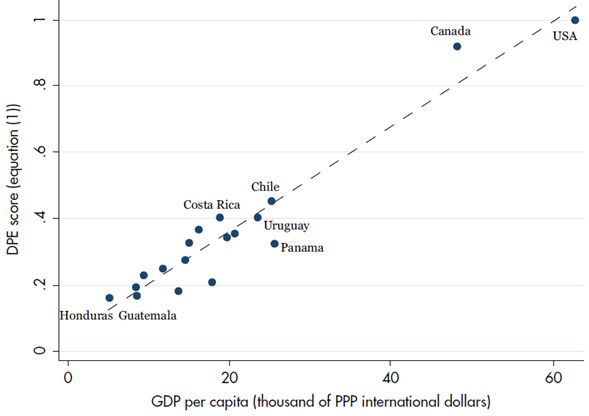
The objective of this supplementary analysis was to show that there is a connection between economic development and the quality of the digital ecosystem, measured via the efficiency score proposed in this study (DPEBOD in equation(1)). The core finding of this descriptive exercise corroborates this intuition: the quality and configuration of the digital ecosystem can be seen as a consequence of specific policies that match the countries’ economic development level.
5. Concluding remarks
In this study we use the data provided by the digital platform economy (DPE) index to build a non-parametric composite indicator that allows to evaluate the digital ecosystem in North and Latin America. Composite indicators have been invoked as a valuable tool, out of many available in the economists’ toolkit, for analyzing complex economic phenomena, such as digital ecosystem. Despite the utter simplicity of our analysis, we are convinced that our empirical study constitutes a useful exercise.
The Latin America region is formed by highly heterogeneous countries whose domestic markets (also dissimilar in terms of size and labor conditions) need to be served. Therefore, we argue that policy analyses should go beyond canonical rankings and homogeneous recipes, and promote the exploitation of valuable information that equips policy makers with the means for implementing tailor-made policy. In this sense, accurate analyses are relevant prerequisites of effective policy design. By acknowledging the relevance of computing endogenous (country-specific) policy priorities for optimal policy, our analytical approach based on the ‘benefit of the doubt’ (BOD) weighting method can offer insightful information to policy makers interested in enhancing the local digital ecosystem. This is especially important for Latin America where most economies have deployed considerable resources and have undertaken important reforms seeking to improve the governance and functioning of their digital ecosystem (Katz and Callorda, 2018).
Overall, our results are consistent with the view that an analysis based on the BOD approach provides relevant information to identify policy priority of the digital ecosystem.
The key findings of our note reveal that in North American countries (USA and Canada) the digital ecosystem is primarily driven by aspects related to ‘technology infrastructure’ (e.g., digital access and digital protection) and ‘digital user citizenship’ (e.g., digital openness and digital rights). On contrary, we found that the most important aspects of the digital ecosystem in Latin America are related to ‘digital technology entrepreneurship’ (e.g., digital adaptation and technology absorption) and ‘digital platforms’ (e.g., networking and financial facilitation). This strategic pattern is especially evident for Latin American countries with a relatively healthy digital ecosystem: Argentina, Brazil, Chile, Costa Rica, and Uruguay.
Instead of basic rankings and homogeneous prescriptions, our analysis shows that the key policy priorities of the digital ecosystem identified by our model can eventually be targeted by policy makers if directed investments seeking to boost the digital ecosystem is the desired objective. Future work should evaluate the potential impact of a directed policy focused on the priorities identified by our model viz.-à-viz. alternative policies offered by other analytical methods.
As with any study, the findings presented in this study are open to future verification. In this sense, it would be valuable to extend the analysis in various directions. First, future work should evaluate whether a solid digital ecosystem is correlated with innovation developments at different levels (business and public administrations), and what is the role of the various constituents of the digital ecosystem in these innovation processes. Second, the proposed analysis would gain richness if future studies analyze the relationship between the digital ecosystem and alternative macroeconomic figures that, besides the GDP per capita, include other equally relevant elements of the economy (e.g., industry productivity, or changes in the digitalization of public procedures in the post Covid-19 pandemic period). Supported by our descriptive results, the scrutiny of the digital ecosystem is a relevant aspect that should enter the agenda of scholars and policy-makers; and future work should test the value of the proposed BOD model by evaluating the effectiveness of specific policies designed to target weak spots in the ecosystem identified by our model.

