


 Inglés (pdf)
 Articulo en XML
 Referencias del artículo
 Enviar articulo por email
 Citado por SciELO
  Similares en
SciELO
Similares en
SciELO 
 Permalink
INTRODUCTION
This study employs non-parametric models rooted in linear programming methods-i.e., Data Envelopment Analysis (DEA)-to analyze the efficiency level of construction businesses operating in the Spanish region of Catalonia during the period 2005-2016.
At the global scale the construction sector was, along with banking, the most affected industry as a result of global economic crisis that started in 2008 (Kapelko et al., 2014; Lafuente et al., 2017). With the severe economic slowdown the deterioration of the efficiency levels of construction companies was accompanied by a drastic fall in these firms’ economic performance (Lafuente et al., 2017).
In the specific context of this study, the construction industry has an important weight in the Catalan and Spanish economy, representing 7.85% of Spain’s GDP in 2012 (16.74% in 2006) and 6.15% of total employment in 2012 (13.16% in 2006) (Lafuente et al., 2017). In addition to its size-in terms of contribution to the GDP-this industry plays a central role for territorial performance through the development of projects that allow urban and rural growth (Crosthwaite, 2000).
The growing awareness on the relevance for developing actions plans aimed at promoting a controlled revitalization of the construction industry has led different European administrations to adopt specific policies within the EU 2020 strategic plan with the objective to stimulate the development and consolidation of the construction industry based on sustainable practices (European Commission, 2016).
Furthermore, prior work evaluating the Spanish construction industry during the crisis period have mostly adopted a productive approach in which resource allocation and operational efficiency are key elements of the analysis (e.g., Fernández-López & Coto-Millán, 2015; Kapelko et al., 2014). Underlying these studies is the premise that the heterogeneous distribution of resources and capabilities among competing firms is a relevant factor that contributes to explain the ability of businesses to access key resources as well as the observed differences in business performance.
These arguments constitute the motivation to carry out this study focused on the analysis of the efficiency level of construction businesses operating in Catalonia between 2005 and 2016. Additionally, in this study I argue that firm size is a relevant characteristic that might explain why some firms are more efficient than others.
To achieve the objective set in this study, the empirical application considers a dataset that includes information for more than 1000 construction businesses operating in Catalonia during 2005-2016. In methodological term, I employ non-parametric techniques rooted in economic production theory-namely, Data Envelopment Analysis (DEA)-to compute the efficiency level of the analyzed construction businesses. The Catalan setting is attractive because it offers the opportunity to scrutinize how construction businesses responded, from an operational perspective, to the drastic economic changes that followed the burst of the housing bubble in 2008.
The key results of the empirical analysis reveal that the efficiency level of Catalan construction businesses drastically fell after 2008, and that the efficiency improvements reported in the industry after 2013 are heterogeneous and conditioned by business size.
The remainder of the study is organized as follows. Section 2 presents the theoretical framework. Section 3 offers a brief description of the construction industry in Catalonia and Spain. Section 4 describes the data and the method, while Section 5 presents the empirical results. Finally, Section 6 provides the concluding remarks, implications and limitations of the study.
LITERATURE REVIEW: EFFICIENCY ASSESSMENT OF CONSTRUCTION BUSINESSES
Literature dealing with the performance analysis of construction businesses has significantly grown with the down of the 21st century and, especially, after the financial crisis of 2008. Studies in this tradition have primarily adopted two approaches to evaluate performance among construction.
First, different studies have sought to analyze the factors that explain performance differences among competing firms (see, e.g., Bassioni et al., 2004; Crosthwaite, 2000; Rankin et al., 2008). These studies mostly employ financial ratios-e.g., financial or economic profitability and growth-to assess construction firms’ performance. Results suggest that performance in the industry is highly influenced by strategic choices and the mode of competition (e.g., cost, quality, or innovation capacities) (Kale & Arditi, 2002; Nudurupati et al., 2007).
Additionally, recent work by Lafuente et al. (2017) shows the relevance of the access to suppliers’ trade credit as well as of bank diversification (number of banks used by construction businesses) for explaining economic performance (return on assets) of construction businesses.
Despite the analytical robustness and informative validity of their results, these studies are often based on post-sales indicators that are unconnected to business operations, thus limiting the capacity of performance indicators to underpin decision-making processes and generate learning conducive to strategic (operational) change at business level (Beatham et al., 2004; Deng & Smyth, 2014; El-Mashaleh et al., 2007).
A second research stream specifically focuses on the productive efficiency of construction businesses (see, e.g., Deng & Smyth, 2014; Horta et al., 2012; Kapelko et al., 2014). Underlying this stock of empirical work is the presumption that performance is a multidimensional construct and that organizational performance, in terms of efficiency, results from the efficient amalgamation of internal resources (see, e.g., Newbert, 2007; Wernerfelt, 1984).
Rooted in non-parametric frontier models (i.e., Data Envelopment Analysis (DEA)), studies dealing with the efficiency analysis of construction businesses can be grouped in two categories, according to their purpose of their analytical approach: models that employ performance ratios to evaluate efficiency, and models where the input-output set is directly connected to business operations.
Concerning the first group of studies that use financial and operational ratios as outputs, Horta et al. (2012) propose a DEA model with a single constant input and four outputs (profitability, value added, equity-to-assets, and liquidity) to analyze the efficiency of construction firms in Portugal between 1996 and 2009. The results reported by the authors suggest that efficiency of Portugal’s construction businesses is more connected to innovation practices. The authors also find that efficiency is highly influenced by the local economic context where businesses operate. These findings are similar to those reported by Ruddock & Ruddock (2011) who analyze the construction industry in the UK using a neoclassical function for productivity growth (inputs: labor, capital, materials, and output: gross sales), and find that productivity growth in UK’s construction industry is more connected to the increased use of information and communication technologies (ICTs) and to the exploitation of more skilled labor.
In their analysis of the UK’s construction industry based on a model in which the outputs are profitability, labor productivity, and growth, Deng & Smyth (2014) find that profitability measures are more informative and important when it comes to explain efficiency differences among construction businesses in the UK, compared to the findings obtained when employment and growth outputs were used as outputs.
In the case of the second group of studies (i.e., DEA models using operational variables in the input-output set), You & Zi (2007) analyze the efficiency of Korean listed construction businesses between 1996 and 2000 (inputs: labor, fixed assets and material cost, output: sales). The results suggest that efficiency decreased during the analyzed period, thus indicating the influence of the economic cycle on efficiency (Korean crisis between 1998 and 2000).
By using a DEA model where total assets and labor are the inputs and economic value added in the output, Xue et al. (2008) study construction businesses from different Chinese regions. The authors report a continuous productivity improvement among the sampled construction firms between 1997 and 2003, with the exception of year 2002. This result is consistent with the reported growth of China’s economy.
In the Australian context, Li & Liu (2010) analyze the operating efficiency of construction businesses using a Malmquist productivity index rooted in a DEA model that assumes that capital and labor (inputs) produce economic value added (output). Results point to rapid productivity improvements during the analyzed period. Also, the authors find that the scale and scope of construction activities condition productivity across time.
Horta et al. (2013) evaluate the operating efficiency of 118 construction businesses located in Europe, Asia and North America between 1995 and 2003. The results of the proposed DEA model (inputs: total liabilities, shareholders’ capital, cost of goods sold; output: sales) indicate that North American businesses (US and Canada) are more efficiency than their European and Asian counterparts. Additionally, it was found that efficiency improvements are more pronounced among European and Asian businesses, a result that suggests a convergence effect among the sampled firms, in terms of efficiency.
Finally, Kapelko et al. (2014) for Spain and Kapelko et al. (2015) for Spain and Portugal analyze the evolution of productivity measures by using index numbers (inputs: fixed assets, employment cost (wages), material costs, output: sales). The key findings of these studies highlight the severe productivity decline as a result of the financial crisis of 2008. Also, the results suggest that resource underutilization-in particular, assets and labor-are potent factors explaining the temporal evolution of the productivity level among Spanish and Portuguese construction businesses.
THE SPANISH CONSTRUCTION INDUSTRY
During the decade preceding the economic crisis of 2008 (1997-2007) the Spanish construction industry grew strongly mostly due to three factors. First, the economic growth reported during this period promoted the development of investments in public infrastructures that promoted the construction industry. Second, and in connection to the first point, the employment growth resulting from the increased economic activity pushed up housing demand. Third, the remarkable increase in the construction of housing projects facilitated the growth of the financial sector as a result of the growth in credit to businesses and households and in mortgage assets from the banks’ perspective.
As a result, the construction industry grew significantly and the sector reached 16% of Spain’s gross domestic product in 2006, a figure that doubles what was reported in the rest of the EU (Kapelko et al., 2014). Until 2007, the construction industry was a major driving force of Spain’s economic growth, employing 13.16% of employment (INE, 2019 www.ine.es ). During this period a real estate bubble was created due to a combination of all the factors mentioned above.
Although the construction industry in Catalonia and in Spain had a significant weight in the economy relative to the main European economies (both in terms of GDP and employment), during this growth period a housing bubble was created because of a combination of factors, including: the growing housing supply in the short-term, the high market expectations of construction businesses, as well as the matching between competitive interest rates with increased leverage allowances on construction activity and home purchase by financial institutions (Horta et al., 2013; Lafuente et al., 2017).
The combination of these factors led to create similar real estate bubbles-e.g., in many EU countries, China, and the United States (Choy, 2011)-that exacerbated with the collapse of the international subprime markets that represents the beginning of the global economic crisis in 2008.
The economic crisis of 2008 negatively impacted the construction industry which translated in greater rates of business exit in the industry (Lafuente et al., 2017). Additionally, the crisis drastically reduced the production and employment levels in the economy. The figures provided by the Spanish Statistical Office (INE) reveal that the weight of the construction industry in the economy (GDP) fell from 16.74% in 2006 to 7.85% in 2012, while the proportion of employment in the industry decreased from 13.16% in 2006 to 6.15% in 2012 (Lafuente et al., 2017).
The fall in the business flow of the industry (incomplete projects and complete projects) is another relevant negative consequence of the economic crisis. Based on statistics made available by the INE, construction permits granted between 2001 and 2010 were observed and compared to the total number of complete buildings in order to understand this performance indicator: the total number of incomplete and on-going building projects was lower than the number of finished buildings.
After the hardest period of the crisis (2008-2012), investment in the construction industry gradually stabilized and, despite the change in the cycle of the housing market, the industry reported a moderate growth during 2015-2017. The European Commission, in its Winter Report 2016, states that construction investments in Spain increased 5.4% in 2015, which represents the first growth after seven years of downward trend. Despite the relatively positive evolution of the industry, the housing market shows a slow recovery and labor costs in the construction industry were reduced by 1.6%. These factors contributed to a moderate improvement in the sector’s profitability after 2014 (Lafuente et al., 2017).
The economic crisis produced a variety of effects that affected different levels of the construction industry in a rather heterogeneous way, which influenced the composition of the industrial fabric in this sector. For 2015 93.4% of construction businesses were micro enterprises with less than ten employees, while only 0.1% (around 180 companies) had more than 200 employees. These data indicate a high level of business atomization, a feature that became more acute during the crisis years (2008-2012). During the crisis period, the number of large and medium- sized companies in Spain declined proportionately more than in the surrounding countries (Spanish Association of Construction Companies (SEOPAN), 2019).
The deductions from the analysis of the evolution of the Spanish construction industry before and after the collapse of the economy lead to the conclusion that business size is a relevant factor that is worth analyzing. These arguments further justify the proposed analysis of the efficiency level of construction businesses in Catalonia during 2005-2016; looking for a more exhaustive study of how construction firms’ operational activity develops in different stages of the economic cycle.
DATA, VARIABLE DEFINITION AND METHOD
DATA
The information used in this work was obtained from the databases of the Sistema de Análisis de Balances Ibéricos (SABI) provided by the Bureau van Dijk (2019). Data was available through the cooperation between the Bureau van Dijk and the Polytechnic University of Catalonia (UPC Barcelona Tech), and the final database includes information for more than 1000 construction businesses operating in Catalonia.
The final database includes detailed financial and organizational information about the analyzed businesses. For the purposes of this study, the collected data includes profile information (market experience, location) as well as data related to their economic activity (total assets, total operating costs, employees, sales and economic profitability). In order to ensure the robustness of the results all the selected businesses develop their activity in the construction sector (NACE code: 41). Due to the interest in studying the efficiency level of construction businesses in different stages of the economic cycle (pre- crisis, crisis and post-crisis), all information was collected for the period 2005-2016.
In order to assess operational efficiency for businesses with different size, the data was organized by size following the criteria set by the European Union: microenterprises with less than 10 employees, small businesses reporting between 10 and 50 employees, and medium and large companies with more than 50 employees. After organizing the data, the final database of Catalan construction firms includes a total number of 15,609 observations (companies) between 2005 and 2016, of which 69.20% are microenterprises, 27.83% are small, and 2.97% are medium and large businesses.
VARIABLE DEFINITION
For the proposed non-parametric frontier model, the following variables were selected as inputs: labor (employees), total assets and total operating cost. The DEA model used in this study assumes that the selected inputs produce one output: sales. It should be noticed that all monetary values are adjusted by inflation (constant 2011 prices) in order to ensure comparability of results.
The table 1 presents the descriptive statistics for the input-output set, distinguishing businesses according to their size as well as the three analyzed periods: the growth period (2005-2008), the crisis period (2009 -2012) and the post-crisis period (2013-2016). From the descriptive in Table 1 one notices that for microenterprises sales (output) and operating costs have fallen by 43.82% in the post-crisis period, relative to figures in the crisis period. For small businesses employment reduction is not significant, sales fell 19.55% in the crisis period compared to the growth period, while the total operating costs in the crisis period grew 8.73% relative to the mean value reported for the growth period. In the case of medium and large businesses one notes that sales have fallen 25.58% in the post-crisis period compared to the growth period.
Table 1 Descriptive statistics for the input-output set according to business size
| MICRO BUSINESSES | SMALL BUSINESSES | MEDIUM/LARGE FIRMS | ||||
|---|---|---|---|---|---|---|
| Mean | Std. dev. | Mean | Std. dev. | Mean | Std. dev. | |
| Panel A: 2005-2008 | ||||||
| Inputs: | ||||||
| Assets | 6614 | 86251 | 8041 | 47621 | 46572 | 111216 |
| Op. cost | 1033 | 2110 | 3297 | 5166 | 44631 | 116403 |
| Employees | 5.21 | 2.78 | 20.56 | 9.04 | 166.61 | 327.21 |
| Output: Sales | 1157 | 2246 | 3657 | 6299 | 47236 | 120098 |
| Panel B: 2009-2012 | ||||||
| Inputs: | ||||||
| Assets | 4563 | 48740 | 9027 | 31346 | 89171 | 201182 |
| Op. cost | 777 | 2958 | 3585 | 12128 | 49175 | 122634 |
| Employees | 4.83 | 2.63 | 20.09 | 9.07 | 169.21 | 317.50 |
| Output: Sales | 727 | 1902 | 3386 | 6656 | 49710 | 126248 |
| Panel C: 2013-2016 | ||||||
| Inputs: | ||||||
| Assets | 2574 | 8921 | 8031 | 27301 | 68020 | 137583 |
| Op. cost | 682 | 1821 | 2877 | 3766 | 34069 | 66067 |
| Employees | 4.76 | 2.43 | 19.46 | 8.99 | 164.4 | 221.30 |
| Output: Sales | 650 | 1193 | 2942 | 3845 | 35151 | 72054 |
Note: all monetary values are deflated by inflation and expressed in thousands of constant 2011 euro.
Additionally, the year-by-year descriptive statistics for the input-output set are presented in Table 2. The data in the table reveal that during the analyzed period the businesses included in the final sample have on average, 13.94 employees, and that sales have drastically fallen down between 2008 and 2016.
Table 2 Descriptive statistics for the input-output set for the analyzed period
| INPUTS (X) | OUTPUT (Y) | ||||
|---|---|---|---|---|---|
| Total assets | Operating cost | Employees | Sales | Observations | |
| 2005 | 6817.93 | 3271.94 | 18.34 | 3634.41 | 1015 |
| 2006 | 8610.68 | 3857.62 | 18.82 | 4219.24 | 1097 |
| 2007 | 10174.45 | 4336.95 | 19.15 | 4686.66 | 1114 |
| 2008 | 10022.60 | 4025.10 | 17.96 | 4275.66 | 1174 |
| 2009 | 8705.61 | 3784.17 | 16.34 | 3909.70 | 1229 |
| 2010 | 9319.66 | 3141.44 | 14.89 | 3152.75 | 1272 |
| 2011 | 8774.47 | 2552.69 | 13.11 | 2493.92 | 1317 |
| 2012 | 6623.01 | 2570.65 | 11.29 | 2238.35 | 1374 |
| 2013 | 5313.86 | 1694.52 | 10.13 | 1618.16 | 1454 |
| 2014 | 4747.61 | 1617.45 | 9.95 | 1640.40 | 1524 |
| 2015 | 4677.92 | 1765.51 | 10.78 | 1796.58 | 1563 |
| 2016 | 4744.25 | 1840.75 | 11.71 | 1892.48 | 1476 |
| Total | 7172.05 | 2758.38 | 13.94 | 2830.89 | 15609 |
METHOD: DATA ENVELOPE ANALYSIS (DEA)
Data Envelopment Analysis (DEA) is a non-parametric frontier method that allows to evaluate the efficiency level for a group of units of analysis (in our case, construction businesses) that use a vector of inputs (x) to produce a vector of outputs (y) (Charnes et al., 1981). DEA models identify the set of production possibilities assuming that the analyzed units (businesses) use x =(x 1 ,…,x J ) ∈ R J inputs to produce y =(y ,…,y ) ∈ R M outputs, and that these sets form the production technology (T):T={( x , y ): x can produce y } (see Cook and Seiford (2009) and Cooper et al. (2011) for excellent reviews on DEA models).
For each business, efficiency is represented by a coefficient (θ), where companies positioned on the frontier are considered efficient (θ=1), while firms below the production frontier are inefficient and the DEA model calculates an inefficiency score indicating the distance to the best practice frontier (θ<1).
In this study the modeled technology exhibits variable returns to scale (VRS) in order to account for potential efficiency effects resulting from size differences among the sampled businesses. Also, the DEA model used in this study is input oriented, that is, the proposed DEA model computes the level of efficiency given a fixed level of output (sales) and seeks to minimize the inputs (costs, employment and assets) included in the production technology. The linear program used in this study to solve the DEA model is presented in the following equation:
 (1)
(1)
In equation (1) the restriction
 allows to model a variable returns to scale technology. The DEA model in equation (1) is applied for the sample of construction firms and for each analyzed year individually (2005-2016).
The efficiency results of the DEA model proposed in this work were computed using the R program.
RESULTS
This section presents the empirical findings. First it evaluates the efficiency results for the Catalan construction industry, next offers an efficiency analysis according to business size.
EFFICIENCY LEVEL OF THE CATALAN CONSTRUCTION INDUSTRY BETWEEN 2005 AND 2016
Table 4 presents the descriptive statistics of the efficiency coefficients computed for the Catalan construction businesses during the period 2005-2016.
For interpretation purposes, the average efficiency result for the entire analyzed period (0.5606) presented in Table 3 suggests that, on average and between 2005 and 2016, the analyzed construction businesses can improve their efficiency 43.94% (1-θ) by reducing their inputs while keeping their output level fixed.
Table 3 Efficiency results for the Catalan construction industry (2005-2016)
| Mean | Std. dev. | Median | Q1 | Q3 | Efficient firms: Number (%) | Observations | |
|---|---|---|---|---|---|---|---|
| 2005 | 0.6116 | 0.5625 | 0.7536 | 0.6392 | 0.8480 | 53 (5.22%) | 1015 |
| 2006 | 0.6394 | 0.9648 | 0.8026 | 0.6680 | 0.8789 | 53 (4.83%) | 1097 |
| 2007 | 0.5691 | 1.7098 | 0.7244 | 0.4654 | 0.7584 | 46 (4.13%) | 1114 |
| 2008 | 0.5947 | 0.7490 | 0.7179 | 0.5688 | 0.8325 | 44 (3.75%) | 1174 |
| 2009 | 0.5926 | 0.3648 | 0.7675 | 0.6601 | 0.8460 | 45 (3.66%) | 1229 |
| 2010 | 0.5590 | 0.4252 | 0.6930 | 0.5750 | 0.8027 | 44 (3.46%) | 1272 |
| 2011 | 0.5343 | 0.9048 | 0.6301 | 0.5239 | 0.7461 | 42 (3.19%) | 1317 |
| 2012 | 0.5206 | 0.7377 | 0.6319 | 0.5345 | 0.6982 | 36 (2.62%) | 1374 |
| 2013 | 0.5114 | 0.9184 | 0.6325 | 0.4556 | 0.7698 | 48 (3.30%) | 1454 |
| 2014 | 0.5343 | 0.7926 | 0.6633 | 0.5344 | 0.7628 | 34 (2.23%) | 1524 |
| 2015 | 0.5285 | 1.1312 | 0.6180 | 0.4502 | 0.7553 | 34 (2.18%) | 1563 |
| 2016 | 0.6080 | 1.1423 | 0.7171 | 0.5754 | 0.8177 | 45 (3.05%) | 1476 |
| Total | 0.5606 | 0.6777 | 0.6831 | 0.5414 | 0.8019 | 524 (3.36%) | 15609 |
The average inefficiency of construction businesses gradually increased over the analyzed period and reached its lowest level (most inefficient) average value in 2013 (0.5114).
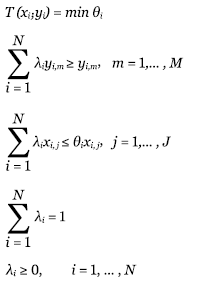
Additionally, Figure 1 shows the temporal evolution of the median inefficiency level as well as of the bottom (Q1) and top (Q3) quartile of the distribution of inefficiency of the sampled businesses.
Note: The continuous line refers to the median inefficiency level, while the dashed line is used to present the evolution of the bottom and top quartiles of the distribution of the efficiency scores.
The efficiency results for poor performing businesses positioned at the bottom quartile of the efficiency distribution (Q1) indicate a clear deterioration of this group of businesses: in 2009 25% of businesses reported an inefficiency level below 0.6601 (efficiency improvement (1-θ): 33.99%), while the estimated efficiency improvements among poor performing businesses was up to 54.98% and 42.46% in 2015 and 2016, respectively. That is, average inefficiency among poor performing businesses experienced a drastic deterioration after 2008.
A similar pattern is observed for top performing businesses (Q3: upper quartile of the efficiency distribution). In 2008, 25% of construction businesses reported an efficiency score higher than 0.8320 (efficiency improvement (1-θ): 16.80%), an efficiency result that deteriorated during the crisis period (2009-2012) and slightly recovered after 2014 (Figure 1).
EFFICIENCY ACCORDING TO BUSINESS SIZE
This section presents the analysis of the efficiency scores computed via the proposed DEA model by business size, distinguishing between micro businesses with less than 10 employees, small firms whose number of employees ranges between 10 and 50 employees, and medium and large firms with more than 50 employees.
Results presented in Table 4 and Figure 2 offer various valuable insights. First, all group sizes follow the general temporal trajectory reported in section 5.1 (Figure 1), that is, drastic efficiency declines are observed after 2008 while slight efficiency improvements are reported for the period 2013-2016.
Table 4 Descriptive statistics for the input-output set for the analyzed period
| TOTAL SAMPLE | MICRO BUSINESSES | SMALL BUSINESSES | MEDIUM / LARGE FIRMS | |||||
|---|---|---|---|---|---|---|---|---|
| Obs. | Average | Obs. | Average | Obs. | Average | Obs. | Average | |
| 2005 | 1015 | 0.6116 | 608 | 0.5583 | 322 | 0.7055 | 85 | 0.7439 |
| 2006 | 1097 | 0.6394 | 681 | 0.5829 | 332 | 0.7523 | 84 | 0.7905 |
| 2007 | 1114 | 0.5691 | 702 | 0.5250 | 330 | 0.6583 | 82 | 0.6884 |
| 2008 | 1174 | 0.5947 | 750 | 0.5992 | 341 | 0.5954 | 83 | 0.5545 |
| 2009 | 1229 | 0.5926 | 794 | 0.5297 | 351 | 0.7497 | 84 | 0.7851 |
| 2010 | 1272 | 0.5590 | 833 | 0.5179 | 356 | 0.6602 | 83 | 0.6492 |
| 2011 | 1317 | 0.5343 | 871 | 0.4980 | 359 | 0.6181 | 87 | 0.6423 |
| 2012 | 1374 | 0.5206 | 925 | 0.4886 | 363 | 0.6004 | 86 | 0.6067 |
| 2013 | 1454 | 0.5114 | 980 | 0.4812 | 389 | 0.5793 | 85 | 0.6285 |
| 2014 | 1524 | 0.5343 | 1043 | 0.4964 | 395 | 0.6405 | 86 | 0.6411 |
| 2015 | 1563 | 0.5285 | 1064 | 0.5059 | 412 | 0.5787 | 87 | 0.6094 |
| 2016 | 1476 | 0.6080 | 999 | 0.5824 | 393 | 0.6628 | 84 | 0.7036 |
| Total | 15609 | 0.5606 | 10250 | 0.5277 | 4343 | 0.6451 | 1016 | 0.6631 |
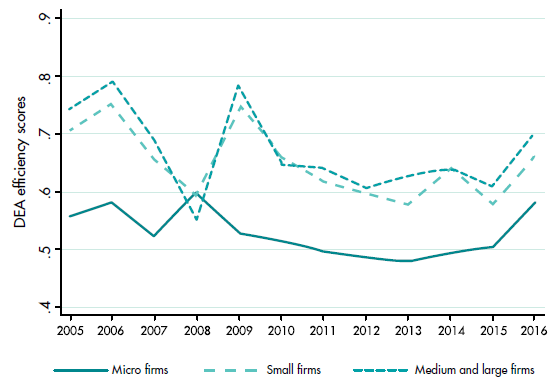
Second, the findings suggest a relationship between business size and efficiency. With the exception of 2008, the findings indicate that micro-businesses with less than 10 employees are systematically more inefficient, relative to the results reported by their small and medium-large counterparts. More concretely, the findings indicate that during the growth period (2005-2008) the mean inefficiency level of micro businesses was 0.5649, that is, in order to become efficient and reach the frontier these businesses could reduce their inputs by 43.51% while keeping their output level fixed (mean efficiency improvement (1-θ): 43.51%). For small and medium-large businesses the reported average efficiency improvement during the growth period was 32.72% and 31.81%, respectively (Table 4).
During the crisis period (2009-2012), the group of micro businesses reported a drastic efficiency fall (mean efficiency: 0.5080) that suggests that these firms could improve their efficiency level by 49.20% in order to become efficient, while for this period the average efficiency improvement for small and medium-large firms was 34.77% and 33.55%, respectively. Also, the group of medium and large businesses shows the highest efficiency results in the analyzed periods: 2005-2008: 0.6819, 2009- 2012: 0.6645, 2013-2016: 0.6438.
Third, results in Table 4 and Figure 2 point to a heterogeneous speed of recovery, in terms of efficiency. In the case of the group of micro businesses, the average efficiency results during the period 2013-2016 (0.5137) is similar to the values reported during the crisis period (2009-2012) (0.5080). The findings indicate that efficiency recovery is an on-going process for both small and medium-large firms: for small firms the average efficiency level for the period 2013-2016 was 0.6131 (mean efficiency during 2009-2012: 0.6523), while the average efficiency level among medium-large firms during 2013-2016 was 0.6438 (mean efficiency during 2009-2012: 0.6645).
CONCLUDING REMARKS, IMPLICATIONS AND FUTURE RESEARCH LINE
CONCLUDING REMARKS
By employment Data Envelopment Analysis (DEA), this study analyzed the efficiency level of the Catalan construction industry during the period 2005-2016. Additionally, it was argued that the temporal trajectory of business efficiency was affected not only by the global crisis that hit most economies, but also by factors associated with business size.
Overall, the findings highlight that inefficiency progressively increased after 2008 (first year of the economic crisis). Additionally, the results indicate that larger businesses (medium and large firms) are more efficient than micro and small construction businesses. For the entire period analyzed in this study (2005-2016), micro businesses reported an average inefficiency of 0.5277 which indicates that these firms should reduce their input level by 47.23% (keeping the output level fixed) in order to become efficient and reach the frontier; whereas average efficiency for small and medium-large organizations during 2005-2016 was 0.6451 and 0.6631, respectively.
IMPLICATIONS
The results of this study have relevant implications for scholars and practitioners. From an academic perspective, the results contribute to extending the growing literature on the relevance of operational aspects as a means for enhancing business efficiency in the construction industry (e.g., Ruddock & Ruddock, 2011; Kapelko et al., 2015; Lafuente et al., 2017).
In the context of this study, it is plausible to argue that the specific technological characteristics of the production process in the construction sector-i.e., high interactions between suppliers and corporate clients, dissimilar level of specificity in the intermediate goods provided by suppliers, and high interaction between the business and different sub-contractors (Keung & Shen, 2017; Lafuente et al., 2017)-affect the productive capacity of construction businesses and, subsequently, their efficiency level. Therefore, by modeling the production technology of construction businesses I show that the management of internal resources is decisive for achieving superior efficiency levels and ensuring the sustainability of the organization in the long term.
The construction industry involves a variety of relationships between construction businesses, suppliers, specialist sub-contractors and customers (Keung & Shen, 2017; Lafuente et al., 2017).
In this sense, I suggest that managers of construction businesses need to turn their attention to the relationship with their key suppliers when considering the implementation of strategic actions that will modify business operations and, consequently, the efficiency level of the organization in the short term.
Because of the relevance of the collaborative incentives construction businesses and sub-contractors, managers will be well advised to creating a strong network with both suppliers and sub-contractors if higher level of efficiency is the desired objective. By conducting a profound analysis of the business’ commercial networks, managers of construction firms will be in a better position to better grasp the value of the different agents with which the business works as well as to develop better strategic plans in periods of economic growth or stagnation.
FUTURE RESEARCH LINES
A series of limitations to the present study should be mentioned. First, like other studies on the efficiency level of construction businesses (see e.g., Horta et al., 2010; Ruddock & Ruddock, 2011; Kapelko et al., 2014), the data do not permit the direct analysis of the underlying operational mechanisms that shape efficiency among the analyzed construction businesses. This implies that I do not evaluate how relevant characteristics of businesses’ operations (e.g., relationship with suppliers, strength of the commercial network, among other) affect the efficiency level of construction businesses. Further research on this issue would be valuable. For example, specifically designed future studies can address this point by evaluating the role on efficiency of changes in business operations (e.g., implementation of different production processes) as well as of specific strategic actions that seek to improve efficiency (e.g., level of specificity of the intermediate goods provided by the supplier, or relationship with subcontractors).
Second, future work should evaluate how variations in the dynamics of trade credit affect efficiency in the construction industry. For example, efficiency can be largely influenced by the access to financial resources (Lafuente et al., 2017) so; therefore, it is plausible to argue that part of the observed inefficiency among construction businesses results from factors alien to business operations, being the access to financial problems a relevant aspect that deserves more attention in future empirical studies.
Finally, from an economic perspective, future research should evaluate the potentially moderating effect of changes in the state of the economy as well as regulatory changes in the relationship between efficiency and business survival and growth in the construction sector.

