


 Inglés (pdf)
 Articulo en XML
 Referencias del artículo
 Enviar articulo por email
 Citado por SciELO
  Similares en
SciELO
Similares en
SciELO 
 Permalink
INTRODUCTION
Within the development debate it is now widely recognized that poverty is mostly a rural phenomenon (Alkire et al., 2014; Anríquez & Stamoulis, 2007; IFAD, 2011). Therefore, rural poverty reduction programs have drawn increased attention among scholars and policy makers (Bebbington et al., 2008; Dehejia, 2005; Meyer & Sullivan, 2008; Molyneux et al., 2016). Increasingly national-level governing bodies and international organizations-i.e., World Bank, UN, FAO-have implemented different projects to combat rural poverty (Molyneux et al., 2016; Schmitt, 2010; Winters & Chiodi, 2011). In many poverty reduction programs, investments in different forms of territorial capital-i.e., the set of localized assets that constitute the competitive potential of the focal territory, including public goods and resources, infrastructures, private capital, social capital, relational capital, human capital, cooperation networks, and agglomeration economies and connectivity (Camagni & Capello, 2013, p. 1387 )-are the preferred implementation model (van der Ploeg et al., 2009).1 For example, both the Food and Agriculture Organization (FAO) and the Organization for Economic Co-operation and Development (OECD) have adopted a framework based on territorial capital to achieve sustainable rural development (OECD, 2006; Vargas, 2010).
Notwithstanding the increased emphasis on territorial capital, little research has addressed the outcomes of investments in different forms of territorial capital at the regional level (e.g., Camagni, 2009; Camagni & Capello, 2013; Horlings & Marsden, 2014). Furthermore, many projects are implemented in developing or marginal territories on the basis of expectations and results generated in developed regions (Molyneux et al., 2016; Schmitt, 2010). Hence, there is a need to understand the role of territorial capital in influencing well-being of beneficiaries living in marginalized rural communities. This paper fills this gap by examining the conditions under which a poverty reduction program that promotes investments in two forms of territorial capital (i.e., human capital and private capital) impacts various dimensions of well-being. Specifically, we evaluate the impact of the Strategic Project for Food Security (SPFS)-a poverty reduction program supported by United Nations and implemented via FAO and the Mexican administration- on well-being dimensions by considering both income and non-income related well-being outcomes among beneficiaries living in marginalized rural communities in Mexico.
Building on the capability approach (Alkire, 2002; Sen, 1999) we argue that the effective exploitation of territorial capital to enhance well-being depends on the properties of support programs in terms of its participatory as well as its capability-enhancing focus, along with the level of commitment of beneficiaries. Our empirical analysis is based on a unique primary dataset of 2,234 households residing in deprived rural areas of Mexico. The sample includes 1,116 focal households (beneficiaries) and a control group of 1,118 non-beneficiaries.
This setting provides the opportunity to analyze how support programs that promote the active participation of individuals (versus non-participating) contribute to well-being. This study looks into the role of capability building on various welfare metrics, answering the call made by Clark (2005) , Robeyns (2006) and Pelenc & Ballet (2015) , among others, for more research on territorial development from a capability approach that accounts for the multidimensionality of well-being. By connecting territorial capital and capability-enhancing actions we contribute to further understand the outcomes that flow from different types of territorial capital investments.
The remainder of the paper is structured as follows: Section 2 presents the theoretical arguments that underpin this study while Section 3 provides an overview of the analyzed poverty-reduction program. Data and the methodological issues are described in Section 4. The results are found in Section 5, while the conclusions and implications are presented in Section 6.
THEORETICAL UNDERPINNING AND HYPOTHESES DEVELOPMENT
THE CAPABILITY APPROACH
The capability approach is a normative framework for understanding relevant problems related to, among others, inequalities, development, poverty and justice. Rather than the accumulation of goods, this approach emphasizes various aspects of the quality of life in increasing individual well-being (Sen, 1999). The core assumption of the capability approach is that individuals' functionings, that is, the person's 'beings' and 'doings'- which can be elementary (e.g., nutrition, health, life expectancy) or more complex (e.g., civil activism in the community or self-respect)-and the people's capabilities-i.e., the genuine opportunities or freedoms to realize their functionings-are critical to achieve well-being (Robeyns, 2005; Sen, 2008). The capability approach suggests that poverty is an outcome of capability deprivation and that inequality is not just the absence of income or income imbalance, but the inability of the poor to exercise their freedoms (Sen, 1991, 2008). Therefore, to achieve their functionings, individuals need the capability to exercise their freedom. Development occurs when people have greater freedoms that enhance their ability for self-reliance (Alkire, 2002; Clark, 2005).
In the capability approach the set of people's capabilities encompasses both the access to resources- for example, goods, services, and intangibles such as human and social capital-and a series of conversion factors which can be personal factors (physical and psychological characteristics), social factors (gender- related, institutional, public goods) and environmental conditions (changes that affect river flows and soil fertility). Conversion factors allow individuals to transform their capabilities into functionings (Robeyns, 2005). Thus, the capability approach defines capabilities in terms not only of the access to resources, but also of the conditions that facilitate the conversion of resources (capabilities) into well-being achievements (functionings). Once people have the capabilities and the conversion factors, decisions on what capabilities should be exploited and what functionings should be pursued operate through free agency (Sen, 1999). The proposition of free agency centralizes on the argument that goals and decisions that improve well-being are contingent on individual's freedom to choose and act on whatever they think is in their well- being. Freedom of choice therefore takes a pivotal role in the definition and improvement of well-being (Alkire, 2002).
Underlying the concept of free agency is the notion that the active participation and involvement of people in decision-making processes increases their well-being by allowing people to select and prioritize the development of those capabilities and pursuit the functionings that they consider most valuable (Aguilera-Fierro, 2017). Hence, in the capabilities approach the decision to enroll in a support program is contingent on the beneficiaries' freedom to pursue the functionings they seek. As such support programs should enhance the 'capabilities' that intended beneficiaries pursue to achieve their own functionings or well-being. Therefore, we expect a positive relationship between enrolment in poverty reduction programs that promote the active participation of beneficiaries and their subsequent well-being outcomes.
H1: Participation in poverty reduction programs has a greater impact on beneficiaries' well being outcomes, compared to those of non-beneficiaries.
THE RELATIONSHIP BETWEEN TERRITORIAL CAPITAL AND WELL-BEING
Recently, several studies have pointed to the important role that territorial capital plays in rural development (Camagni, 2009; Camagni & Capello, 2013; Horlings & Marsden, 2014; van der Ploeg et al., 2009). Territorial capital represents the different types of resources available in the territory which can be mobilized and actively exploited by community members in the region's economic activities (van der Ploeg et al., 2009, p. 19). The economic relevance of territorial capital resides in its capacity to enhance the efficiency and productivity of
local activities (Camagni, 2009). Prior work confirms that different forms of territorial capital-i.e., public goods and resources, infrastructures, private capital, social capital, relational capital, human capital, networks, and agglomeration economies and connectivity-positively influence regional performance (e.g., Camagni & Capello, 2013; Horlings & Marsden, 2014).
In the context of this study, poverty reduction programs, such as the SPFS, contribute to local development by injecting into territories resources that revitalize their territorial capital. Specifically, the SPFS channels these resources with the objective to help develop marginalized rural areas in Mexico. These resources are allocated to the targeted communities via investments in two forms of territorial capital: human capital investments in the form of technical support and training (e.g., water use techniques, agriculture), and investments in physical capital factors such as production equipment and basic infrastructures (e.g., storage facilities).
Individual level human capital along with physical capital represents two important factors of territorial capital, and in this study, we evaluate how investments in these two factors contribute to subsequent well-being levels among program beneficiaries.
Human capital represents the sum of all knowledge, skills, experience and social capital embedded in a person (Becker, 1975). Human capital is a unique form of capital with long-term impact because- unlike other types of tangible assets-knowledge, skills, experience and networks cannot be alienated from the person (Becker, 1993; Simon, 1998). Additionally, human capital components-knowledge, skills and experience-are valuable inputs which can appreciate in value over time. By analyzing economic and entrepreneurial outcomes, prior studies reaffirm the importance of the local community's human capital as a key stimulus for rural development (see, e.g., Swagemakers et al., 2012; Vargas, 2010). This happens through the development of intrinsic abilities and skills with economic potential (Barro, 1991; Becker, 1993; Dehejia, 2005; Gao et al., 2014; Meyer & Sullivan, 2008; Sen, 1999; Simon, 1998).
However, unlike human capital, physical capital represents the tangible infrastructure in a territory and include production properties (land), built-up structures (housing, transportation and communication infrastructures), and technical facilities for food or grain storage (FAO, 2009). Investments in physical infrastructure promote regional development in various ways. Enhanced use of land contributes to improve agricultural and water conservation practices, while enhanced infrastructures promote job creation through the channeling of public funds to infrastructure projects which, in turn, may increase the productivity levels of the rural economy (Vargas, 2010). Additionally, investments in physical capital reduce transportation costs (Lakshmanan, 2011), and create place-specific amenities and services that improve quality of life of rural areas. From a capability perspective (Robeyns, 2005; Sen, 1991, 1999), investments in human capital and physical capital represent an effort to create or develop households' capabilities that can be used by individuals to pursue their functionings (well-being outcomes).
Therefore, we hypothesize,
H2: Among beneficiaries, a positive relationship exists between investments in territorial capital-measured by human capital and physical capital-and well- being outcomes, measured by income and expenditures in education and health.
THE STRATEGIC PROJECT FOR FOOD SECURITY (SPFS)
The Mexican administration has a long tradition of implementing a variety of poverty reduction programs, including conditional cash transfer programs (Aguilera- Fierro, 2017; Winters & Chiodi, 2011), microcredit programs (e.g., 'Fondo Paraguas' program and FIDEY program) (Espinosa-Atoche et al., 2018), and large- scale social programs (e.g., the CONTIGO framework, OPORTUNIDADES, PROCAMPO or MICROREGIONES) that aim to relieve poverty by improving the coverage and quality of public education, health as well as the provision of basic services (Winters & Chiodi, 2011; World Bank, 2004).
In addition to these initiatives, in 2004 the Food and Agriculture Organization (FAO) and the Mexican Ministry of Agriculture, Livestock, Fisheries and Rural Development-introduced the Strategic Project for Food Security (SPFS) seeking to develop marginalized rural areas. This project is based on the territorial capital framework adopted by FAO which operationalizes sustainable rural development as a multidimensional concept including aspects related to household income and the achievement of greater levels of literacy, education and health (FAO, 2009). In the first stage of the project a two-year pilot scheme was launched in 2004 involving 13 municipalities from six Mexican States, and by 2006 communities involved in the SPFS grew to 248 in 16 States. After the pilot scheme period, the allocation of public funds represented the official kick-off for the project in 2007. To achieve its objectives, the SPFS established decentralized rural development agencies which-in collaboration with FAO and the Mexican administration-were responsible for providing support to the communities. Rural development agencies are periodically monitored and evaluated by FAO.
The SPFS specifically targeted highly marginal rural areas across Mexico and channeled resources to households through technical support and specific investments in three areas: human capital (training), physical capital (equipment and infrastructures), and land and water use techniques (OECD, 2012, p. 183). The program also supported small farms and knowledge transfer by organizing meeting and seminars, and providing training to community members 2.
A distinctive feature of the SPFS is that it is not a cash-transfer project. Participating households are called to actively work in the development of their projects. Within the targeted communities, rural development agencies convene all households to a community meeting to inform them about the SPFS. These meetings encourage households to participate in the identification of the causes and potential long-term solutions to reduce poverty. As a result of community meetings, households who voluntarily manifest their interest in participating in the SPFS present their application form so the rural development agency can verify the socio-economic profile of candidate households. The eligibility of beneficiary households is determined by the rural development agency on the basis of economic (income), demographic (family structure and size) and food deprivation criteria established by FAO.
The promotion of community engagement through participatory planning and active involvement is a key aspect of the SPFS. The investments channeled via the SPFS program are designed to create/develop the household's capabilities through the access to specific assets, equipment, and education and training (e.g., machines and equipment for productive purposes, storage facilities) that can improve the productivity of beneficiaries' economic activity (mostly agriculture). To increase community involvement, the SFPS also encourages beneficiaries to invest in their projects. Note that beneficiaries are economically deprived households cannot afford economic investments. Also, land is privately owned (beneficiaries are landowners) so; therefore, beneficiaries mostly provide in-kind contributions, in terms of labor (workdays). The rural development agency determines the investment necessary to run the beneficiaries' project, and in-kind investments cannot represent more than 10% of the total budgeted investment.
DATA
The data used in study comes from a unique primary dataset designed to evaluate households' standard of living and the effects of the SPFS on different well-being dimensions linked to income and consumption patterns. The dataset was collected by conducting face-to-face interviews with individuals spread in two municipalities of the State of Mexico, namely Amanalco de Becerra and Donato Guerra (approximately 125 Km southwest of Mexico City). The list of rural communities is presented in the Appendix (Table A1). The study population comprises nearly 3,500 families who reside in the 26 rural communities analyzed in this study, of which 25 are considered highly marginalized and one extremely marginalized, based on the poverty standards of the Mexican Government (INEGI).
In this study the unit of analysis is the household. Similar to other poverty reduction programs in Mexico (e.g., OPORTUNIDADES and CONTIGO) (e.g., Winters & Chiodi, 2011), the potential beneficiaries of the SPFS program are households residing in rural economically deprived areas, and these arguments further justify the use of household as unit of analysis. Also, and in line with the results showed by Robeyns (2006, p. 363) , this approach based on the analysis of households is consistent with the vast majority of poverty studies in developing economies (e.g., Gao et al., 2014; Winters & Chiodi, 2011).
Information on the SPFS beneficiaries-name, address and year of enrolment in the SPFS-was obtained through a collaboration with one of the rural development agencies accredited by FAO that operate in the State of Mexico (Proveza Consultores Agencia de Desarrollo Rural). Here, households who took part in the SPFS in 2009 and 2010 were identified and interviewed. In the case of the sample of non-beneficiaries, individuals were selected following population patterns-that is, gender and age-and mostly geographical accessibility criteria (access to the community and to education and healthcare centers).
Data collection was achieved through self- administrated, structured questionnaires where individuals were asked to answer essentially close-ended questions. The questionnaire was also subject to a pre- test in order to correct potentially misleading questions, and the data was collected in 2012-between June 15 and November 30-by a team of trained technicians. The interviewers conducted the survey under the direct supervision of one member of the research team, and interviews took between 20 to 30 minutes, depending on the profile of the respondent.
As a result of this procedure, we accessed detailed information for the years 2008-2011 for a representative sample of the two groups analyzed in this study- beneficiaries and non-beneficiaries-about demographic (gender, age and education distribution of family members), economic (income and consumption patterns), and productive (land property) issues, as well as about access to key services (education and health care centers).
The initial sample included 2,234 households (1,116 beneficiaries and 1,118 non-beneficiaries). To ensure the robustness of the results, observations with missing values were excluded from the sample. The final sample comprises data for 2,138 households, of which 1,020 are SPFS beneficiaries and 1,118 did not take part in the program.
Keep in mind that-for both beneficiaries and non- beneficiaries-the study well-being outcomes are reported for four periods, and that SPFS enrolment took place in 2009 and 2010. Therefore, to analyze the post-enrolment effects of the SPFS we use multiple observations for the same unit of analysis so that the final sample includes 8,522 household-year observations (4,080 beneficiaries and 4,080 non-beneficiaries). This approach, in which a cross-sectional data allows to collect information for multiple periods, has been used in previous work on program evaluation (Dehejia, 2005; Gao et al., 2014; Meyer & Sullivan 2008). Here it should be note that recall bias might be present among participant of the study. Recall bias is a common problem in self-reported surveys using retrospective historical data. In our case, recall bias in the form of recall decay may be present. However, the extent to recall decay has an effect on self-reported data depends on the salience of the event (Beegle et al., 2012). Usually, events that have greater salience to the respondent are less likely to be affected by recall decay. The respondent of our survey are households residing in rural economically deprived areas who are primarily engaged in marginal livelihood activities. We believe the being marginal and residing in economically deprived areas participation in programs such as SPFS has greater salience in their life and hence less likely to suffer from recall decay.
VARIABLE DEFINITION
Dependent variables. From the capability approach perspective, the analysis of well-being outcomes should be based on variables that measure functionings rather than capabilities (Robeyns, 2005). Accordingly, the analyzed dimensions of well-being represent proxy variables of different functionings. First, economic-oriented well- being is calculated, for each individual (i), as the total after-tax income generated by the family in a year. Income values are deflated with respect to inflation and are expressed in constant 2011 Mexican Pesos.
The second well-being variables relate to consumption patterns. Education and health are at the core of individual development (Stiglitz, 1998, p. 27 ); therefore, we consider in the analysis two variables that account for consumption in these issues, namely spending on education and spending on health. Given our interest in measuring changes in consumption patterns resulting from the participation in the SPFS, these variables are expressed in percentage points relative to total spending. Note that these variables are expressed in percentage points because a monetary approach-based on expenditure figures- may produce competing results when it comes to identify functionings-poor and expenditure-poor (Laderchi et al., 2003, p. 268 ). Monetary poverty does not reveal all dimensions of deprivation (Robeyns, 2006, p. 363 ), and the proposed rates of expenditure in education and healthcare may capture more accurately functioning-poor households. Table 1 presents summary statistics for the study variables.
Table 1 Descriptive statistics for the study variables (period 2008-2011)
| Beneficiary | Non-beneficiary | Full sample | |
|---|---|---|---|
| Yearly household income (a) | 29,193.50*** | 30,435.36 | 29,842.55 |
| Consumption patterns (expressed in %) | |||
| Housing and food | 0.6036*** | 0.6234 | 0.6140 |
| Education | 0.1479*** | 0.1250 | 0.1360 |
| Health | 0.0627*** | 0.0704 | 0.0667 |
| Transport and communication | 0.0806*** | 0.0753 | 0.0778 |
| Other expenditures | 0.1052 | 0.1059 | 0.1055 |
| Territorial capital | |||
| Years of schooling of the household head | 5.13*** | 6.14 | 5.66 |
| Household head education: primary school or less (dummy) | 0.7441*** | 0.6253 | 0.6819 |
| Household head education: secondary school (dummy) | 0.2304*** | 0.3005 | 0.2671 |
| Household head education: post-secondary studies (dummy) | 0.0255*** | 0.0742 | 0.0510 |
| Family members in primary school | 1.0559*** | 1.2635 | 1.1644 |
| Family members in secondary school | 0.4127** | 0.3781 | 0.3946 |
| Family members in post-secondary studies | 0.0441*** | 0.0218 | 0.0324 |
| Father's labor experience | 16.01*** | 14.91 | 15.44 |
| Mother's labor experience | 2.33*** | 0.88 | 1.57 |
| Total land area (hectares) | 0.9331** | 1.2626 | 1.1054 |
| Land area for housing (hectares) | 0.0618* | 0.3328 | 0.2035 |
| Land area for productive activity (hectares) | 0.8713*** | 0.9298 | 0.9019 |
| Investments in territorial capital | |||
| Total investment in physical capital (a) | 7,806.82 | 7,806.82 | |
| Governmental investment in physical capital (a) | 6,266.05 | 6,266.05 | |
| Beneficiaries' investment in physical capital (a) | 1,540.77 | 1,540.77 | |
| Total training (hours) | 46.03 | 46.03 | |
| Technical training (hours) | 23.26 | 23.26 | |
| Methodological training (hours) | 22.77 | 22.77 | |
| Household profile | |||
| Sex of the household head (one for man) | 0.8294*** | 0.6377 | 0.7292 |
| Age of the household head (years) | 40.24*** | 39.10 | 39.84 |
| Household size | 3.3020*** | 3.1002 | 3.1964 |
| Married or consensual union | 0.7862*** | 0.4293 | 0.5996 |
| Access to education centers (hours) | 0.3380* | 0.3532 | 0.3460 |
| Access to health care centers (hours) | 0.4754* | 0.4637 | 0.4693 |
| Observations (respondents) | 4,080 (1,020) | 4,472 (1,118) | 8,552 (2,138) |
(a) Monetary values are deflated with respect to inflation and expressed in constant 2011 Mexican Pesos (for illustrative and comparative purposes, USD 1 is roughly equivalent to MXN 16.80 pesos). *, **, *** indicate significance at the 10%, 5%, and 1%, respectively (two-tailed).
Participation in the SPFS. The decision to participate in the SPFS entails the development of different tasks that are performed by both members of the corresponding rural development agency and beneficiaries. To identify the participation in the SPFS we use a dummy variable that takes the value of one for participating individuals, and zero otherwise.
Human capital. To measure the household's human capital, we use a set of variables linked to the educational attainment of both the head of the family and other family members, and to labor experience. In the case of education, we introduce the number of years of schooling of the head of the family in all model specifications3.
Additionally, respondents indicated the current educational attainment of the rest of family members. Thus, we introduce a second set of variables indicating the number of family members (other than the head of the family) with primary, secondary or post-secondary studies (family members in post-secondary studies is the reference category). Labor experience is measured by the number of full years of formal work experience of the head of the family and his/her partner. This way, we consider the entire household's human capital in all model specifications.
Physical capital. We measure physical capital in terms of the number of hectares that the family owns. It should be kept in mind that, in order to enhance estimation accuracy, in all model estimations we introduce two variables related to the land owned by households: land used for housing purposes (expressed in hectares), and land exclusively used for economic activities (mostly agriculture, and grain storage).
Investments in territorial capital. The participation in the SPFS entails different investments in human and physical capital that seek to capitalize on existing recourses and enhance the beneficiaries' well-being. Human capital investments are measured by the number of training hours received by beneficiaries. In the context of the SPFS, households can receive one or two types of training: technical training, which emphasizes the core concepts and operational aspects of the assets and/or equipment acquired through the SPFS; and methodological training, which focuses on expanding the beneficiaries' knowledge on their economic activity. To correctly capture the investments in physical capital, we created two variables that account for the total investment made by the SPFS- channeled through rural development agencies-and the beneficiaries through in-kind contributions-computed in workdays-which cannot exceed 10% of the total budgeted investment. Investments are deflated with respect to inflation and expressed in constant 2011 Mexican pesos. The variables linked to investments in physical capital were logged to reduce skewness.
Control variables. We control for the sex and age of the household head, household size, access to educational and health-care centers, location and calendar time. We introduce a dummy variable taking the value of one if the head of the family is a man (zero for woman), while the age of the household head is expressed in years. Household size is measured by the total number of family members. The access to educational and health centers may play a critical role in conditioning SPFS enrolment. For instance, the topography of the analyzed rural communities, jointly with the fact that households do not have their own transportation means make it difficult for families who live far from a school or a hospital to access these facilities. This is detrimental to the households' functionings-in this case, education- and health-related-as a result of the lack of a genuine opportunity (capabilities) to realize them. Thus, accessibility is critical, and we measure the access to educational and health care centers by the time (hours) needed to reach the nearest educational and health care premises. Also, we introduced a set of dummy variables accounting for the rural communities. Finally, calendar time was measured as the number of full years that have passed since January 1, 2008, the starting point of this study. This latter variable rules out the potential effect of time trends and other environmental changes on the well- being of both beneficiaries and non-beneficiaries.
METHOD
In line with the characteristics of the SPFS (section 3) and the arguments that underpin this study (section 2), SPFS households are selected on the basis of expected well-being improvements. Thus, without modeling the SPFS enrolment first, any model explaining the effect of this program on well-being metrics would yield biased results-regardless of whether the model controls for covariates linked to the program-because there is self-selection into program enrolment (Wooldridge, 2002, p. 606 ).4 One would be tempted to consider this econometric problem a perfect candidate for a sample selection model (Heckman, 1979). Yet, the properties of the SPFS entail important considerations that condition our modeling strategy.
First, we examine the effects of the SPFS on future well-being. SPFS enrolment is mostly driven by economic- led and capabilities-led factors (see section 3). Thus, this problem is one of self-selection (Angrist & Pischke, 2009; Heckman & Robb, 1985). Also, future well-being of average beneficiaries may originate in factors other than those strictly related to the decision to participate in the SPFS (Angrist & Pischke, 2009). Therefore, the first stage employs treatment effect models to scrutinize the effect of the SPFS on the beneficiaries' subsequent well- being. This method, originally proposed by Rubin (1974) and further developed by Imbens & Angrist (1994) and Angrist et al. (1996), controls for self-selection problems by modeling well-being as a function of an endogenous dummy variable that accounts for the participation choice (SPFS). In treatment models, the well-being outcomes are observed for all households (beneficiaries and non- beneficiaries)-which is consistent with the notion that individual well-being is not created but rather affected by the SPFS-and the endogenous dummy variable indicating the treatment condition directly enters into the outcome equation (Wooldridge, 2002, p. 603-604 ). In this study, the treatment effect model has the following form:
Participation in
 (1)
(1)
 (2)
(2)
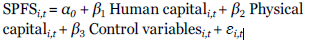
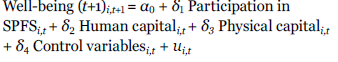
Equation (1) is the treatment probit model where i indexes households, and β j is the vector of parameters. This equation seeks to explain the determinants of SPFS participation. In equation (2)-the post-SPFS outcome equation-well-being is measured via household income, expenditure in education, and expenditure in health. Coefficients (δ j ) are estimated through OLS. The terms ε i and u i are the normally distributed errors for the probit and OLS regressions, respectively. We expect that δ 1 > 0 to corroborate that there is a positive relationship between the voluntary participation in poverty reduction programs (SPFS) and subsequent well-being, in terms of income, expenditure in education and expenditure in healthcare (H1).
The second stage analysis evaluates the relationship between territorial capital investments and subsequent well-being. A potential selectivity problem arises in the estimation of a model with post-enrolment well-being as dependent variable: territorial capital investments linked to the SPFS are used (at different intensities) exclusively by participating households. Thus, the sample is censored and this gives rise to a sample selection bias, which renders OLS regressions inconsistent. Heckman (1979) defines sample selection as a special case of the omitted variable problem in which the inverse Mills ratio (λ) is the omitted variable in the outcome model. We thus use the two-step Heckman method (Heckman, 1979) to estimate consistent coefficients for the effects of territorial capital investments on well-being. The probit SPFS selection model (equation (1)) is used to estimate the inverse Mills ratio. The second step estimates the outcome equation with the inverse Mills ratio as an explanatory variable as follows:
 (3)
(3)
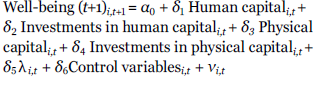
In equation (3) well-being includes the study outcomes (income, expenditure in education, and expenditure in health), human capital refers to training hours (technical and methodological), and human capital investments include the economic funds provided by the SPFS and the beneficiaries' in-kind investments. Parameters (δ j ) are estimated by OLS and the model is performed solely on the sample of beneficiaries. Finally, the term ν i is the normally distributed error. We expect that δ 2 > 0 and δ 4 > 0 to corroborate the positive relationship between the beneficiaries' territorial capital investments and subsequent well-being (H2).
RESULTS
THE WELL-BEING EFFECTS RESULTING FROM THE PARTICIPATION IN THE SPFS
The treatment regression models relating the participation in the SPFS and subsequent well-being levels are depicted in Table 2. Concerning the probit model estimating the SPFS participation, results show that SPFS enrolment increases for larger households where the educational attainment of the family head is low, for single parent households, and for households with lower levels of productive land and evident difficulties to access school premises. Similar to Winters & Chiodi (2011) , this result confirms that the probability of program participation increases for severely deprived households.
Table 2 Treatment effects model: Impact of the SPFS on household's well-being
| Participation in SPFS | Income (t+1) | Expenditure in education (t+1) | Expenditure in health (t+1) | |
|---|---|---|---|---|
| Participation in SPFS | 0.6058** (0.2528) | 0.3056*** (0.0690) | 0.0627** (0.0326) | |
| Years of schooling of the household head | -0.0443*** (0.0075) | 0.0295*** (0.0050) | 0.0053*** (0.0014) | 0.0011* (0.0006) |
| Father's labor experience | -0.0116 (0.0285) | 0.0845*** (0.0106) | -0.0091*** (0.0033) | -0.0022* (0.0012) |
| Mother's labor experience | 0.1664*** (0.0367) | 0.0178 (0.0172) | -0.0154*** (0.0048) | -0.0047*** (0.0018) |
| Family members in primary school | -0.2120*** (0.0671) | -0.0376 (0.0294) | 0.0254*** (0.0088) | -0.0017 (0.0033) |
| Family members in secondary school | 0.0505 (0.0794) | 0.0347 (0.0285) | 0.0223*** (0.0087) | -0.0026 (0.0030) |
| Land area for housing (hectares) | 0.3560** (0.1628) | -0.3520*** (0.0727) | -0.0069 (0.0216) | 0.0638*** (0.0078) |
| Land area for productive activity (hectares) | -0.1002*** (0.0184) | 0.0097 (0.0111) | 0.0047 (0.0032) | 0.0024** (0.0012) |
| Sex of the household head (one for man) | 0.1003 (0.1151) | 0.1507*** (0.0434) | 0.0011 (0.0132) | 0.0020 (0.0046) |
| Age of the household head | -0.0012 (0.0017) | -0.0019*** (0.0007) | -0.0005** (0.0002) | -0.0005** (0.0002) |
| Family size | 0.1948*** (0.0662) | 0.0498* (0.0282) | 0.0101** (0.0045) | 0.0129** (0.0051) |
| Married or consensual union | -0.4558*** (0.1217) | 0.1634*** (0.0596) | 0.0161 (0.0175) | 0.0059 (0.0066) |
| Access to education centers (hours) | 0.2391** (0.1186) | |||
| Access to health care centers (hours) | 0.0818 (0.0726) | |||
| Community | Yes | Yes | Yes | Yes |
| Time | Yes | Yes | Yes | Yes |
| Inverse Mill's ratio (lambda) | -0.3459** (0.1545) | -0.1641*** (0.0421) | -0.1641*** (0.0421) | |
| Intercept | 0.4662*** (0.1578) | 9.3287*** (0.1926) | -0.1785*** (0.0544) | -0.1785*** (0.0544) |
| Wald test (chi2) | 496.86*** | 821.65*** | 821.65*** | |
| Pseudo R2 | 0.1533 | |||
| LR chi2 | 211.02*** | |||
| Observations | 6,414 | 6,414 | 6,414 |
Standard error is presented in brackets. *, **, *** = significant at the 10%, 5%, and 1% level, respectively.
Hypothesis 1 proposes a positive relationship between program enrolment (SPFS) and well-being outcomes. This hypothesis is supported. The results in Table 2 show that the coefficient for the participation in the SPFS is positive and statistically significant for the three analyzed well- being variables.
To help interpret the results for the effect of the SPFS on well-being we computed the average treatment effect on the treated (ATET) following the matching method by Rosenbaum and Rubin (1983) . Underlying the estimation of the ATET is the assumption of selection on observables (Wooldridge, 2002, p. 607 ). In line with our theory, this implies that the household's profile (x) conditions SPFS enrolment (equation (1)). The ATET is computed for each adopting household as
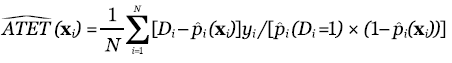
(Angrist, 1998). The Rosenbaum-Rubin method also computes the effect of non-participating in the SPFS on well-being, that is, the non-treatment effect on non- participating households (ATENT) conditional on x as .
For the logged income variable, we obtained the exponentiated value of the estimated treatment effect to correctly interpret the magnitude of the effects of the SPFS on income. The estimated ATET (7.21) indicates that, on average, SPFS enrolment increases household's yearly income by MXN 1,352.89 . For an average household reporting a yearly income of MXN 29,193.50 (roughly equivalent to USD 1,700) (Table 1), this result translates in an increase of 4.63% in income as a result of participating in the SPFS. The estimated treatment effect (ATET: 7.21) is significantly higher (t-test: 18.40 and p < 0.001) than the estimated income increase, of MXN 126.47 reported for non-adopting households (ATENT: 4.84).
The results for expenditures in education and health reveal a shift in consumption patterns as a result of participating in the SPFS. More concretely, in the case of education expenses the ATET is 0.0334 which indicates that, on average, SPFS participation increases 3.34 percentage points the education expenditures. For an average household whose education expenses are 13.60% (0.1360) of total consumption the result implies that, on average, spending on education would rise to 16.94% of total consumption (a variation rate of 24.56%), and this effect is significantly greater (t-test: 28.80 and p < 0.001) than the estimated increase of 1.27 percentage points reported for non-beneficiaries (ATENT: 1.27). The estimated effect of SPFS enrolment on health expenses is 1.32 percentage points (ATET: 0.0132) which implies a variation of nearly 20% in health spending. The estimated ATET is significantly higher than the effect of not participating in the program (ATENT: -1.10) (t-test: 21.34 and p < 0.001).
To better illustrate the magnitude of the effects of the SPFS, a supplementary analysis explores the well-being differences among beneficiaries before (t-1) and after (t+1) the enrolment in the SPFS. For enhanced readability of the results, the well-being values were centered on the program enrolment period so that values for beneficiaries and non-beneficiaries refer to the same years. Results in Table 3 show that, compared to non-beneficiaries, well-being changes are more pronounced among the group of beneficiaries. For beneficiaries, average income increased 4.22% after the participation in the SPFS, while average income of non-beneficiaries only grew 1.67%. Although beneficiaries have lower initial income levels, looking at the distribution of income we note that the inequality gap narrowed between beneficiaries and non- beneficiaries during the analyzed period. Table 3 shows that average income increased noticeably (8.70%) for SPFS beneficiaries in the bottom decile of the distribution of income.
Table 3 Changes in well-being outcomes before and after the SPFS
| Before SPFS (t-1) | After SPFS (t+1) | Variation | Wilcoxon signedrank test (Z-value) | |
|---|---|---|---|---|
| Panel A: Household income (in 2011 constant Mexican pesos) | ||||
| 28,488.84 | 29,690.52 | |||
| Beneficiaries | (14,350.80) | (15,600.00) | 1,201.68 | 4.102*** |
| 30,340.68 | 30,847.44 | |||
| No beneficiaries | (16,165.00) | (16,195.00) | 506.76 | 1.725* |
| Panel B: Education expenditures (% of total consumption) | ||||
| Beneficiaries | 14.37% (197) | 14.91% (172) | 0.54 | 6.237*** |
| No beneficiaries | 12.03% (243) | 12.31% (242) | 0.28 | 1.748* |
| Panel C: Health expenditures (% of total consumption) | ||||
| Beneficiaries | 6.22% (307) | 6.78% (271) | 0.56 | 10.127*** |
| No beneficiaries | 7.19% (241) | 6.98% (244) | -0.21 | -2.634 |
Note: For income, values in brackets refer to the income at the first (bottom) decile of the income distribution. For the variables related to expenses in education and health, values in brackets indicate the number of households that do not spend in the focal category, that is, zero expenditure in education and health. *, **, *** = significant at the 10%, 5%, and 1% level, respectively (Wilcoxon signed-rank test).
Differences in consumption patterns are also remarkable between the two groups. Among beneficiaries, average education expenses increased to 14.91% of total consumption among beneficiaries, and the number of households with no education expenses decreased after the implementation of their projects. Similarly, we report significant changes in the level of health spending and in the number of households with no health expenditures. On contrary, in the group of non-beneficiaries both the level of health spending and the number of households with no health expenditures slightly worsen between 2008 and 2011.
INVESTMENTS IN TERRITORIAL CAPITAL AND WELL-BEING
Having confirmed that SPFS beneficiaries experience significant increases in their well-being (section 5.1), this section examines if the reported improvements in well-being originate in the territorial capital investments linked to the SPFS (i.e., investments in human capital and specific productive assets).
Hypothesis 2 states that, among beneficiaries, the investments in territorial capital linked to the SPFS-that is, human capital and physical capital-are positively related to subsequent well-being. Results support this hypothesis in the case of the methodological training variable (human capital investment) and the beneficiaries' investments in physical capital, while we find no support for this hypothesis when the investments in territorial capital are measured by technical training and the government's investment in physical capital (Table 4).
Table 4 Heckman model: Impact of investments in territorial capital on household's well-being
| Participation in SPFS | Income (t+1) | Expenditure in education (t+1) | Expenditure in health (t+1) | |
|---|---|---|---|---|
| (1) | (2) | (3) | ||
| Investment in human capital: Technical training (hours) | -0.0060*** (0.0011) | -0.0012*** (0.0002) | 0.0002 (0.0002) | |
| Investment in human capital: Methodological training (hours) | 0.0046*** (0.0012) | 0.0004** (0.0002) | 0.0005*** (0.0002) | |
| Governmental investment in physical capital (a) | -0.0494 (0.0457) | -0.0148 (0.0094) | 0.0120** (0.0061) | |
| Beneficiaries' investment in physical capital (a) | 0.0449** (0.0205) | 0.0154** (0.0062) | 0.0109*** (0.0040) | |
| Years of schooling of the household head | -0.0443*** (0.0075) | 0.0493** (0.0205) | 0.0025 (0.0033) | -0.0021 (0.0023) |
| Father's labor experience | -0.0116 (0.0285) | 0.0465** (0.0237) | -0.0101** (0.0042) | 0.0019 (0.0029) |
| Mother's labor experience | 0.1664*** (0.0367) | -0.0865 (0.0935) | -0.0168 (0.0149) | 0.0110 (0.0103) |
| Family members in primary school | -0.2120*** (0.0671) | -0.0194 (0.0628) | 0.0068 (0.0096) | -0.0048 (0.0067) |
| Family members in secondary school | 0.0505 (0.0794) | 0.0061 (0.0834) | 0.0188 (0.0129) | 0.0047 (0.0090) |
| Land area for housing (hectares) | 0.3560** (0.1628) | -0.7088*** (0.2276) | 0.0199 (0.0371) | 0.0834*** (0.0255) |
| Land area for productive activity (hectares) | -0.1002*** (0.0184) | 0.0536 (0.0534) | -0.0042 (0.0086) | 0.0045 (0.0059) |
| Sex of the household head (one for man) | 0.1003 (0.1151) | -0.1188 (0.1121) | -0.0097 (0.0175) | 0.0073 (0.0122) |
| Age of the household head | -0.0012 (0.0017) | -0.0011 (0.0017) | -0.0010*** (0.0003) | 0.0004** (0.0002) |
| Family size | 0.1948*** (0.0662) | 0.0394* (0.0219) | 0.0252*** (0.0094) | 0.0065 (0.0066) |
| Married or consensual union | -0.4558*** (0.1217) | 0.2193 (0.1602) | 0.0016 (0.0254) | 0.0036 (0.0176) |
| Access to education centers (hours) | 0.2391** (0.1186) | |||
| Access to health care centers (hours) | 0.0818 (0.0726) | |||
| Community | Yes | Yes | Yes | Yes |
| Time | Yes | Yes | Yes | Yes |
| Inverse Mill's ratio (lambda) | -0.7657** (0.3637) | -0.1964*** (0.0530) | -0.0596 (0.0737) | |
| Intercept | 0.4662*** (0.1578) | 10.6327*** (0.6093) | 0.2065** (0.1022) | -0.0564 (0.0696) |
| Wald test (chi2) | 98.27*** | 459.42*** | 125.15*** | |
| Pseudo R2 | 0.1533 | |||
| LR chi2 | 211.02*** | |||
| Observations | 6,414 | 6,414 | 6,414 |
Standard error is presented in brackets. *, **, *** = significant at the 10%, 5%, and 1% level, respectively.
Among beneficiaries, and holding other variables constant at their means, the estimated average income increase resulting from each extra hour of methodological training is 0.46% (Model 1 in Table 4). In the case of spending on education and health, results indicate that a one-hour increase in methodological training shifts consumption patterns by raising the relative weight of education and health expenditures four and five percentage points, respectively (Models 2 and 3 in Table 4).
Methodological training provides beneficiaries with knowledge on how to exploit their productive resources. For instance, by instructing beneficiaries in agriculture practices and water collection systems, this type of knowledge has the potential to increase agricultural productivity. On contrary, technical training negatively impacts future income and future education spending. This type of training emphasizes operational aspects of the assets acquired through the SPFS (e.g., stoves, and water tanks) and mostly instructs beneficiaries on how to handle new equipments. By studying technical aspects of the new assets, beneficiaries obtain knowledge that may improve individuals' capacity to run new equipments. However, we argue that the potential productivity effect of technical training is surpassed by the impact of methodological training which is more directly related to the household's economic activity.
The results for the physical capital variables highlight the role of the beneficiaries' investments. Results in Model 1 of Table 4 show that a 10% increase in physical capital raises income 0.43% . Although the estimated net effect is rather small, we find a significantly positive effect of physical capital investments and future spending on education and health. For instance, a 10% increase in physical capital translates into a change in education spending of 0.15 percentage points among beneficiaries. Similarly, a 10% increase in the beneficiary's physical capital investment would raise 0.10 percentage points the relative weight of health expenditures.
CONCLUDING REMARKS, IMPLICATIONS AND DIRECTIONS FOR FUTURE RESEARCH
This study evaluates how capability-enhancing programs help to enhancing various well-being dimensions. Building on the capability approach, we hypothesized that territorial capital investments increase households' capabilities, thus creating the conditions to consumption diversification and the pursuit of different functionings related to human capital and health.
Overall, the findings are consistent with prior studies that emphasize the critical role of poverty reduction programs in improving the well-being of underprivileged households (Gao et al., 2014; Rawlings & Rubio 2005; Robeyns, 2005). However, households do not realize the generally positive effects of the territorial capital investments linked to the SPFS at the same intensity. We suggest that discrepancies may arise from differences in the value created by investments in territorial capital, and from differences in the level of capability deprivation among households which may impact the coupling of capability- enhancing actions (that is, territorial capital investments) to the achievement of functionings (that is, needs).
The results reveal that the SPFS program helps narrow the income inequality gap between beneficiaries and non- beneficiaries. The findings also show that beneficiaries- who report lower income levels than non-beneficiaries- spend more resources on education, even before the implementation of their projects. In line with Robeyns (2006) , these results suggest that not all functionings-poor households are necessarily income-poor, and vice versa.
This paper has relevant implications for policy makers. First, public administrations of all ideologies and international organizations channel funds to rural communities based on the number of poor households according to income criteria. Based on our results, we suggest that well-being policies should not be restricted to financial instruments only, and that policy makers need to turn their attention to variables linked to different types of functionings (that is, education and health) when analyzing well-being in marginal rural areas.
Second, the prioritization of capability-building interventions-in our case, investments in two forms of territorial capital that facilitate the access to knowledge and productive assets-with a long-term perspective also increase psychological-oriented capabilities by promoting social processes that increase security and economic stability (Robeyns, 2005; Stiglitz, 1998).
Nevertheless, poverty reduction programs are often driven by policy objectives that promote change in the short-term, which may mitigate their real impacts in the long run (Stiglitz, 2002). Under these conditions, efficient information schemes-i.e., those prioritizing the interaction between policy-makers and the community-are critical to create communication channels that help align the interests of policy makers (e.g., resource or aid allocation policies) with those of the targeted communities (e.g., sustained development). This way, investments linked to support programs would contribute to improve different well-being dimension (that is, functionings) highly valued by beneficiaries. Also, support programs built on community participation and involvement may prove themselves efficient in breaking the potential unintended negative effects resulting from the dependencies that support programs can create.
Third, education and health are at the core of individual development (Stiglitz, 1998, p. 27 ). Based on the results indicating that a significant shift in consumption patterns follows SPFS enrolment, we suggest that agendas that call for inclusive development should consider the capabilities and the 'freedom of agency' of beneficiaries. This approach might be the fundamental level change that addresses the needs of the poorest communities in a region.
Finally, the results presented in this study are open to further verification. First, although our analysis disentangles key consumption components, data do not permit the analysis of consumption decision-making processes. Further research on this issue would be valuable. For example, future work should evaluate the households' response to different incentives and investments to determine the actions that have a greater impact on consumption patterns.
Second, like other studies on well-being, the income and consumption variables are analyzed individually. This measurement issue suggests the need for more data on the potential complementarities between different well- being dimensions. From a capability approach, specifically designed future research can address this point by testing the informative power of well-being measures or the cost to access a minimal set of basic functionings. Third, the results of this study are based on the analysis of households residing in 26 Mexican rural communities.
Obviously, we cannot establish that the findings are generalizable to all households living in economically deprived areas. The sampled households could have idiosyncratic characteristics that impacted their well- being patterns. Yet, the results presented in this study have a strong intuitive and conceptual appeal, and are open to future verification. Future work should evaluate our arguments on the relevance of participatory poverty reduction programs using data for a longer time period and for a wider array of communities located in different geographic contexts. Finally, in a closely related manner, cultural contexts and territorial differences might affect the effectiveness of poverty reduction programs across countries. The geographic specificity of the study calls for obvious caution when interpreting and generalizing its findings.

