SciELO - Scientific Electronic Library Online

 
vol.19 número2Comparación de parámetros antropométricos y de composición corporal de futbolistas profesionalesDiferencias de estilos ofensivos y variables situacionales técnicas entre las ligas de fútbol de élite europeas y sudamericanas índice de autoresíndice de materiabúsqueda de artículos
Home Pagelista alfabética de revistas  

Servicios Personalizados

Revista

Articulo

Indicadores

Links relacionados

  • No hay articulos similaresSimilares en SciELO

Compartir


MHSalud

versión On-line ISSN 1659-097X

MHSalud vol.19 no.2 Heredia jul./dic. 2022

http://dx.doi.org/10.15359/mhs.19-2.2 

Artículo

A Proposal of Speed Zone Classification in Basketball: A New-Criteria Based on Maximum Registered Values

Propuesta para la clasificación de las zonas de velocidad en baloncesto: Un nuevo criterio basado en los máximos valores registrados

Proposta para a classificação das zonas de velocidade no basquetebol: Um novo critério baseado nos valores máximos registrados

Daniel Rojas-Valverde1 
http://orcid.org/0000-0002-0717-8827

Carlos Gómez-Carmona2 
http://orcid.org/0000-0002-4084-8124

Markel Rico-González3 
http://orcid.org/0000-0002-9849-0444

Jose Pino-Ortega4 
http://orcid.org/0000-0002-9091-0897

1 Universidad Nacional, School of Human Movement Science and Quality of Life (CIEMHCAVI), Centre for Research and Diagnosis in Sport and Health (CIDISAD), Heredia, Costa Rica; University of Extremadura, Sport Science Faculty, Group of Sport Training and Physical Conditioning (GAEDAF), Caceres, Spain, drojasv@una.cr

2 University of Extremadura, Sport Science Faculty, Optimization of Training and Sport Performance Research Group (GOERD), Caceres, Spain. cgomezcu@alumnos.unex.es

3 University of the Basque Country, Department of Physical Education and Sport, UPV/EHU, Vitoria- Gasteiz, Spain, markeluniv@gmail.com

4 University of Murcia, Sport Science Faculty, Department of Physical Activity and Sport Sciences. International Excellence Campus ''Mare Nostrum.'' San Javier, Murcia, Spain, josepinoortega@um.es

Abstract

The quantification of training load has become mandatory for coaches and team staff. Within the analyzed variables, distance covered at different speed zones is one of the most studied. However, there is no consensus in the definition of speed zones in the published articles about each team sport, so it makes difficult a comparison between them. Therefore, the purposes of this article were to establish a criteria standard in the classification of speed zones in team sports and to analyze its practical application in basketball. Five speed categories were established for basketball following the methodology described above: 0-10km/h, >10-13.8 km/h, >13.8-17.6 km/h, >17.6-21.5 km/h, and >21.5 km/h. The results showed differences between periods in high-speed displacements and sprints, maximum speed, total decelerations, and accelerations. In conclusion, the categorization of workload based on standard deviation according to maximum speed could be a viable option to individualize the analysis of distance covered per speeds in team sports such as basketball. Its use may lead to a better understanding and contextualization of the locomotion data in specific sports and teams.

Keywords: Team sports; speed zones; sprint; high speed running; intensity workload

Resumen

La cuantificación de la carga de entrenamiento se ha convertido en una obligación para el personal entrenador y el personal técnico en los deportes de equipo. Dentro de las variables analizadas, la distancia recorrida en distintas zonas de velocidad es una de las más estudiadas. Sin embargo, no existe consenso en la definición de zonas de velocidad en los artículos publicados sobre cada uno de estos deportes, por lo que dificulta la comparación entre ellos. Por tanto, los objetivos de este artículo fueron establecer un criterio estándar en la clasificación de zonas de velocidad en los deportes de equipo y analizar su aplicación práctica en baloncesto. Se establecieron cinco categorías de velocidad para el baloncesto siguiendo la metodología descrita anteriormente: 0-10 km/h, >10-13,8 km/h, >13,8-17,6 km/h, >17,6-21,5 km/h y >21,5 km/h. Los resultados muestran entre períodos en desplazamientos de alta velocidad y esprints, velocidad máxima, desaceleraciones y aceleraciones totales. En conclusión, la categorización de las demandas basadas en la desviación estándar, según la velocidad máxima, podría ser una opción viable para individualizar el análisis de la distancia recorrida por velocidades en deportes de equipo como el baloncesto. Su utilización puede ayudar a una mejor comprensión y contextualización de los datos de desplazamientos en deportes y equipos específicos.

Palabras clave: Deportes de equipo; zonas de velocidad; esprint; carrera a alta velocidad; intensidad de la carga de trabajo

Resumo

A quantificação da carga de treinamento se tornou uma obrigação para treinadores e pessoal técnico em esportes coletivos. Entre as variáveis analisadas, a distância percorrida em diferentes zonas de velocidade é uma das mais estudadas. Entretanto, não há consenso na definição de zonas de velocidade nos artigos publicados sobre cada esporte coletivo, o que torna difícil a comparação entre eles. Portanto, os objetivos deste artigo eram estabelecer um critério padrão na classificação das zonas de velocidade nos esportes coletivos e analisar sua aplicação prática no basquetebol. Foram estabelecidas cinco categorias de velocidade para o basquetebol seguindo a metodologia descrita acima: 0-10 km/h, >10-13,8 km/h, >13,8-17,6 km/h, >17,6-21,5 km/h, >21,5 km/h. Os resultados mostram entre períodos de alta velocidade e sprints, velocidade máxima, desacelerações e acelerações totais. Em conclusão, a categorização das demandas com base no desvio padrão de acordo com a velocidade máxima poderia ser uma opção viável para individualizar a análise da distância percorrida pelas velocidades em esportes coletivos como o basquetebol. Seu uso pode ajudar a compreender e contextualizar melhor os dados de movimento em esportes e equipes específicas.

Palavras-chave: Esportes de equipe; zonas de velocidade; esprint; corrida de alta velocidade; intensidade da carga de trabalho

Introduction

The monitoring of training load has become essential for coaches and team staff due to it has shown strong relationships with changes in physical fitness performance (Jaspers et al., 2017), injury risk (Malone et al., 2018) as well as neuromuscular fatigue (Garrett et al., 2019). In addition, the quantification of training load is useful to monitor rehabilitation programs (Greig et al., 2019).

In addition, the distribution of training load is important to ensure sufficient after-game recovery, prevent pre-match fatigue (Akenhead et al., 2016; Akenhead y Nassis, 2016; Coutinho et al., 2015; Fessi et al., 2016; Jeong et al., 2011; Malone et al., 2015) and allow training prescription and planification. Training load could be classified into kinematic, neuromuscular, and physiological variables (Gómez-Carmona et al., 2020). Players' kinematic profile has been assessed several times (Jaspers et al., 2017) by evaluating distance covered, which has often been described based on different speed zones in different team sports such as futsal (De Oliveira Bueno et al., 2014), soccer (Malone et al., 2018), or basketball (Sampaio et al., 2014).

Due to each team dynamic and game characteristics are associated to their internal logic (Parlebas, 2002), each team sport differ in the thresholds for classifying the speed zones. However, into each team sports there is no agreement too. Different zones have been proposed in soccer such as: (A) male professional players of Portuguese First Division: zone 1 (0-6.9 km/h), zone 2 (7.0-9.9 km/h), zone 3 (10.0-12.9 km/h), zone 4 (13.0-15.9 km/h), zone 5 (16.0-17.9 km/h), and zone 6 (>18.0 km/h) (Aguiar et al., 2013); (B) collegiate male players: walking (0-6.9 km/h), jogging (7-13.9 km/h), running (14-19.9 km/h), and sprint (>20 km/h) (Clemente et al., 2017); or (C) recreational male players: seven groups where zone 1 (0-2 km/h), zone 2 (2-5 km/h), zone 3 (5-9 km/h), zone 4 (9-13 km/h), 13-16, 16-20, and > 20 km/h), and the bands were summarized in three groups as low-intensity movement (< 9 km/h), moderate-intensity running (9-13 km/h), and high-intensity running (> 13 km/h) (Randers et al., 2014).

Regarding indoor sports, specific speed zones were found in futsal following Naser, Ali & Macadam (2017) that divided high-speed intensities in high-intensity (>15 km/h) and sprinting (>25 km/h) in semiprofessional male players or following Makaje et al. (2012) that determined intervals in standing (0-0.9 km/h), walking (1.0-4.9 km/h), jogging (5-7.9 km/h), low-speed running (8-11.9 km/h), moderate-speed running (12-17.9 km/h), high-speed running (18-23.9 km/h), and sprinting (>24 km/h) in elite-level male players. In basketball, the most used speed zones distribution were stationary/walking (<6.0 km/h), jogging (6.0-12.0 km/h), running (12.1-18.0 km/h), high-intensity running (18.1-24.0 km/h), and sprinting (>24.1 km/h) (Pino-Ortega et al., 2019; Vázquez-Guerrero et al., 2019) during the evaluation of elite-level youth players. However, there are other classifications based on individual player capacities (maximum reached speed), such as those proposed by Reina-Román et al.(2019), divided into six zones: zone 1 (50-60%), zone 2 (60-70%), zone 3 (70-80%), zone 4 (80-90%), zone 5 (90-95%), and zone 6 (>95%) in amateur female basketball players.

The fact that each author differs in the classification of speed zones makes the comparison and general conclusions about distance covered at different speed zones in each team sports difficult. The design of a method for obtaining speed zones applicable in all sports modalities and adapted to the specific characteristics of each player/team will make it possible to compare the demands between studies (Rojas-Valverde et al., 2019; Rojas-Valverde et al., 2020). Therefore, the purposes of the present study were to propose a criterion for speed zone intervals in team sports in order to allow comparison and further general conclusions based on a consensus in speed zone definition and to analyze its practical application in basketball.

Methods

Participants

A total of 94 basketball players (age: 17.6±0.8 years; height: 1.91±0.08 m; body mass: 82.5±8.8 kg; BMI: 22.7±1.8 kg/m2) participated in the present study. They were active members of 8 clubs, participants in the U18 Basketball EuroLeague Tournament, Istanbul, Turkey 2016-17. The data were collected from 13 official matches for seven days, for a total of 925 data cases. All players met the following inclusion criteria: >8min of participation in each match period and played in all matches. In addition, the participants did not present any physical limitations or musculoskeletal injuries that could affect testing (Bastida-Castillo et al., 2019). The study was conducted according to the Declaration of Helsinki and was approved by the Bioethics Commission of the University of Murcia (ID: 2061/2018). Participants and teams were informed of the risk and provided informed written consent.

Instruments and Procedures

The data were recorded with an inertial measurement unit (IMU) called WIMU PRO™ (RealTrack Systems, Almeria, Spain). This equipment and its measurements are valid and reliable for high-intensity performance (Bastida Castillo et al., 2017). This IMU contains four 3D accelerometers, as well as other sensors (three 3D gyroscopes with 8000 degrees/second full-scale output range, a 3D magnetometer, a 10 Hz GPS, an 18 Hz UWB, etc.); this portable instrument detects and measures movement using a micro-electromechanical system (sampling frequency 10 to 1000 Hz). The full-scale output ranges of the four 3D accelerometers are ±16 g, ±16 g, ±32 g, and ±400 g. In order to obtain a clean signal, the accelerometer company introduced an optimum filter process related to the different sample frequencies (Gómez-Carmona et al., 2019).

Each device has eight gigabytes of internal memory, a USB port, and its own GHz microprocessor. The device has 4h battery life, weighs 70 g, and its dimension is 81x45x16 mm. The ultra-wideband system occupies a very large frequency band (>0.5 GHz) that is only allowed to transmit at very low power; besides, the signal emits little noise that can coexist with other technologies without influencing them (Bastida-Castillo et al., 2019).

System installation

The UWB reference system was composed of six antennae placed around the field. The inertial device was attached to each player before the game in the medial line between scapulae at T2-T4 level using an adjusted neoprene vest, following previous study protocols (Reche-Soto et al., 2019). The antennae were set up around the court, following Luteberget, Spencer, & Gilgien (2018), in optimal conditions. The antennae with UWB technology were fixed 5 m from the perimeter line in the corners (n = 4) and 7 m from the middle line of the field (n = 2) and from behind the goals (n = 2) (Figure 1), forming an octagon for better signal emission and reception. All of the antennae were positioned at the height of 3 m and held by a tripod (Bastida-Castillo et al., 2019). Once installed, they were switched on one by one, with the master antenna turned on last. From that moment, it was necessary to respect a 5-minute protocol in which the antennae calculate their positioning and the distance between them. Finally, unlike GPS sensors, UWB manufacturers provide a method that allows data time synchronization. In this case, the master antenna manages the time using a common clock that allows data recording simultaneously. Time position coordinates were calculated with an 18 Hz sampling rate (Bastida-Castillo et al., 2019). The accuracy and the reliability of UWB technology obtained satisfactory results for speed (bias= 0.09 km/h; ICC=0.979) and distance (bias= 0.57-5.89%; %TEM= 1.19; bias= 0.18 m) (Bastida Castillo et al., 2018).

Data processing

Many positioning algorithms can be classified into five main categories based on estimated measurements (Alarifi et al., 2016). Typically, with a time difference of arrival (TDOA), only one transmitter is necessary (i.e., antenna master); it requires multiple receivers to share the data and cooperate to determine the location of the transmitters. This cooperation needs significant bandwidth in comparison with other algorithms. TDOA, together with a time of arrival (TOA), offers higher accuracy than other algorithms because of the increased time resolution of the UWB signals. So, in this study, the TDOA algorithm was used to estimate positioning. S PROTM software (RealTrack Systems, Almeria, Spain) exports the data on the x and y position coordinates (Bastida-Castillo et al., 2019). The data were downloaded after the session.

Speed zones classification

The distance covered at high intensity and sprint describes the player's performance in steam sports. So, this new proposal is based on maximal velocity and divides intensities into different basic locomotor values such as walking, jogging, and running at low, moderate, high, and sprint intensities. In order to perform the intensity intervals, the mean maximum speed (MSpeedmax) and standard deviation (DSSpeedmax) were achieved by each player during the competition. Intervals were defined from the following data (see Figure 1) as: (1) Speedstanding-walking-jogging = 0 km/h to mSpeedmax - 3xDS Speedmax; (2) Speedlow- displacement = MSpeedmax - 3xDS Speedmax to MSpeedmax - 2xDS Speedmax; (3) Speedmoderate-displacement = MSpeedmax - 2xDS Speedmax to MSpeedmax - DS Speedmax; (4) Speedhigh-displacement = MSpeedmax - DS Speedmax to MSpeedmax; and (5) Sprints = MSpeedmax or more.

Figure 1 Speed categories intervals model 

Statistical Analysis

The normality of the data was verified with the Kolgomorov-Smirnov Exploratory Test. A one-way analysis of variance performed a quantitative inferential analysis of the data to verify the possible differences by periods in each variable, followed by Bonferroni post-hoc analysis if necessary. The effect size was calculated through omega partial squared and interpreted as <.01 insignificant, .01<.06 low, .06<0.14 moderate, >0.14 high (Cohen, 1988). Alpha was prior set at p <.05, and the Excel program was used for initial tabulation of data and SPSS (v22, IBM, Chicago, IL) for inferential and descriptive analyzes.

Results

After the analysis and consequently with previously cited authors, five speed categories were established for basketball following the methodology described above, as shown in Figure 2.

Figure 2 Speed categories in basketball. 

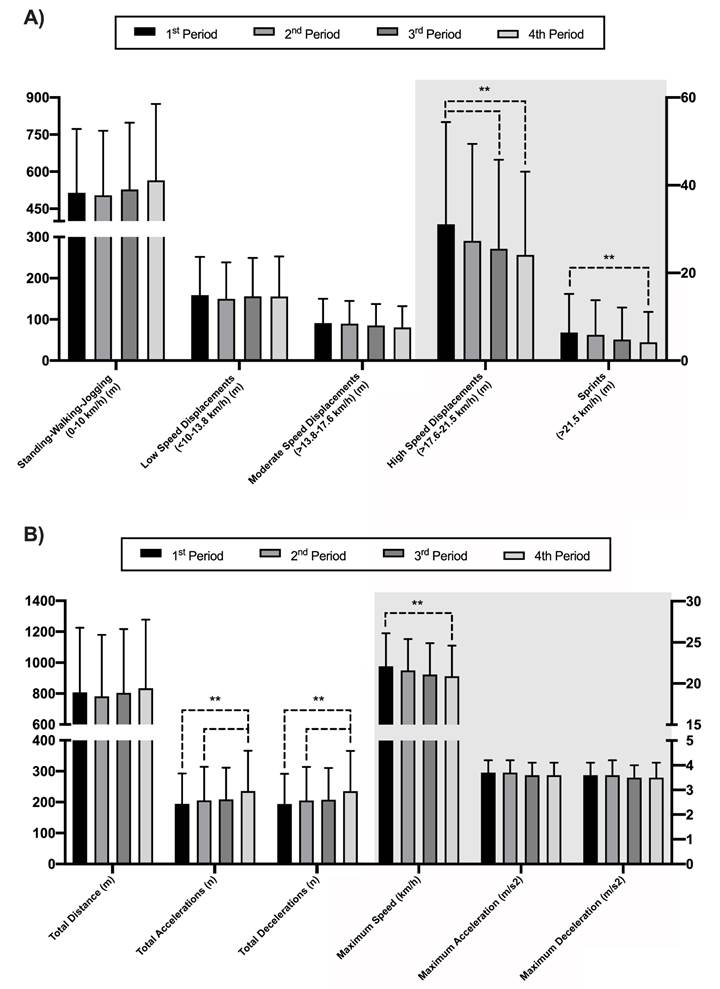
Figure 3A shows the comparative analysis of workload demands by periods in the proposed speed zones. Statistical differences were found in High-Speed Displacements (F= 4.67; p= .003; ω p 2 = .10 moderate) and Sprints (F= 3.81; p= .01; ω p 2 = .18 moderate). Specifically, the differences in High Speed displacements were found between periods 1st and 4th (p=.003) and 1st vs 3rd (p=.031), but not between 1st vs 2nd (p= .308), 2nd vs 3rd (p= 1.00), 2nd vs 4th (p= .593) or 3rd vs 4th (p= 1.00); and in Sprints between 1st and 4th (p= .015), but not between periods 1st vs 2nd (p= 1.00), 2nd vs 3rd (p= .857), 1st vs 3rd (p= .199), 2nd vs 4th (p= .103) or 3rd vs 4th (p= 1.00). Conversely, there were no significant differences between periods in Standing-Walking-Jogging (F= 2.10; p= .10), Low Speed Displacements (F= .38; p= .77) and Moderate Speed Displacements (F= 1.80; p= .15).

In addition, Figure 3B shows the comparative analysis of workload demands by periods in total distance, maximum speed, and changes of speed. Significant differences were found in maximum speed (F= 3.05; p= .03; ω p 2 = .05 low), total accelerations (F= 5.72; p< .001; ω p 2 = 0.12 moderate), and total decelerations (F=5.85; p< .001; ω p 2 = .13 moderate). Specifically, differences were found in maximum speed between the 1st and the 4th (p= 0.043); in total acceleration between 1st vs 4th (p< .01) and 2nd vs 4th (p= .02); and in total deceleration between 1st vs 4th (p< .01) and 2nd vs 4th (p= .018). There were no differences in maximum accelerations (F= 1.24; p= .29), maximum deceleration (F= .28; p= .84), and Total Distance (F= .61; p= .61).

**Significant differences between periods.

Figure 3 Differences in (A) Speed zones distance and (B) Total Distance, Maximum Speed, and Speed Changes by Periods. 

Discussion

Currently, the velocity thresholds of sport displacements have been defined by the companies that develop sport technology in their own software (Cunniffe et al., 2009), adapted from previous studies (Jennings et al., 2012) or determined by authors’ criteria (Mohr et al., 2003). The main problems are no consensus on how to determine a velocity threshold, the comparison of activity profiles across and within sports, and the lack of speed zones individualization considering the sports modality and the players’ level or sex (Sweeting et al., 2017). Given the challenges of assigning a specific velocity zone criterion for different populations, the purpose of the present study is to propose a speed zone interval criterion to use in team sports in order to allow a comparison and further general conclusions based on a consensus in speed zone definition, as well as to apply this method in basketball.

The two aspects that researchers have to consider in classifying the time-motion analysis related to speed are the number of speed zones and the speed threshold of each of them. The most extended time-motion analysis classification is composed of five groups (standing, walking, jogging, running, and sprinting) and was defined by movement characteristics evaluated by single observers (Bangsbo et al., 1991). From this classification, different studies proposed (a) speed two-speed zones with different thresholds in Australian football (Aughey, 2010), hockey (Jennings et al., 2012) and rugby league (Johnston et al., 2013); (b) three-speed zones (Clarke et al., 2015); (c) five-speed zones (Carling et al., 2012) or (d) six-speed zones in rugby (Suarez-Arrones et al., 2012), hockey (Macutkiewicz & Sunderland, 2011) or soccer (Gómez-Carmona et al., 2018). The difference between five- and six-speed zones is due to low-intensity displacements (standing and walking) being merged in one zone following two-speed zones classifications. Therefore, the proposed classification used five zones because the displacements in standing and walking zone are not important to sports performance in different team and individual sports like soccer (Oliva-Lozano et al., 2020), badminton (Rojas-Valverde, Gómez-Carmona, et al., 2020), or basketball (Pino-Ortega et al., 2020; Svilar et al., 2018).

In this sense, differences were only found in high-speed displacements, sprinting displacements, and maximum speed reached during the tournament. Physical performance related to the capacity to accelerate and sprint is important in sports performance. Numerous studies conducted on team sports have found a relationship between higher covered distance and higher time spent at high-intensity displacements and success in team sports such as soccer (Bradley et al., 2013; Miñano-Espin et al., 2017; Oliva-Lozano et al., 2021; Reche-Soto et al., 2019) or basketball.

Concerning the speed thresholds, no consensus in sports science literature was achieved. Generic velocity thresholds are universally administered in external load monitoring in sport contexts. But, the application of absolute versus individualized thresholds has been discussed in the literature (Hunter et al., 2015). In this sense, the current tendency is to individualize speed thresholds related to players’ and competition level and the sex of participants.

For this purpose, different methods have been proposed. Bradley & Vescovi (2015) recommended a speed threshold based upon fitness data reported in the literature with data collected in competition and training. Another alternative is the exploration of velocity zones through data-mining techniques. The first approach was achieved by Dwyer and Gabbett (2012) using GMMs. This method assumes that the data points are generated from a user-defined number of Gaussian distributions with unknown parameters. The problem is that no consider the sequential pattern of consecutive velocity data points and a limited number of observations typically associated with sprinting incorrectly assumes a Gaussian distribution, limiting their applications (Park et al., 2019).

Following data-mining techniques, Sweeting et al. (2017) applicated the k-means clustering for categorizing velocity. This technique operates iteratively to assign each observation to one of the k-specified clusters. Although, this method is also limited by the discreet way each velocity observation is treated. With this method, the velocity zones at high intensity are underestimated due to the low number of actions and displacements at high-velocities in competitive sports (Bradley et al., 2010; Carling et al., 2012; Meylan et al., 2017). Finally, the last proposal of data-mining techniques was the Spectral clustering algorithm, which generalizes to provide any number of partitions and is designed for discrete or categorical data. In this sense, Park et al. (2019) said: ''Spectral clustering was considered more appropriate for velocity data considering that the structure of the individual clusters (zones) is not suitably described by the center and dispersion of the complete data-set'' (p.6).

Finally, the disadvantages of all methods described are the difficult application to the sport context reality, the high level of statistical packages software management, and the large amount of data to determine these thresholds. Therefore, to solve the different drawbacks mentioned, a new method to calculate the speed threshold has been proposed, considering the underestimation of speed thresholds in the high-intensity actions (running and sprinting) and facilitating the team staff's calculation. For this reason, the maximum speed reached in the competition was utilized to calculate. This process makes the actualization of these values along the season and the calculation of the speed thresholds easier than other methods proposed in scientific literature.

However, team staff must treat speed zones with extreme caution since many contextual variables could influence these zones, such as the age, the category, the level of the competition, the experience or level of expertise, the playing style of your team and the opposing team, the playing position, sex, and even the performance of the players (individual and/or collective). (Mujika et al., 2018). Future research not only needs to consider contextual variables in speed zone threshold; other variables that influence the workload of the training sessions and official matches should be integrated, such as the degree of opposition, the density of the task, the number of players, the competitive load, the space, the tactical load, since we should not fall into a one-dimensional analysis, a bias that does not allow us to have a holistic view of the subject-object of study (Halouani et al., 2014; Impellizzeri et al., 2019).

Limitations

While the results of this study have provided a new proposal of speed zone interval criterion to use in team sports in order to allow comparison and further general conclusions based on a consensus in a speed zone, some limitations to the study must be acknowledged. One of the limitations in this research concerns the sample studied (94 youth basketball players in a 3-days congested fixture tournament), although it has been shown to be effective in detecting low and high intensity speed thresholds. In this sense, the application of this method to fix speed thresholds should be addressed in the future with other sports and competition levels to determine its accuracy. Despite this fact, the method proposed has considered the analysis of the previous values obtained in team sports (Barros et al., 2007; Datson et al., 2017; Di Salvo et al., 2007; Hunter et al., 2015; Park et al., 2019; Rampinini et al., 2007), with particular emphasis in maximum speed as a base value so as not to underestimate the load at a high intensity (Casamichana et al., 2018).

Conclusion/practical applications

Firstly, the present study adds a new method to analyze the distance covered in different speed zones through inertial devices in basketball. A categorization based on the maximum speed and their respective standard deviations is a useful method in order to have a more individualized criterion to be applied to a specific player, team, or sport. The present method avoids the bias of comparing players or teams in different conditions and different game dynamics and could be used in different sports such as basketball. For this reason, this method could be considered an alternative to individualize zones not only related to speed in the distance covered, other variables such as accelerations, decelerations, or impacts, among others, could be classified following it.

The use of distance covered at different intensities classified as speed zones is very relevant in sports performance. This variable indicates how the player displacements are performed during the game, at volume (total meters) and intensity (meters per zone). The distribution of meters in each speed zone should be considered to design training sessions, plan workload during microcycles and macrocycles, and control the acute and chronic fatigue of the players throughout the season to improve sports performance and reduce the injury risk. Therefore, individualizing these speed zones per player and team is necessary to achieve the desired effect with the planned stimuli.

Funding: The authors Carlos D. Gómez Carmona was supported by a grant from the Spanish Ministry of Education, Culture, and Sport (FPU17/00407). This research has not received specific financial support.

Conflict of Interest Disclosure: The authors declare that the research was conducted without any commercial or financial relationships that could be construed as a potential conflict of interest. This manuscript is original and not previously published, nor is it being considered elsewhere until a decision is made as to its acceptability by the journal.

Acknowledgments:

The authors would like to thank all the participants and tournament managers for permitting them to take part in this research.

References

Aguiar, M., Botelho, G., Gonçalves, B., & Sampaio, J. (2013). Physiological Responses and Activity Profiles of Football Small-Sided Games. Journal of Strength and Conditioning Research, 27(5), 1287-1294. https://doi.org/10.1519/JSC.0b013e318267a35c [ Links ]

Akenhead, R., Harley, J., & Tweddle, S. (2016). Examining the External Training Load of an English Premier League Football Team With Special Reference to Acceleration. Journal of Strength and Conditioning Research, 30(9), 2424-2432. https://doi.org/10.1519/JSC.0000000000001343 [ Links ]

Akenhead, R., & Nassis, G. (2016). Training Load and Player Monitoring in High-Level Football: Current Practice and Perceptions. International Journal of Sports Physiology and Performance, 11(5), 587-593. https://doi.org/10.1123/ijspp.2015-0331 [ Links ]

Alarifi, A., Al-Salman, A., Alsaleh, M., Alnafessah, A., Al-Hadhrami, S., Al-Ammar, M., & Al-Khalifa, H. (2016). Ultra Wideband Indoor Positioning Technologies: Analysis and Recent Advances. Sensors, 16(5), 707. https://doi.org/10.3390/s16050707 [ Links ]

Aughey, R. (2010). Australian football player work rate: Evidence of fatigue and pacing? International Journal of Sports Physiology and Performance, 5(3), 394-405. https://doi.org/10.1123/ijspp.5.3.394 [ Links ]

Bangsbo, J., Nørregaard, L., & Thorsø, F. (1991). Activity profile of competition soccer. Canadian Journal of Sport Sciences = Journal Canadien Des Sciences Du Sport, 16(2), 110-116. https://pubmed.ncbi.nlm.nih.gov/1647856/Links ]

Barros, R. M., Misuta, M. S., Menezes, R. P., Figueroa, P. J., Moura, F. A., Cunha, S. A., Anido, R., & Leite, N. J. (2007). Analysis of the distances covered by first division Brazilian soccer players obtained with an automatic tracking method. Journal of Sports Science & Medicine, 6(2), 233-242. https://www.ncbi.nlm.nih.gov/pubmed/24149334Links ]

Bastida-Castillo, A., Gómez-Carmona, C., De la Cruz Sánchez, E., & Pino-Ortega, J. (2018). Accuracy, intra- and inter-unit reliability, and comparison between GPS and UWB-based position-tracking systems used for time-motion analyses in soccer. European Journal of Sport Science, 18(4), 450-457. https://doi.org/10.1080/17461391.2018.1427796 [ Links ]

Bastida-Castillo, A., Gómez-Carmona, C., Pino-Ortega, J., & de la Cruz Sánchez, E. (2017). Validity of an inertial system to measure sprint time and sport task time: A proposal for the integration of photocells in an inertial system. International Journal of Performance Analysis in Sport, 17(4), 600-608. https://doi.org/10.1080/24748668.2017.1374633 [ Links ]

Bastida-Castillo, A., Gómez-Carmona, C., De la Cruz-Sánchez, E., Reche-Royo, X., Ibáñez, S., & Pino Ortega, J. (2019). Accuracy and Inter-Unit Reliability of Ultra-Wide-Band Tracking System in Indoor Exercise. Applied Sciences, 9(5), 939. https://doi.org/10.3390/app9050939 [ Links ]

Bradley, P., Di Mascio, M., Peart, D., Olsen, P., & Sheldon, B. (2010). High-intensity activity profiles of elite soccer players at different performance levels. Journal of Strength and Conditioning Research, 24(9), 2343-2351. https://doi.org/10.1519/JSC.0b013e3181aeb1b3 [ Links ]

Bradley, P., Lago-Peñas, C., Rey, E., & Gomez, A. (2013). The effect of high and low percentage ball possession on physical and technical profiles in English FA Premier League soccer matches. Journal of Sports Sciences, 31(12), 1261-1270. https://doi.org/10.1080/02640414.2013.786185 [ Links ]

Bradley, P., & Vescovi, J. (2015). Velocity thresholds for women’s soccer matches: Sex specificity dictates high-speed running and sprinting thresholds - Female Athletes in Motion (FAiM). International Journal of Sports Physiology and Performance, 10(1), 112-116. https://doi.org/10.1123/ijspp.2014-0212 [ Links ]

Carling, C., Le Gall, F., & Dupont, G. (2012). Analysis of repeated high-intensity running performance in professional soccer. Journal of Sports Sciences, 30(4), 325-336. https://doi.org/10.1080/02640414.2011.652655 [ Links ]

Casamichana, D., Morencos, E., Romero-Moraleda, B., & Gabbett, T. (2018). The Use of Generic and Individual Speed Thresholds for Assessing the Competitive Demands of Field Hockey. Journal of Sports Science & Medicine, 17(3), 366-371. https://www.ncbi.nlm.nih.gov/pubmed/30116109Links ]

Clarke, A., Anson, J., & Pyne, D. (2015). Physiologically based GPS speed zones for evaluating running demands in Women’s Rugby Sevens. Journal of Sports Sciences, 33(11), 1101-1108. https://doi.org/10.1080/02640414.2014.988740 [ Links ]

Clemente, F., Nikolaidis, P., Van Der Linden, C. & Silva, B. (2017). Effects of Small-Sided Soccer Games on Internal and External Load and Lower Limb Power: A Pilot Study in Collegiate Players. Human Movement, 18(1), 50-57. https://doi.org/10.1515/humo-2017-0007 [ Links ]

Cohen, J. (1988). Statistical power analysis for the behavioral sciences (2nd ed.). Erlbaum. [ Links ]

Coutinho, D., Gonçalves, B., Figueira, B., Abade, E., Marcelino, R., & Sampaio, J. (2015). Typical weekly workload of under 15, under 17, and under 19 elite Portuguese football players. Journal of Sports Sciences, 33(12), 1229-1237. https://doi.org/10.1080/02640414.2015.1022575 [ Links ]

Cunniffe, B., Proctor, W., Baker, J., & Davies, B. (2009). An evaluation of the physiological demands of elite rugby union using global positioning system tracking software. The Journal of Strength & Conditioning Research, 23(4), 1195-1203. https://doi.org/10.1519/jsc.0b013e3181a3928b [ Links ]

Datson, N., Drust, B., Weston, M., Jarman, I., Lisboa, P., & Gregson, W. (2017). Match Physical Performance of Elite Female Soccer Players During International Competition. Journal of Strength and Conditioning Research, 31(9), 2379-2387. https://doi.org/10.1519/JSC.0000000000001575 [ Links ]

De Oliveira, M., Caetano, F., Pereira, T., De Souza, N., Moreira, G., Nakamura, F., Cunha, S., & Moura, F. (2014). Analysis of the distance covered by Brazilian professional futsal players during official matches. Sports Biomechanics, 13(3), 230-240. https://doi.org/10.1080/14763141.2014.958872 [ Links ]

Di Salvo, V., Baron, R., Tschan, H., Calderon Montero, F., Bachl, N., & Pigozzi, F. (2007). Performance Characteristics According to Playing Position in Elite Soccer. International Journal of Sports Medicine, 28(3), 222-227. https://doi.org/10.1055/s-2006-924294 [ Links ]

Dwyer, D., & Gabbett, T. (2012). Global positioning system data analysis: Velocity ranges and a new definition of sprinting for field sport athletes. Journal of Strength and Conditioning Research, 26(3), 818-824. https://doi.org/10.1519/JSC.0b013e3182276555 [ Links ]

Fessi, M., Zarrouk, N., Di Salvo, V., Filetti, C., Barker, A., & Moala, W. (2016). Effects of tapering on physical match activities in professional soccer players. Journal of Sports Sciences, 34(24), 2189-2194. https://doi.org/10.1080/02640414.2016.1171891 [ Links ]

Garrett, J., Gunn, R., Eston, R., Jakeman, J., Burgess, D & Norton, K. (2019). The effects of fatigue on the running profile of elite team sport athletes. A systematic review and meta-analysis. The Journal of Sports Medicine and Physical Fitness, 59(8),1328-1338. https://doi.org/10.23736/S0022-4707.19.09356-3. [ Links ]

Gómez-Carmona, C., Gamonales, J., Pino-Ortega, J., & Ibáñez, S. (2018). Comparative analysis of load profile between small-sided games and official matches in youth soccer players. Sports, 6(4), 173. https://doi.org/10.3390/sports6040173 [ Links ]

Gómez-Carmona, C., Bastida-Castillo, A., García-Rubio, J., Ibáñez, S. J., & Pino-Ortega, J. (2019). Static and dynamic reliability of WIMU PROTM accelerometers according to anatomical placement. Proceedings of the Institution of Mechanical Engineers, Part P: Journal of Sports Engineering and Technology, 233(2), 238-248. https://doi.org/10.1177/1754337118816922 [ Links ]

Gómez-Carmona, C., Bastida-Castillo, A., Ibáñez, S., & Pino-Ortega, J. (2020). Accelerometry as a method for external workload monitoring in invasion team sports. A systematic review. PLoS ONE, 15(8), e0236643. https://doi.org/10.1371/journal.pone.0236643 [ Links ]

Greig, M., Emmerson, H., & McCreadie, J. (2019). Quantifying Functional Ankle Rehabilitation Progression Criteria Using GPS: A Preliminary Study. Journal of Sport Rehabilitation,28(7), 729-734. https://doi.org/10.1123/jsr.2018-0045 [ Links ]

Halouani, J., Chtourou, H., Gabbett, T., Chaouachi, A., & Chamari, K. (2014). Small-Sided Games in Team Sports Training: A Brief Review. Journal of Strength and Conditioning Research, 28(12), 3594-3618. https://doi.org/10.1519/JSC.0000000000000564 [ Links ]

Hunter, F., Bray, J., Towlson, C., Smith, M., Barrett, S., Madden, J., Abt, G., & Lovell, R. (2015). Individualisation of time-motion analysis: A method comparison and case report series. International Journal of Sports Medicine, 36(1), 41-48. https://doi.org/10.1055/s-0034-1384547 [ Links ]

Impellizzeri, F., Marcora, S., & Coutts, A. (2019). Internal and External Training Load: 15 Years On. International Journal of Sports Physiology and Performance, 14(2), 270-273. https://doi.org/10.1123/ijspp.2018-0935 [ Links ]

Jaspers, A., Brink, M., Probst, S., Frencken, W., & Helsen, W. (2017). Relationships Between Training Load Indicators and Training Outcomes in Professional Soccer. Sports Medicine, 47(3), 533-544. https://doi.org/10.1007/s40279-016-0591-0 [ Links ]

Jennings, D., Cormack, S., Coutts, A., & Aughey, R. (2012). GPS Analysis of an International Field Hockey Tournament. International Journal of Sports Physiology and Performance, 7(3), 224-231. https://doi.org/10.1123/ijspp.7.3.224 [ Links ]

Jeong, T., Reilly, T., Morton, J., Bae, S., & Drust, B. (2011). Quantification of the physiological loading of one week of ''pre-season'' and one week of ''in-season'' training in professional soccer players. Journal of Sports Sciences, 29(11), 1161-1166. https://doi.org/10.1080/02640414.2011.583671 [ Links ]

Johnston, R., Gibson, N., Twist, C., Gabbett, T., MacNay, S., & MacFarlane, N. (2013). Physiological responses to an intensified period of rugby league competition. Journal of Strength and Conditioning Research, 27(3), 643-654. https://doi.org/10.1519/JSC.0b013e31825bb469 [ Links ]

Luteberget, L., Spencer, M., & Gilgien, M. (2018). Validity of the Catapult ClearSky T6 Local Positioning System for Team Sports Specific Drills, in Indoor Conditions. Frontiers in Physiology, 9, 115. https://doi.org/10.3389/fphys.2018.00115 [ Links ]

Macutkiewicz, D., & Sunderland, C. (2011). The use of GPS to evaluate activity profiles of elite women hockey players during match-play. Journal of Sports Sciences, 29(9), 967-973. https://doi.org/10.1080/02640414.2011.570774 [ Links ]

Makaje, N., Ruangthai, R., Arkarapanthu, A., & Yoopat, P. (2012). Physiological demands and activity profiles during futsal match play according to competitive level. The Journal of Sports Medicine and Physical Fitness, 52(4), 366-374. [ Links ]

Malone, J., Di Michele, R., Morgans, R., Burgess, D., Morton, J., & Drust, B. (2015). Seasonal training-load quantification in elite English premier league soccer players. International Journal of Sports Physiology and Performance, 10(4), 489-497. https://doi.org/10.1123/ijspp.2014-0352 [ Links ]

Malone, S., Owen, A., Mendes, B., Hughes, B., Collins, K., & Gabbett, T. (2018). High-speed running and sprinting as an injury risk factor in soccer: Can well-developed physical qualities reduce the risk? Journal of Science and Medicine in Sport, 21(3), 257-262. https://doi.org/10.1016/j.jsams.2017.05.016 [ Links ]

Meylan, C., Trewin, J., & McKean, K. (2017). Quantifying Explosive Actions in International Women’s Soccer. International Journal of Sports Physiology and Performance, 12(3), 310-315. https://doi.org/10.1123/ijspp.2015-0520 [ Links ]

Miñano-Espin, J., Casáis, L., Lago-Peñas, C., & Gómez-Ruano, M. (2017). High Speed Running and Sprinting Profiles of Elite Soccer Players. Journal of Human Kinetics, 58(1), 169-176. https://doi.org/10.1515/hukin-2017-0086 [ Links ]

Mohr, M., Krustrup, P., & Bangsbo, J. (2003). Match performance of high-standard soccer players with special reference to development of fatigue. Journal of Sports Sciences, 21(7), 519-528. https://doi.org/10.1080/0264041031000071182 [ Links ]

Mujika, I., Halson, S., Burke, L., Balagué, G., & Farrow, D. (2018). An Integrated, Multifactorial Approach to Periodization for Optimal Performance in Individual and Team Sports. International Journal of Sports Physiology and Performance, 13(5), 538-561. https://doi.org/10.1123/ijspp.2018-0093 [ Links ]

Naser, N., Ali, A., & Macadam, P. (2017). Physical and physiological demands of futsal. Journal of Exercise Science & Fitness, 15(2), 76-80. https://doi.org/10.1016/j.jesf.2017.09.001 [ Links ]

Oliva-Lozano, J., Rojas-Valverde, D., Gómez-Carmona, C., Fortes, V., & Pino-Ortega, J. (2021). Impact of contextual variables on the representative external load profile of Spanish professional soccer match-play: A full season study. European Journal of Sport Science, 21(4), 497-506. https://doi.org/10.1080/17461391.2020.1751305 [ Links ]

Park, L., Scott, D., & Lovell, R. (2019). Velocity zone classification in elite women’s football: Where do we draw the lines? Science and Medicine in Football, 3(1), 21-28. https://doi.org/10.1080/24733938.2018.1517947 [ Links ]

Parlebas, P. (2002). Elementary mathematic modelization of games and sports. In Frank, R (Ed.), The Explanatory Power of Models (pp. 197-228). Kluwer Academic. [ Links ]

Pino-Ortega, J., Gómez-Carmona, C., Nakamura, F., & Rojas-Valverde, D. (2020). Setting Kinematic Parameters That Explain Youth Basketball Behavior: Influence of Relative Age Effect According to Playing Position. Journal of Strength & Conditioning Research, 36(3), 820-826. https://doi.org/10.1519/jsc.0000000000003543 [ Links ]

Pino-Ortega, J., Rojas-Valverde, D., Gómez-Carmona, C., Bastida-Castillo, A., Hernández-Belmonte, A., García-Rubio, J., Nakamura, F., & Ibáñez, S. (2019). Impact of Contextual Factors on External Load During a Congested-Fixture Tournament in Elite U’18 Basketball Players. Frontiers in Psychology, 10, 1100. https://doi.org/10.3389/fpsyg.2019.01100 [ Links ]

Rampinini, E., Coutts, A., Castagna, C., Sassi, R., & Impellizzeri, F. (2007). Variation in Top Level Soccer Match Performance. International Journal of Sports Medicine, 28(12), 1018-1024. https://doi.org/10.1055/s-2007-965158 [ Links ]

Randers, M., Nielsen, J., Bangsbo, J, & Krustrup, P. (2014). Physiological response and activity profile in recreational small-sided football: No effect of the number of players. Scandinavian Journal of Medicine & Science in Sports, 24(1), 130-137. https://doi.org/10.1111/sms.12232 [ Links ]

Reche-Soto, P., Cardona-Nieto, D., Diaz-Suarez, A., Bastida-Castillo, A., Gomez-Carmona, C., Garcia-Rubio, J., & Pino-Ortega, J. (2019). Player Load and Metabolic Power Dynamics as Load Quantifiers in Soccer. Journal of Human Kinetics, 69(1), 259-269. https://sciendo.com/doi/10.2478/hukin-2018-0072Links ]

Reina-Román, M., García-Rubio, J., Feu, S., & Ibáñez, S. (2019). Training and Competition Load Monitoring and Analysis of Women’s Amateur Basketball by Playing Position: Approach Study. Frontiers in Psychology, 9, 2689. https://doi.org/10.3389/fpsyg.2018.02689 [ Links ]

Rojas-Valverde, D., Gómez-Carmona, C., Fernández-Fernández, J., García-López, J., García-Tormo, V., Cabello-Manrique, D., & Pino-Ortega, J. (2020). Identification of games and sex-related activity profile in junior international badminton. International Journal of Performance Analysis in Sport, 20(3), 323-338. https://doi.org/10.1080/24748668.2020.1745045 [ Links ]

Rojas-Valverde, D., Gómez-Carmona, C., Gutiérrez-Vargas, R., & Pino-Ortega, J. (2019). From big data mining to technical sport reports: The case of inertial measurement units. BMJ Open Sport & Exercise Medicine, 5(1), e000565. https://doi.org/10.1136/bmjsem-2019-000565 [ Links ]

Rojas-Valverde, D., Pino-Ortega, J., Gómez-Carmona, C., & Rico-González, M. (2020). A Systematic Review of Methods and Criteria Standard Proposal for the Use of Principal Component Analysis in Team’s Sports Science. International Journal of Environmental Research and Public Health, 17(23), 8712. https://doi.org/10.3390/ijerph17238712 [ Links ]

Sampaio, J., Gonçalves, B., Rentero, L., Abrantes, C., & Leite, N. (2014). Exploring how basketball players’ tactical performances can be affected by activity workload. Science & Sports, 29(4), e23-e30. https://doi.org/10.1016/j.scispo.2013.05.004 [ Links ]

Suarez-Arrones, L., Nuñez, F., Portillo, J., & Mendez-Villanueva, A. (2012). Running Demands and Heart Rate Responses in Men Rugby Sevens. Journal of Strength and Conditioning Research, 26(11), 3155-3159. https://doi.org/10.1519/JSC.0b013e318243fff7 [ Links ]

Svilar, L., Castellano, J., Jukic, I., & Casamichana, D. (2018). Positional Differences in Elite Basketball: Selecting Appropriate Training-Load Measures. International Journal of Sports Physiology and Performance, 13(7), 947-952. https://doi.org/10.1123/ijspp.2017-0534 [ Links ]

Sweeting, A., Cormack, S., Morgan, S., & Aughey, R. (2017). When Is a Sprint a Sprint? A Review of the Analysis of Team-Sport Athlete Activity Profile. Frontiers in Physiology, 8, 432. https://doi.org/10.3389/fphys.2017.00432 [ Links ]

Vázquez-Guerrero, J., Fernández-Valdés, B., Jones, B., Moras, G., Reche, X., & Sampaio, J. (2019). Changes in physical demands between game quarters of U18 elite official basketball games. PLoS One, 14(9), e0221818. https://doi.org/10.1371/journal.pone.0221818 [ Links ]

Received: September 21, 2020; Accepted: October 22, 2021

Creative Commons License This is an open-access article distributed under the terms of the Creative Commons Attribution License