


 Español (pdf)
 Articulo en XML
 Referencias del artículo
 Enviar articulo por email
 Citado por SciELO
  Similares en
SciELO
Similares en
SciELO 
 Permalink
Introduction
Anthropometric, physiological, and physical fitness assessments aim to give an approximation to the physical state of the human health, providing inputs to detect, at an early stage, risk factors for non-transmissible chronic diseases at a cardiovascular and metabolic level (Ahmad, Raham, Zaman, & Jan, 2011; Chuang et al., 2012; Espinoza-Navarro, Brito-Hernández, & Lagos-Olivos, 2020).
Among the most used anthropometric protocols are the body mass index (BMI), which establishes the relationship between body weight and height, a tool used globally to identify overweight and obesity levels. The body fat percentage (BFP) and waist circumference (WC) are indicators of the amount and distribution of adipose tissue in the body (Liu, Ma, Lou & Liu, 2013; Michelotto, Martins, Machado, Santos, & Carvalho, 2010; Ranasinghe et al., 2013; Padilla, 2014).
The reported values of body mass index categorized as healthy ranged from 18 to 25 kg/m2 and, as unhealthy, exceeded 26 kg/m2. Healthy values of fat percentage reported were between 13% and 33%, and the unhealthy ones corresponded to values above 34%. For the waist circumference, the parameters reported as healthy corresponded to values below 80 cm for women and 102 cm for men (Corvos-Hidalgo & Corvos-Hidalgo 2013; Cossio-Bolaños et al. 2011, Fedewa, Nickerson, & Esco, 2019; Rivera-Cabezas & Ureña-Bonilla, 2014; Rodríguez-Montero, Ureña-Bonilla, Blanco-Romero, Sánchez-Ureña & Salas-Cabrera, 2014).
Physiological indicators are systolic (SBP) and diastolic (DBP) blood pressure, which are used to assess the cardiovascular condition of people (Beaney et al., 2018; Castillo, Chávez, Fernández, Alfonzo & Alfonzo, 2011). Authors like Campos-Nonato et al. (2013) and Restrepo, Agudelo, Conde & Pradilla (2012) evaluated SBP and DBP in young adults. Instead, Škrkar, Mikalack, Cokorilo & Eric (2015) assessed groups of women, generally reporting in the previous studies that unhealthy parameters corresponded to values higher than 130 mm/hg in SBP and higher than 90 mm/hg in DBP, these being related to symptoms of prehypertension and arterial hypertension (Beaney et al., 2018; Tejedo, 2010).
The physiological responses of the organism are related to the anthropometric indicators since overweight and unhealthy parameters in body fat percentage and waist circumference had high blood pressure values, considered as pre-hypertension or arterial hypertension because the body fat is lodged in the arteries creating peripheral resistance (Ahmad et al., 2011; Arteagal et al., 2010; Castillo et al., 2011; Christofaro et al., 2011; Santos, Petroski, & Peres, 2012; Urrea, 2018; Wang et al., 2020).
Similarly, a good physical condition, mainly at the muscular level, is also an indicator of people’s health (García-Soidán & Alonso-Fernandez, 2011). The most used physical qualities to assess the levels of physical fitness are flexibility, strength, and muscular endurance; this is because studies show that performance categorized as healthy, in physical fitness protocols, tends to be related to healthy parameters in variables of body composition and cardiovascular level (Dunsky et al., 2013; Esco, Olson, & Williford, 2008; Silva-Batista, Urso, Silva, & Bertuzzi, 2013; Vaara et al., 2012). In this matter, interventions performed to assess levels of hip and leg flexibility at the ischemic level stand out in the university student population (Benavent, Tella, González-Millan & Colado, 2008; Ramos, Alzate, Ayala, Franco & Sánchez, 2009) and in adult men and women (Delgado, Martín, Zurita, Antequera & Fernández, 2009; García & Aznar, 2011). Likewise, evaluations of the strength and muscular resistance, performed in populations of young adults, have reported lower values than those required to be considered healthy in both men and women according to international parameters in tests of push-ups and abdominal resistance (Zaragoza, Serrano, & Generelo, 2004).
Sex and age are variables to be taken into account for their influence on the physiological, anthropometric, and physical fitness variables. In relation to sex, it have been observed differences between men and women in the accumulation and distribution of body fat (Michelotto et al., 2010; Cossio-Bolaños et al., 2011; Piernas, Hernández, Canteras, Zamora & Garaulet, 2008; Rodríguez et al., 2014; Rojas-Valverde et al, 2016), as well as in the physical aptitudes (Benavent et al., 2008; Delgado et al., 2009; Vaquero, González, Ros & Alacid, 2012; García-Soidán & Alonso-Fernández, 2011; Zaragoza et al., 2004). In the case of age, the processes of aging affect the functionality of the organism. It has been reported that younger people more frequently show values considered as healthy in the anthropometric (Rivera-Cabezas & Ureña-Bonilla, 2014; Rodríguez-Montero et al., 2014) and physiological variables (Campos-Nonato et al., 2013; Škrkar et al., 2015). In contrast, in physical qualities, age causes a decrease in performance as it increases (Vaquero et al., 2012; Zaragoza et al., 2004).
Regarding the Central America area, only in Costa Rica, some descriptive studies were identified that have evaluated anthropometric variables in different populations. In this sense, evaluations for health and the physical aptitude have been made in the business world (Rodríguez-Montero et al., 2014), in adults attending physical fitness centers (Rivera-Cabezas & Ureña-Bonilla, 2014), and in a recreation center (Rojas-Valverde et al., 2016). More recently, Rivera, Ureña, Fernández, Quesada, & Gómez (2017) reported evaluations with populations from a university campus. Therefore, based on the evidence provided in the scientific literature, and on the fact that there is not much information either on the anthropometric profiles of adults in Costa Rica or on populations that attend swimming programs, this study aims to evaluate anthropometric, physiological, and physical fitness variables in 158 participants enrolled in a swimming program. The study compares the variables with international parameters that will serve as indicators of the population’s general health status, according to sex and age, providing information that will be useful to know the state of health of people who decide to attend a swimming program.
Methodology
This study used a transversal, comparative, and correlational design.
Participants
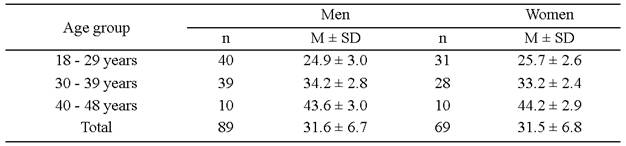
There were 158 participants, 89 men and 69 women (31.5 ± 6.7 years), selected by convenience and distributed in three age groups, which can be observed in Table 1, following the American College of Sport Medicine (2014) categorization. Participants were evaluated at the time of entry into the Swimming for Health Promotion project (Natación para la Promoción de la Salud, NAPROSA), of the Escuela de Ciencias del Movimiento Humano y Calidad de Vida (School of Human Movement Sciences and Quality of Life), at the Universidad Nacional of Costa Rica. Participants were evaluated before starting swimming lessons; this was part of swimming project requirements. The following criteria were considered to select the sample:
a) they had to be over 18 years of age;
b) they did not present any type of motor or cognitive disability;
c) women were not pregnant.
All participants signed an informed consent following the Helsinki Declaration for human research, which explained the purpose of the measurements and the protocols to be used.
Instruments
For the evaluation of the anthropometric and body composition, we used a bioimpedance analysis by InBody 370, model JMW140 (Chungcheongnam-do, South Korea), to determine the body weight, BMI, and BFP, with a level of precision of 98%. Besides, we used a stadiometer (SECA, Hamburg, Germany) to obtain the stature with an accuracy of ± 1mm, and a measuring tape to measure the WC with a precision of ± 1mm. To obtain the data of the physiological variables, specifically the systolic and diastolic blood pressure, an automatic sphygmomanometer (e-sphyg TM2-American Diagnostic Corporation, New York, USA) was used. For the evaluation of physical fitness, the Sit and Reach test was used to evaluate the level of flexibility and the push-up test to evaluate muscular endurance, following the evaluation guidelines published by the American College of Sports Medicine (2014).
Procedure
Each participant had to be evaluated to enter the project; after this, the participants started with the swimming lessons. Each one of them underwent anthropometric evaluations (weight, BMI, BFP, and WC), as well as physiological (SBP and DBP) and physical fitness (flexibility, strength, and muscular strength) examinations. All these evaluations were made in facilities set up with equipment.
For the evaluation, each participant was asked to sit in a chair and to remain at rest for five minutes to measure the blood pressure (SBP and DBP) in the right arm, programming the automatic sphygmomanometer at 220 mm/hg for men and 180 mm/hg for women, with a precision of ±3 mm/Hg. Next, each participant’s height was measured in centimeters. After that, the person proceeded to climb the InBody to perform the bioimpedance analysis from which the weight, BMI, and BFP were obtained. Before each evaluation, all equipment was calibrated. Subsequently, the WC was measured by placing the measuring tape on the upper lateral edge of the hip’s crest. Finally, the participants performed the sit and reach flexibility test and, finally, the push-up test.
Data from the measurements performed to the participants, considering sex and age, were rated as healthy or unhealthy according to the parameters of the American College of Sports Medicine (2014). Values higher than the limits considered as good or normal for each of the variables were deemed as unhealthy data.
Statistical analysis
Descriptive analyzes were performed to obtain the averages, standard deviations, and percentages of each variable. Levene tests were conducted for homogeneity of variances. The Chi-square test was performed to determine the relationship between health status (healthy and unhealthy) with sex and age. The factorial ANOVA 2 (sex) x 3 (age group) was used to determine differences between groups for each dependent variable, in addition to a Bonferroni Post Hoc adjustment test for multiple comparisons to find the differences between the age groups. Pearson correlations were also performed to determine the relationships between the variables. Cohen's effect size (ES) was calculated for significant cases. When ES < .2 is small, .5 is moderate, and > .8 is large. The Statistical Package for Social Sciences (SPSS) (IBM, SPSS Statistics, 18.0 V. Chicago, IL, USA) was used. The significance level used was p< .050.
Results
In Table 2, the number of people who presented an unhealthy condition for each variable is shown in percentage. Chi-square inferential analysis showed a statistically significant relationship between participants’ health condition and sex in the percentage of body fat (x 2 =9.21; p= .002), the percentage of women with unhealthy conditions being higher than men. In the flexibility (x 2 = 4.50; p= .034), the percentage of people who presented an unhealthy condition was greater in men than in women.
In relation to the age groups in Table 3, we can observe statistically significant relationships in the body mass index (x 2 = 19.5; p= .000) and waist circumference (x 2 = 13.7; p= .000), showing the percentage of unhealthy people increases owing to age. As for the number of repetitions performed in the push-ups test, the percentage of people in an unhealthy condition decreased among the oldest age groups (x 2 = 8.60; p= .013).
Table 2 Percentage of people assessed who were in a healthy and unhealthy condition and Chi-square test for each variable by sex
| Variables | Health Condition | Men (n=89) | Women (n=69) | X 2 (p value) |
|---|---|---|---|---|
| SBP (mm/hg) | H % | 85.4 | 94.2 | 3.14 (.076) |
| NH % | 14.6 | 5.8 | ||
| DBP (mm/hg) | H % | 85.4 | 94.2 | 3.14 (.076) |
| NH % | 14.6 | 5.8 | ||
| BMI (Kg/m2) | H % | 43.8 | 58.0 | 3.11 (.078) |
| NH % | 56.2 | 42.0 | ||
| BFP (%) | H % | 25.8 | 7.2 | 9.21 (.002)* |
| NH % | 74.2 | 92.8 | ||
| WC (cm) | H % | 89.9 | 82.6 | 1.78 (.181) |
| NH % | 10.1 | 17.4 | ||
| FLEX (cm) | H % | 59.4 | 75.3 | 4.50 (.034)* |
| NH % | 40.6 | 24.7 | ||
| ME (quantity) | H % | 60.7 | 62.3 | .044 (.833) |
| NH % | 39.3 | 37.7 |
Note: M= men; W= women; H= healthy; N H= unhealthy; SBP= systolic blood pressure; DBP= diastolic blood pressure; BMI= body mass index; BFP= body fat percentage; WC= waist circumference; FLEX= flexibility; ME= muscular endurance. *p˂ .050/ **p˂ .001
Table 3 Percentage of people assessed who were in a healthy and unhealthy condition and Chi-square test for each variable according to their age group.
| Variables | Health Condition | 18 - 29 years (n=71) | 30 - 39 years (n=67) | 40 - 48 years (n=20) | X2 (p value) |
|---|---|---|---|---|---|
| SBP (mm/hg) | H % | 93 | 85.1 | 90 | 2.24 (.326) |
| NH % | 7 | 14.9 | 10 | ||
| DBP (mm/hg) | H % | 93 | 85.1 | 90 | 2.24 (.326) |
| NH % | 7 | 14.9 | 10 | ||
| BMI (Kg/m2) | H % | 69 | 37.3 | 25 | 19.5 (.000)** |
| NH % | 31 | 62.7 | 75 | ||
| BFP (%) | H % | 12.7 | 23.9 | 15 | 3.08 (.214) |
| NH % | 87.3 | 76.1 | 85 | ||
| WC (cm) | H % | 97.2 | 80.6 | 70 | 13.7 (.000)** |
| NH % | 2.8 | 19.4 | 30 | ||
| FLEX (cm) | H % | 69 | 65.7 | 75 | .646 (.724) |
| NH % | 31 | 34.3 | 25 | ||
| ME (quantity) | H % | 50.7 | 65.7 | 85 | 8.60 (.013)* |
| NH % | 49.3 | 34.3 | 15 |
Note: M= men; W= women; H= healthy; N H= unhealthy; SBP= systolic blood pressure; DBP= diastolic blood pressure; BMI= body mass index; BFP= body fat percentage; WC= waist circumference; FLEX= flexibility; ME= muscular endurance, *p˂ .050/ **p˂ .001
Analysis of factorial ANOVAs showed no significant interactions in any of the variables analyzed. However, Table 4 shows significant differences between men and women in systolic blood pressure (F (5,152)= 8.69; p= .004) and diastolic (F (5,152)= 13.19; p=.000), on waist circumference (F (5,152)= 19.6; p= .000), and in muscular endurance (F (5,152)= 15.3; p= .000), in which men presented higher averages than women. Women showed a higher mean percentage of body fat compared to men (F (5,152)= 60.70; p= .000). There were no significant differences in body mass index and flexibility.
Table 4 Descriptive and inferential data of the variables for men and women.
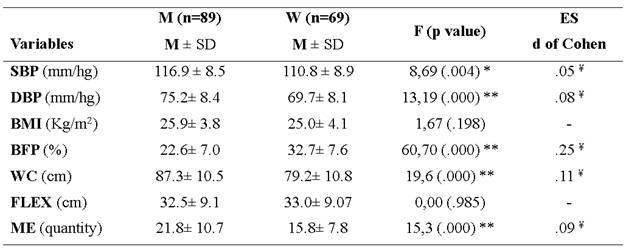
Note: M= men; W= women; SBP= systolic blood pressure; DBP= diastolic blood pressure; BMI= body mass index; BFP= body fat percentage; WC= waist circumference; FLEX= flexibility; ME= muscular endurance; ES= effect size, *p˂.050/ **p˂.001, ¥ small effect size
As for the age groups in which the participants were bunch together, Table 5 shows the significant differences in body mass index (F (5,152)= 12.6; p= .000), the fat percentage (F (5,152)= 5.56; p=.004), and the waist circumference (F (5,152)= 15.5; p= .000). The Bonferroni Post-Hoc follow-up test of simple effects found the significant differences between the 18-29 age group with respect to the 30-39 and 40-48 age groups for all three variables. There was also a decrease in the older age groups in the mean of flexibility, although not significantly.
Table 5 Descriptive and inferential data of the variables for the age groups.
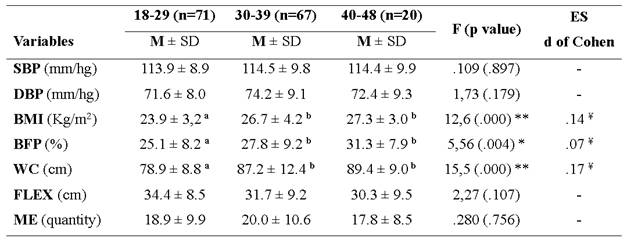
Note: M= men; W= women; SBP= systolic blood pressure; DBP= diastolic blood pressure; BMI= body mass index; BFP= body fat percentage; WC= waist circumference; FLEX= flexibility; ME= muscular endurance; ES= effect size, *p˂ .05 / **p˂ .01, ¥ small effect size
Table 6 shows the positive and significant relationships between the age of the participants and the body mass index (p= .000), fat percentage (p= .005), and waist circumference (p= .000), indicating that, at a higher age, the values in these variables increased, while for flexibility, the correlation was negative (p= .017), indicating that, at an older age this capacity decreased.
Among the physiological, anthropometric, and physical fitness variables, correlations were also found. Systolic and diastolic blood pressure correlated significantly with body mass index (p= .000) and waist circumference (p= .000). Regarding the relationship between the anthropometric variables, the body mass index showed a significant and positive relation with fat percentage (p= .000) and waist circumference (p= .000). The fat percentage was negatively related to the physical fitness test of push-ups (p= .000).
Table 6 Correlations between the physiological, anthropometric, physical fitness, and age variables.
| Variables | AGE | SBP | DBP | BMI | BFP | WC | FLEX |
| SBP | .031 | - | - | - | - | - | - |
| DBP | .041 | .667** | - | - | - | - | - |
| BMI | .328** | .302** | .389** | - | - | - | - |
| BFP | .222* | -.056 | .010 | .538** | - | - | - |
| WC | .354** | .338** | .382** | .890** | .329** | - | - |
| FLEX | -.189* | .016 | .000 | -.048 | -.150 | -.125 | - |
| ME | -.024 | -.027 | .087 | -.104 | -.418** | -.061 | .125 |
Note: Values correspond to the r Pearson Coefficient. Note: SBP= systolic blood pressure; DBP= diastolic blood pressure; BMI= body mass index; BFP= body fat percentage; WC= waist circumference; FLEX= flexibility; ME= muscular endurance. *p˂ .05/ **p˂ .01
Discussion
The purpose of this study was to evaluate anthropometric, physiological, and physical fitness variables in 158 participants of a swimming program according to sex and age. The variables of body mass index, fat percentage, and waist circumference were the measurements in which more than 55% of the individuals presented unhealthy parameters.
The data obtained in the present study are similar to other studies carried out in the area of evaluation of physical health components, in which variables such as gender, age, and physical health level (Cartes-Velazquez & Navarrete-Briones, 2012; Secchi & García, 2013; Rivera-Cabezas & Ureña-Bonilla, 2014; Rodríguez-Montero et al., 2014; Rojas-Valverde et al, 2016) were considered.
The values obtained in this study in relation to the variables of body mass index and percentage of fat, categorized as unhealthy, are congruent with those reported in previous research studies (Chistofaro et al., 2011; Michelotto et al., 2010). The mean values in these variables for both sexes correspond to parameters that are representative of overweight and obesity, due to an excess of body fat in both men and women and according to age (Corvos-Hidalgo & Corvo-Hidalgo, 2013). In the case of systolic and diastolic blood pressure, the parameters reported in this study as unhealthy correspond to a condition of prehypertension (Castillo et al., 2011; Škrkar et al., 2015). Pre-hypertension, as well as unhealthy body mass index and fat percentage, can be considered as cardiovascular risk factors and metabolic syndrome (Liu et al., 2013; Tejero, 2010).
According to the sex of the variables, the results, coincide with those mentioned in the scientific literature. In the case of systolic and diastolic blood pressure values obtained by men are higher than those obtained by women (Castillo et al., 2011; Restrepo et al., 2012). This difference between the sexes is common before women reach menopause, due to genetics and the functioning of hormones such as estrogens, which in women help control blood pressure, whereas in men, testosterone does not meet this function (Sandberg & Ji, 2012).
Regarding the percentage of body fat, the women presented higher values compared to men. Previous studies have shown that the female organism has a predisposition to accumulate more fatty tissue due to biochemical processes, which causes the metabolism to be slower in fat degradation (Cossio-Bolaños et al., 2011; Liu et al., 2013; Michelotto et al., 2013; Padilla, 2014; Piernas et al., 2008).
Measurements of waist circumference were significantly lower in females than in males. The fact that men have values higher than women may be due to body mass index, because this measurement has been associated with an observable parameter of localized abdominal obesity for men (Michelotto et al., 2013), while for women fat accumulation in the abdominal and visceral area is limited by its anatomical structure at the hip level, causing fat concentrations in other areas, such as the lower limbs (Piernas et al., 2008).
The results of physical fitness tests between men and women in this study were very similar to those reported in other studies (García-Soidán & Alonso-Fernández, 2011; Ramos et al., 2009). In the muscle strength and endurance test, men performed a significantly greater number of repetitions compared to women, due to a greater amount of muscle mass presented by men, which allows them to obtain better results in this type of tests (Esco et al., 2008; Zaragoza et al., 2004). No significant differences were found in flexibility between sexes, although the average for men was slightly lower; this is a tendency also observed in other studies, mainly due to a greater elasticity in women muscle fibers (Bernavent et al., 2008; Delgado et al., 2009; García & Aznar, 2011).
As for the influence of age on the variables analyzed, the results of this study are in agreement with those obtained in other similar studies that show, for the anthropometric variables, values classified as unhealthy in the oldest age groups (Cartes-Velazquez & Navarrete-Briones, 2012; Rivera-Cabezas & Ureña-Bonilla, 2014; Rodríguez-Montero et al., 2014), which may be due to the body's inability to metabolize fat as age increases, as well as the loss of total muscle mass and bone density and to the habits of life, food and the amount of physical activity, which are neglected at an older age, affecting the processes of fat metabolization by the body that causes them to accumulate more easily in the body (Chuang et al., 2012; Dunsky et al., 2013; Ranasinghe et al., 2013).
The flexibility showed a decrease in the older participants coinciding with that reported by previous studies, which determined that the muscles lose their elasticity and the joints their ranges of mobility as age increases (Bernavent et al., 2008; Delgado et al., 2009; Varquero et al., 2012).
On the other hand, when analyzing the correlations between the variables, it was observed that the values of the physiological variables showed a direct relation with the values of body mass index, and waist circumference, which supports that obesity, overweight and excess abdominal fat are factors that increase the chances of developing high blood pressure in populations (Ahmad et al., 2011; Christofaro et al., 2011), owing to the body fat is lodged more easily in the arteries generating an increase in the peripheral arterial resistance (Gasparotto et al., 2009; Michelotto et al., 2010; Santos et al., 2012).
Regarding physical fitness variables, muscle endurance correlated significantly but negatively with fat percentage, confirming what has been shown in previous studies that indicate that performance in muscle endurance tests is negatively affected by a percentage of unhealthy body fat (Ramos et al., 2009; Vaara et al., 2012). This percentage can be associated with the increase of the body weight that generates the accumulation of fat in the body, requiring a greater effort to overcome one's own body weight (Vaara et al., 2012), as in the case of the push-ups test (Esco et al., 2008).
Limitations
One of the limitations of this study was not having obtained the level of physical activity performed by the participants who were evaluated before entering the project; this situation limited the possibility of knowing if the participants were sedentary or physically active, which could have been a factor that would influence the results presented. Another limitation of this study was not having had follow-up data after a time of having started swimming to determine the effect of swimming on the evaluated indicators.
Conclusion
The percentage of fat, body mass index, and waist circumference are shown as the variables in which more people presented unhealthy parameters. Age and sex are factors that influence the behavior of anthropometric, physiological, and physical fitness variables. At a higher age, there is a higher percentage of body fat, greater waist circumference, and a higher BMI in both sexes. Women show a greater accumulation of body fat, while men have higher waist circumference values when compared between sexes. The high values of these indicators are associated with the risk of developing metabolic and cardiovascular effects. Men have better values in muscular endurance than women. Finally, it is necessary to promote healthy lifestyles, as well as the regular practice of physical activity, to impact and improve the quality of life of adult populations. For this, the physical exercise programs in the aquatic environment are positioned as an option that provides the opportunity to promote physical activity in society.

