


 Spanish (pdf)
 Article in xml format
 Article references
 Send this article by e-mail
 Cited by SciELO
  Similars in
SciELO
Similars in
SciELO 
 Permalink
Introduction
Boredom is an aversive state characterized by a difficulty to engage attention, leading to a failure to engage with our environment (Eastwood et al., 2012; Isacescu et al., 2017). Such state is triggered by a series of complex factors not well defined yet, but usually related to a failure of the environment to fulfill our need for arousal (Eastwood et al., 2012). Although some research has described boredom as a creativity and curiosity enhancer (Hunter et al., 2016; Gomez-Ramirez, & Costa, 2017), its negative effects, such as lower health-related quality of life (Schwartze, 2021), depression, poor self-control (Isacescu et al., 2017), poor job performance (Watt, & Hargis, 2010) and others have also been widely reported.
In education settings boredom is a factor that has been related to a series of negative aspects, such as lower test results (Maroldo, 1986), dissatisfaction (Gjesme, 1977) and absenteeism (Watt, & Vodanovich, 1999). Given boredom’s impact on teaching-learning processes, here it is taken as an object of study with the goal of determining its causes in the context of a university class. In the first instance, the characteristics of boredom must be defined in order to understand it in the conceptual field and establish a frame of reference as a basis to approach the study. According to the definition of Mikulas and Vodanovich (1993), boredom is a state; such state is of low excitation and dissatisfaction and is attributed to a situation of inadequate stimulation (Mikulas, & Vodanovich, 1993). However, boredom should not be understood as a well-defined state, but as a human emotion whose definition is complex (Belton, & Priyadharshini, 2007). Such complexity makes it necessary, as with several other scales of measurement, to consider a large number of variables to be able to measure boredom levels, which is essential for its study. Scales are discussed in detail in some reviews (Vodanovich, 2003; Vodanovich, & Watt, 2016); some of them apply to academic environments, such as the Boredom Proneness Scale (Farmer, & Sundberg, 1986; Struk et al., 2017), which is a questionnaire of 28 true and false questions about the proneness of individuals to certain issues, such as concentration, entertainment or patience; the multidimensional state boredom scale (Fahlman et al., 2013), a 29 item analysis that explores disengagement, arousal, inattention and time perception; the Academic Boredom Scale (Acee et al., 2010) or the coping with boredom scale (Nett et al., 2010), which is a 10 item scale that measures when a situation needs to be changed according to the individual in order to stop feeling bored. All are constructed on the basis of emotions and use a variable number of statements that capture various aspects, such as the tendency to experience boredom in the Boredom Proneness Scale (Farmer, & Sundberg, 1986 ; Struk et al., 2017; Vodanovich, & Watt, 2016). However, the complexity of these scales makes their application possible only outside the activity to be evaluated. That is, they measure boredom in a global way, but it is not possible to use them to make measurements at specific moments of an activity, only of the whole activity.
Scope
In this study, we propose a measurement of boredom that can be used for the evaluation of the impact of specific events. For this, the proposed measurement must fulfill a fundamental condition: the time for the measurement must be very short so that the development of the primary activity is disturbed as little as possible. On the other hand, the proposed measurement must have a low variability to be analytically useful.
When introducing the condition of brevity, all the methodologies presented so far are discarded since their application is laborious. However, a quick measurement is not likely to take into account the variety of factors that those other methodologies include. Therefore, it is expected that their measurements present a high variability. We will address variability in the methodology.
Methodology
The students involved in this study were undergraduate students from the chemical engineering department at the University of Costa Rica. Two different groups were chosen to take the data, one group of sophomores and the other of seniors to have representation from different generations.
The data for each analysis was obtained during the development of a class using a tool in which the events (E) and the measurement of boredom (A) were taken using a self-perceived boredom scale where 1 is the lowest boring level and 10 is the highest boring level. Each measurement was made after a moment (M) which identifies the activity immediately before event E. The structure of the data collection tool is presented in Table 1.
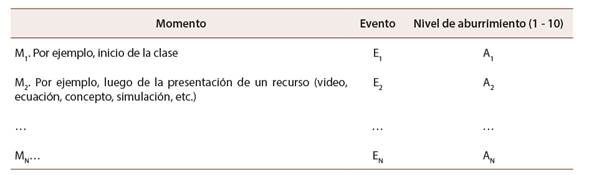
In summary, boredom is evaluated by means of a simple scale based on students’ self-perception. Boredom evaluations are carried out in various events (E) of the class chosen in such a way that the measurement allows evaluating the effect of the event on boredom.
Let A be the level of boredom according to a scale of perception from 1 to 10, where 1 is the level of least boredom and 10 that of maximum boredom. Let Ω (see Equation 1) be the rate of change of A as a function of event E for each student (S).
 ()Equation 1
Let β (see Equation 2) now be the integral of the rate of change with respect to student S.
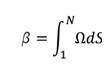 ()Equation 2
Where S is each student and N is the total number of students. In this way β is a variable that determines the net global change in the level of boredom.
Finally, the impact index Ψ= β Ν is determined. Thus determined, Ψ is an index whose value is interpreted as the average change in the units of boredom experienced since the last measurement by each student.
Results and Discussion
The hypothesis of this study is that the value of Ψ has low variability although the level of boredom (A) does not. In other words, it is postulated that, although the perception of boredom according to the scale used is a function of the individual, the effect on boredom of a given event is independent of who perceives it. This behavior is verified in data presented in Figure 1, which are the result of applying the proposed scale to a population of 23 students during a class divided into 18 events. Figure 1 shows how the level of boredom has inter-student variability that exceeds inter-event variation. That is, noise due to the subjectivity of perception is greater than the variation due to events. However, the variability of the impact index is much lower than its inter-event variation. In short, the group of students perceives the level of boredom with very different values of A, but there is consensus regarding the change in the level of boredom produced by an event (Ψ): most seem to become bored or discouraged in a similar way for each event.
The decrease in this variability, however, could be a homogenization effect due to inaction, that is, if the interest to carry out a proposed measurement activity is low, the level of boredom reported could be repeated in two or more measurements, causing Ω= 𝜕𝛢 𝜕𝛦 to be zero. In this way, variability would decrease due to inaction. To eliminate this effect, all values Ω = 0 were removed from the original data and the variability was calculated again. Data shown in gray in Figure 1 was obtained that way, presenting a slight increase in variability; however, it is not significant. To quantify such effect, we defined the next variables:
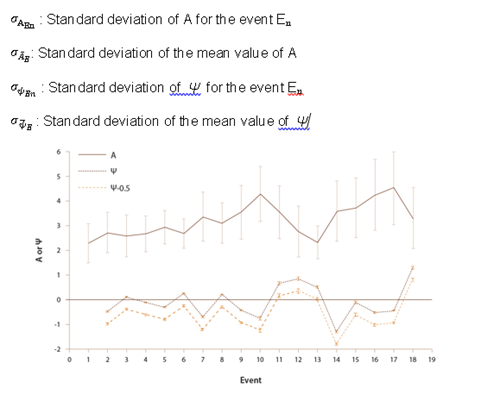
Figure 1: Level of boredom (A) and impact factor (ψ) measured in a university class. In gray, the impact factor is presented without considering the events with Ω=0 (data is displaced -0.5 units on the vertical axis to facilitate visualization)
The relationship between the value of 𝜎 𝐴 𝐸𝑛 and that of 𝜎 𝐴 𝐸 (or 𝜎 𝜓 𝐸𝑛 and 𝜎 𝜓 𝐸 ) is an indicator of the relative variability of data. A relative variability that tends to zero indicates that the fluctuation between measures are negligible with respect to the measurement itself. Variability greater than one indicates that the variations in measurements are smaller than the variability of data, which renders information useless because it cannot be distinguished from noise. Therefore (Figure 2, 3, 4, 5, 6):
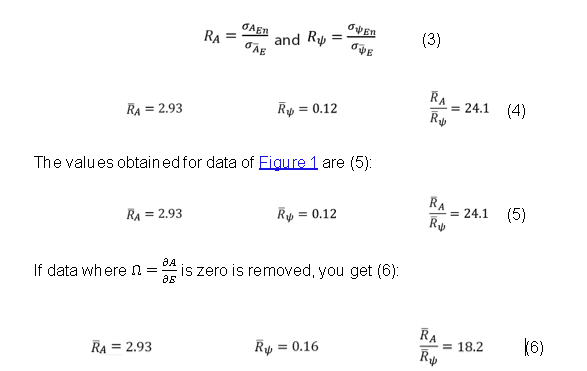
This implies that, although there is some increase in variability when eliminating the factor of increase due to inaction, the conclusion remains the same: the variability of the impact index is much less than the variation of data.
Case of study
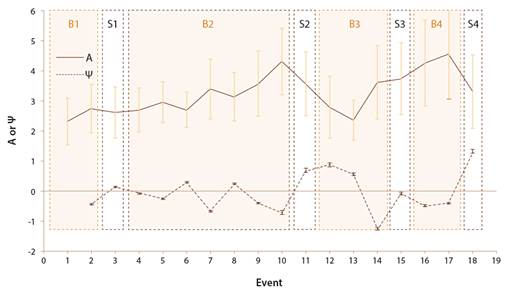
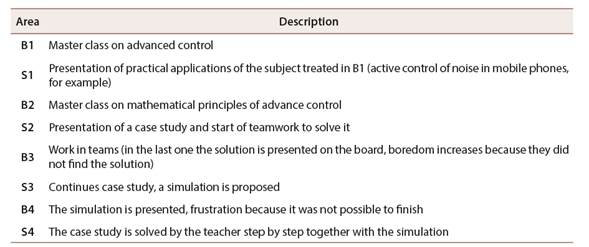
In Figure 3, Figure 1 data is presented divided into areas. Areas marked with a B represent the development of an activity (lecture, teamwork, presentations ...). Areas marked with an S are specific events construed as elements with motivational power and boredom reduction potential (presentation of practical applications, proposal of case studies, simulations ...). The impact index and the level of boredom indicated in Figure 3 correspond to the measurement made at the end of the event in which they appear. For example, at the end of event 3 in area S1, boredom was measured. This value is which occurs in area S1; therefore, S1 represents the values caused by event 3.
Areas B1 and B2 are traditional lectures, where concepts and mathematical developments are presented. The impact index for these areas, in most cases, is negative, which indicates that such events generate boredom. Some occasional positive values could be an indication of a particular interest in the subject being studied at that time. Areas marked with S have impact rates greater than zero, which confirms their positive effect in reducing boredom.
Areas B3 and S3 are of particular interest. The activity developed in B3 is a dynamic that is not supposed to lead to boredom, as it is the resolution of a problem in the class, in teams, however, although the impact index confirms this fact in events 12 and 13, event 14 drops about two points. When interviewing student teams, we discovered that they were unmotivated at event 14 because they had to present their solutions in front of the rest of the teams and failed to come up with a satisfactory solution. This event exceeded their abilities, and they perceived it as boredom.
Moment S3 increases the impact index to almost zero, but since it is a continuation of the case study (the student must perform a simulation of the proposed solution), disengagement persists. The high value of area S4 is striking. It corresponds to the moment when the team presents their solution to the case study to their classmates. The details of each of the events are presented in Table 2.
Thus, it was possible to analyze the class in detail, evaluating the concrete effect of each of the activities, which renders a meticulous diagnosis, not only of the class itself but of each of its sections. This allows making corrections in the subsequent immediate class. In addition, there is a specific indication of the activities that should be improved and those that should be maintained and strengthened.
Note: Prepared by the authors.
Figure 3: Level of boredom and impact index for different moments of the class grouped in areas according to a previous classification as moments where a traditional master class (B) and dynamic moments (S) are developed
Conclusions
The proposed scale allows identifying individual activities that generate boredom in the group of students. In this study, boredom was caused by monotony (areas B1 and B2 in Figure 3) and frustration (areas B3 and B4 in Figure 3) triggered when students were given a task beyond their abilities. Frustration increased perceived boredom. This is in accordance with previous studies showing boredom to be caused by a failure of the environment to fulfill our need for arousal (Eastwood et al., 2012).
The relative variability of the impact factor is about 20 times lower than the level of self-perceived boredom (A). This makes the impact factor to have analytical validity although the level of boredom does not, given its high variability.
The detailed analysis of a class, achieved with the scale presented here, is a powerful tool to improve the teaching and learning process because it gives feedback about the specific activities, then, action could be taken to change or reinforce different sections of the class design.
The tool developed here could be integrated with a facial recognition system and body language to automate measurements and implement a real-time diagnosis system.
The local boredom measurement method presented here is a promising tool when developing synchronic online classes because it could provide valuable information to improve the design of online education.
Contribution Statement
The authors declare that they have contributed in the following roles: L. G. M. contributed to the writing of the article; the management of the research process; obtaining funds, resources and technological support and the development of the research. J. A. C. C. contributed writing to the article; the management of the investigative process; obtaining funds, resources and technological support and the development of the research.
Supplementary Material
This article offers supplementary material:
-A preprint is available at https://doi.org/10.5281/zenodo.6468432

