


 Español (pdf)
 Articulo en XML
 Referencias del artículo
 Enviar articulo por email
 Citado por SciELO
  Similares en
SciELO
Similares en
SciELO 
 Permalink
Introduction
Flood management is considered to be a complex process in which hydrological, hydraulic, geotechnical, environmental, economic and social factors interact. It also uses a system for making decisions based primarily on modeling tools, because of the complexities involved in managing floods. Remote access models are used for geographic information systems, simulations (hydrological, hydraulic, weather, etc.), and for risk analysis and policy formulation, among other purposes (1). From the point of view of water resources modeling, these models are used as tools for planning and design of infrastructure and for forecasting to implement mitigation measures.
To understand the dynamics and behavior of the river channel under different conditions, modeling techniques are used to predict flows and contribute to decision making for the management of the river basin. Hydrodynamic flow models can be one-dimensional (1D) or two-dimensional (2D). 1D models provide simplified and average calculations of water levels in an open channel.
They summarize complicated flows (which are three-dimensional) in a simple one-dimensional problem, by assuming that the cross section and fluid velocity at a given depth are constant (DAAD 2006). Being one-dimensional, parameters for depth and cross section are averaged so that the results obtained are average values. The equations describing the one-dimensional motion of the fluid are generally those of conservation of mass and energy, and Newton’s second law (movement) (2). They provide a general idea, in the short and medium term, of the situation of the river before a discharge, which is used, for example, to establish flood zones. On the hand, 2D models describe the spatial movement of the flow (in space) together with movement patterns (time). They assume a logarithmic velocity distribution and allow for the modeling of complex processes or interactions in the channels. This enables more extensive simulations of the impact of structures in determining the risk of flooding in areas near rivers (3). The equations used to solve problems in two dimensions are usually: 1) Navier-Stokes equations (4, 5), derived from the second law of Newton (movement), where acceleration depends on the force exerted and is proportional to mass (5), and 2), “shallow water equations”, also known as Saint Venant equations (4, 6) which are simplifications of the of Navier-Stokes equations.
Costa Rica is located in the narrowest region of Central America, which is periodically affected by climatic conditions regulated by the Atlantic and Pacific oceans, coupled with a widespread fluvial network which increases vulnerability to flooding (7). One area which is frequently affected is the Atlantic Coast, where anthropogenic activities have promoted deforestation in the upper and lower regions of rivers, weakening the capacity of the watershed retention, thus increasing the frequency and destructiveness of extreme discharges in the River. The aftermath of an earthquake in Limón in 1991, which caused a geological disturbance in La Estrella River, especially in La Estrella Valley, modifying the traditional dynamics and stability of its channel is added to this situation (8). The basin has a natural bottleneck at the exit from La Estrella Valley, increasing flooding upstream. As the current of La Estrella River approaches this natural funnel, the flow rate decreases to the point that an abundant deposition of fine sediments, especially mud and clays, occurs (9). Before the earthquake, floods had significant flow volumes (700- 900 m3 / s) and return periods of 5-6 to 9-10 years, as opposed to the current situation where extraordinary events occur every year or two (with flow volumes of 1200-3496 m3 /s). This has not only caused economic losses for people living on river margins, but also has directly impacted the productive activities of the region (10).
There have been a few attempts at modeling floods in La Estrella Valley, in spite of the frequency of extreme events and high sediment loads that flow into the main channel (8). Previous attempts have been performed for 1D models, and so far there has been no known 2D modeling.
This study aims to compare the results of 1D and 2D models, for a section of the main channel of La Estrella River, where a human settlement and main access road are very close to the river channel, to demonstrate the importance of information management for decision-making regarding the design of protective infrastructure.
Materials and methods
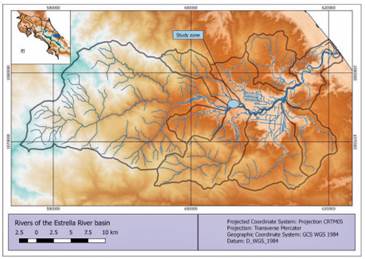
Study area The basin of La Estrella River is located in the province of Limon. It originates in the mountainous Chirripó massif and ends on the Caribbean slope. The drainage area of approximately 1031 km2 is distributed in 12 sub-basins and three areas of dispersed drainage. The length of the main channel is approximately 85 km. The river valley is located in the lower part of the basin and has an area of 55 km2 , representing 7.8% of the total area of the basin (Fig. 1). A significant amount of productive activities take place here, with banana planting being the principal activity in the area (8).
Flooding in the valley is a frequent phenomenon and occurs many times a year, varying in their magnitude and areas flooded. Various settlements have been established here, primarily near the margin of the main river channel and its tributaries. After the Limón earthquake in 1991, intense deforestation mainly in the upper part of the valley, weakened the retention capacity of the basin, has increased the frequency and magnitude of extreme discharges into La Estrella River Basin in the last two decades.
The case study covers a 2.4 km section of the main channel of La Estrella River specifically selected to analyze the impact of flow in the meander formed at that point, using 1D and 2D hydraulic models which serve as input for the design of protection infrastructure to reduce the problem of erosion on the left margin of the river and protect the nearby settlement and infrastructure (see figure 2). At this point the active river channel is 40 meters away from the only access road to the village.
Modeling
Time series and spatial data from different sources were used for 1D and 2D hydraulic modeling of La Estrella River. Peak flows were obtained using the Weibull formula on hydrometric records of maximum annual flows recorded over a period of 17 years. River flows of 2002 m3 /s for the main channel and 154 m3 /s for the upstream tributary used in the modeling of this study correspond to a return period of 5 years. The topography of the cross-sections of the main channel and its tributaries were obtained in the field every one-half meter. The contours of the main river channel and its tributaries (bathymetry) at 1-meter intervals and the Digital Atlas of Costa Rica (11) were used to generate the digital elevation map (DEM) (figure 4) of the basin of La Estrella River. The triangular irregular network (TIN) of the surface is projected using CRTM05 coordinates in the WGS-84 system.
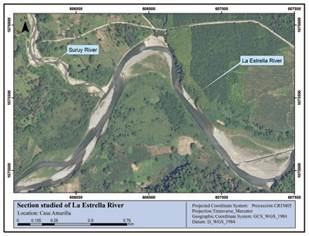
Figure 2 Location of the 2.4 km section corresponding to the case studied in the river zone called Casa Amarilla (arrow indicates the direction of flow).
One-dimensional hydraulic modeling was performed with HEC-RAS 4.1 software, using the HEC-GeoRAS (12) tool assuming mixed flow regime for unsteady flow analysis (paths with supercritical and subcritical flow) and simulating maximum events of instantaneous flows. The 1D model boundary conditions for both upstream and downstream flows were defined by the normal depth method, assuming that the slope of the energy line is equal to the channel bottom. The roughness coefficient for the channel river is 0.030 and for the river banks is 0.040. The slope of the studied section is 0.005 m/m, and 36 cross-sections of the main channel were used in the 2.4 km section (fig. 3). The results of depth and flow rate were transformed to a Raster format using the HEC-GeoRAS tool to facilitate handling of information and comparative analysis of the data.
The IBER (version 2.3.2) software (13) was used for 2-dimensional modeling (2D). Using the DEM (fig. 4) as a basis, a geometry with a tolerance of 0.1 was generated, and maximum and minimum sides equal to 1 were obtained for the entire floodplain. The same boundary conditions as those used in the 1D model were assigned. It was created an irregular grid using the method of meshing by chordal error (chordal error 0.1, maximum mesh size of 160 and automatic minimum size). The same parameters for roughness coefficient and flow were used for both models.
Results and discussion
A transitional slope in the main channel occurs in the section studied, causing instability in the channel morphology, where currently a meander has formed. Morphologically, the channel is characterized as having 3 degrees of freedom, since depth, slope and margins may vary over time (14).
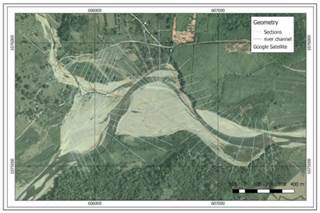
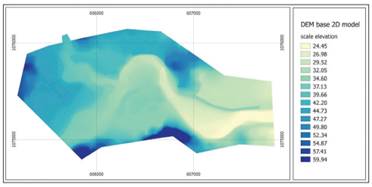
Figure 5 shows the evolution of the section studied through time. Figure 5a shows the state of the river in 1969 - a braided river with many tributaries. Figure 5b shows the floodplain affected by a rising water level, with the meander in a similar position, noting that the stream during river flooding moved in the interior of the meander. In fig. 5c, in 2010, a possible improvement of the hydraulic section of the main channel is observed, very likely as a result of an intervention to reduce the impact of floods. Five years later, in fig. 5d, it is observed a meandered river channel with localized sand bars delimiting the area covered by ordinary rises in water level in the river basin. In figures 5b and 5d, the road path is observed and it is clearly observed the erosion process of the meander decreasing the distance between the river channel and the highway.
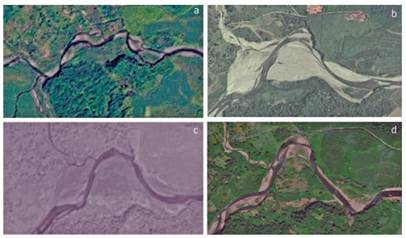
Figure 5 Historical aerial photographs of the 2.4 km section studied: a) image from 1969, b) image from 2005, c) image from 2010, d) image from 2015.
The 1D model shows a range of depths between 0.10 and 7.05 m (fig. 6). It may be seen that there is an overflow to the internal side of the meander. Since the 1D model calculates the direction of flow parallel to the river channel, it limits the ability to easily determine any flow direction transversal to the main channel. The continuous transverse line (Fig. 6) shows the nearness of two flooded spots produced by the overflow of the sides. A graphical analysis allows the comparison of the condition of topography and flow level of the sections located upstream and downstream the meander (fig. 7). It may be seen that the effect of the water level on the right bank of Section 1901.142 (cross section in the left side of figure 7) is higher than the level on the right bank of the downstream section of the meander (971.6312). It may thus be inferred that the formation of alternate flows in the main channel during extreme events can originate from relatively small return periods such as those used in this study.
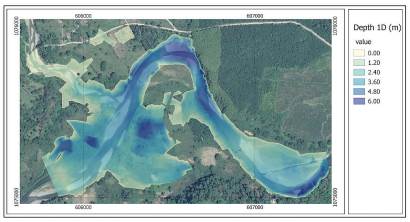
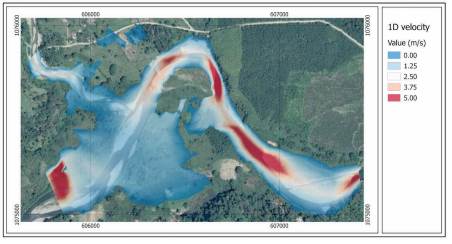
Figure 8 shows the flow velocities, obtained by a 1D model, ranging between 0.0 to 5.0 m/s parallel to the line of the main channel. Analyzing the velocities to the interior of the meander at the limits of the flooded spots, the flood velocity estimated by the model ranges around 0-0.5 m/s. In contrast to the water levels obtained upstream and downstream of the meander (Figure 7), it would be an error to assume that the flow velocities obtained from the 1D model are applicable to the alternate flow or flows that apparently are formed within the meander given the magnitude of the event.
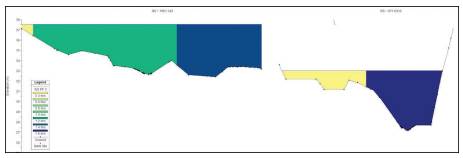
Figure 7 1D model sections located upstream and downstream from the meander (Left section 1901.142, Right section 971.6312)
If we compare the flow depths obtained with the 2D simulation the average depths generated are between of 0.00 to 8.00 meters, showing a flooded spot with average depths less than those generated with the 1D model ( fig.9). The flooded spot forms a continuous area to the inside of the meander.
The results of the 2D model show the presence of an alternating flow crossing the meander ( fig.10), unlike the 1D model, where it was only possible to assume the presence of a transverse flow in the channel. In addition, by combining raster velocity and depth, it is possible to mathematically estimate the flow passing through the main channel and the alternative passage which crosses the meander. This phenomenon could be explained as an overflow spillway which begins to operate for floods in the main channel of La Estrella River. This suggests that in an extreme event, the impact of the flow on the outside of the meander is reduced as a portion of the flow is diverted.
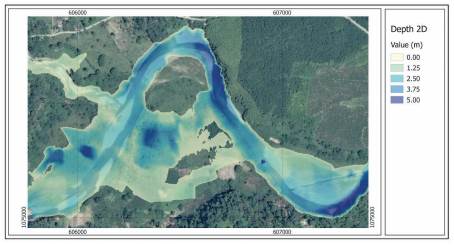
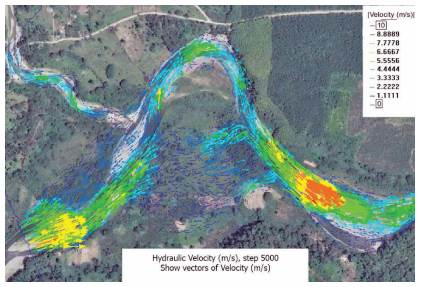
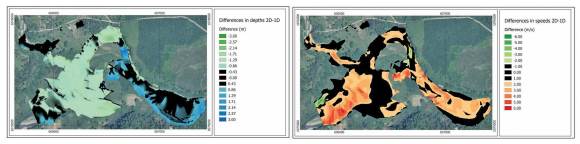
Figure 11 shows an image of the section generated from the section studied using raster analysis in which results obtained from both models are subtracted (2D - 1D). The black areas represent values close to zero, and thus indicate points where both models obtained very similar values. Figure 11a exemplifies differences in depths. The green areas indicate where the 1D model generated greater depths than the 2D model, while blue areas indicate where the 2D model generated greater depths. This is due to the fact that the 2D model calculates a larger hydraulic section, which is not only limited to the main channel but also to the flow that crosses the meander. In figure 11b, the red areas indicate where the 2D model obtained higher flow velocities than those estimated with the 1D model.
Conclusions
Hydraulic models are tools that generate information regarding flow conditions in extreme events. However, the use of this information for the design of protection infrastructure should take into account the scope of each of the models, the experience necessary to identify possible situations that are not obvious in the results of modeling, and the knowledge of the flows being modeled.
The results obtained from the 2D model indicate that any effort to modify the section of the main channel upstream from the curve of the meander may generate a concentrated flow in the meander and increase the risk of flooding in the settlement located near the meander. The downstream water level of the meander allows the existence of a natural overflow spillway that prevents the concentration of the flow in the main channel, decreasing expected water levels and reducing the risk of flooding in the settlement near the meander.
Basic studies for the design of mitigation and protection infrastructures must consider further analyses of greater return periods, to provide different scenarios of the behavior of the channel and floodplain.

