


Serviços Personalizados
Journal
Artigo
 Inglês (pdf)
 Artigo em XML
 Referências do artigo
 Enviar este artigo por email
Indicadores
-
 Citado por SciELO
 -
 Acessos
Links relacionados
-
 Similares em
SciELO
Similares em
SciELO
Compartilhar

 Permalink
Revista Geológica de América Central
versão On-line ISSN 0256-7024versão impressa ISSN 0256-7024
Rev. Geol. Amér. Central no.51 San Pedro de Montes de Oca Jul./Dez. 2014
Monitoring hydrothermal alteration in active volcanoes using remote sensing: the case of Turrialba volcano (Costa Rica)
Monitoreo de la alteración hidrotermal en volcanes activos mediante teledetección: el caso del volcán Turrialba (Costa Rica)
Esperanza Bragado-Massa1*, Miguel Marchamalo2*, Juan G. Rejas3*, Javier Bonatti4*, Jesús Martínez-Frías5* & Rubén Martínez6*
Abstract
Hydrothermal alteration was analyzed in the active Turrialba Volcano, Central Volcanic Range, Costa Rica. Principal component analysis (PCA) techniques were applied to Thematic Mapper (1986 and 2001) and MODIS/ASTER airborne imagery (2003). Analyses were carried out using 4 input bands in PCA transformations to detect clays and iron oxides. The technique was adapted to MASTER sensor, selecting relevant bands for mineral detection. Argillic and limonitic zones were mapped for 1986, 2001 and 2003 images. Image analysis results are consistent with volcanic activity from 1986 to 2003. Graben area was characterized by an overlap of alterations (limonitic and argillized) along an N-S alignment. Multitemporal analysis showed enlargement of alteration area in Central and Southwestern craters. Reactivation of phreatic activity since 2010 developed in the same areas where increasing alteration was detected, thus validating results. This research contributes to the establishment of monitoring systems in volcanic areas based on remote sensing.
Keywords: Volcano monitoring, hydrothermal alteration, PCA, remote sensing, Turrialba volcano, Costa Rica.
Resumen
En este trabajo se analiza la alteración hidrotermal en el volcán Turrialba, sistema activo de la Cordillera Volcánica Central de Costa Rica. Para ello se analizaron diferentes imágenes en fechas diferentes, Thematic Mapper (1986 y 2001) e imágenes aeroportadas MODIS/ASTER (2003). Los análisis se realizaron empleando cuatro bandas como dato de entrada de análisis de componentes principales (ACP) para detectar mineralogías (arcillas y óxidos de hierro). Esta técnica se adaptó al sensor MASTER, seleccionando las bandas relevantes para la detección de minerales. Se elaboraron mapas de arcillas y óxidos de hierro para 1986, 2001 y 2003. Los resultados son consistentes con la actividad volcánica entre 1986 y 2003, en la que la actividad se concentró en los cráteres central y SW. El graben del complejo fue delimitado adecuadamente mostrando alteraciones tanto limoníticas como argílicas en una alineación N-S. El análisis multitemporal mostró un claro incremento en las áreas de alteración entre 1986 y 2003 en los cráteres central y SW. Las recientes erupciones freáticas se han producido en las mismas zonas, validando los resultados. Esta investigación contribuye al establecimiento de sistemas de monitorización de volcanes basados en teledetección.
Palabras clave: Monitoreo volcánico, alteración hidrotermal, análisis de componentes principales, teledetección, volcán Turrialba, Costa Rica
Introduction
Hydrothermal alteration is an indicator of volcanic activity, as it results from the interaction between minerals and thermal fluids, normally of volcanic origin. Clays and iron oxides are the target materials for detection using Crosta Technique (Crosta and Mc Moore, 1989; Loughlin, 1991). This methodology was based on a series of Principal Component (PC) transformations over Thematic Mapper bands. It has been widely used for hydrothermal alteration delineation (Torres et al.1998; Mhalanga 2002; Mohammadzadeh & Babaee 2006; Crosta et al. 2003; Suarez 2003) in several scenarios, such as low vegetated areas (Crosta et al. 2003, Delendatti 2003; Yetkin 2003, Ducart et al. 2005) and tropical areas (Ruiz-Armenta & Prol-Ledesma 1995; Torres et al.1998; Suarez 2003). This methodology has been successfully implemented in ASTER data (Crosta et al. 2003; Ducart, et al. 2005 and Pekesin 2005), selecting those input bands which are equivalent to Thematic Mapper (TM) bands.
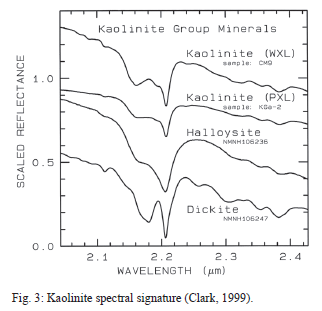
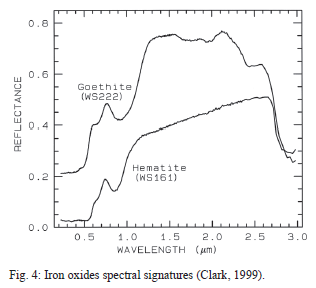
The diagnostic absorption feature of clays results from a combination of vibrational processes, specifically Al-OH bending plus OH stretching (Clark 1995). This distinctive feature occurs always in the SWIR region at 2210 nm, characteristic of clays, allowing for clay identification. On the other hand, the distinctive absorption feature of iron oxides appears in the visible region of electromagnetic spectrum. This feature is related to charge transfer absorptions caused by the movement of electrons between ferrous and ferric states due to a photon interaction (Clark 1995). Hematite and goethite (iron oxides) have strong absorptions in UV region affecting the nearby visible, mainly the range of 450 and 520 nm.
The objective of the present study was to monitor Turrialba volcano, analyzing hydrothermal alteration on three dates within the period 1986-2003 and relating results with observed volcanic activity. We analyzed the effect of using different data sources, from accessible satellite data such as Thematic Mapper to more specific MODIS/ASTER airborne imagery, covering the same area. Alteration maps were validated with recent volcanic activity.
A brief outlook on Turrialba’s volcanic activity highlights the relevance of the present study as it has evolved from strombolian eruptions in 1864 and 1866 to more frequent phreatic eruptions in the 2007-2013 period (Alvarado, 2000) (García-Vindas & Gazel, 2004) (Reagan et al., 2006) (RNS, 2014), with a significant last eruption on 29th October-1st November 2014 including ash, magma and rocks, the biggest one in 148 years (RSN, 2014). Over time, new solfatares had been appearing in both active craters (Central and Southwestern Craters). Hydrothermal and fumarole activity increased from 2007 with phreatic eruptions on January 2010 and January 2012 that created two new openings on the southwest crater (RSN, 2014). During the last eruption the falling ash reached sites located 50 km away in a W direction, as well as other materials that fell in the crater surroundings (RSN, 2014).
Geological Settings
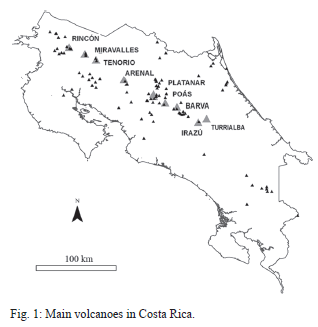
Prevalence of NE-SW trending in the whole Costa Rican territory is evident in major physiographic features, such as mountain belts and inner basins. The Cocos Plate is subducting beneath the Caribbean Plate along the Middle American Margin, building the Central Volcanic Range through magma ascent, and creating andesitic massifs such as the one on which Turrialba volcano is located. Other volcanoes, such as Platanar, Porvenir, Poás, Barva and Irazú, belong to the Central Volcanic Range, establishing an active volcanic front along a N60ºW axis which is in perfect concordance with the regional tectonic pattern NE-SW mentioned before.
The main volcanoes of the Central Volcanic Range were drawn in figure 1 in order to show the extension of volcanic massifs. Massifs are steep-sided volcanoes due to subsequent layers of deposition from different volcanic events during the Quaternary, corresponding to stratovolcano typology.
A tephrastratigraphic sequence of andesitic stratovolcanos of the Central Volcanic Range reveals the following units from top to bottom: Barva Formation ‘Qv1’ -fisural lava flows of basaltic-andesitic composition, lahares and volcanic avalanches- (Marshall 2000), Glowing Avalanche or Río Tiribí Formation ‘Qv3’ -ignimbite, ash, bomb, pumice (Alvarado et. al 2006, Kussmaul 2000, Pérez 2000, Pérez et al. 2006) and Intracanyon Lava Flows or Colima Formation ‘Qv4’ -andesitic lava flows with interbedded tuff- (Marshall 2000).
Local Settings
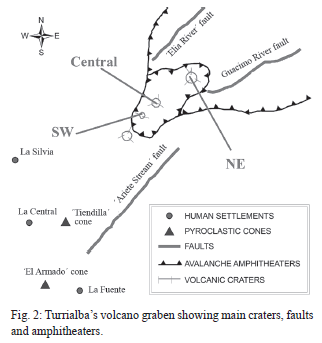
Turrialba is located ten kilometers eastwards from the Central Volcanic Range axis (Gazel 2003 and Salazar 1996) in a NE-trending fracture zone, transversal to the volcanic ridge axis (Soto, 1988). Fractures are strike-slip faults caused by a NW-SE extensional stress regime, responsible for several NE structures, such as: (1) a ‘pull-apart’ basin along Irazú-Turrialba axis and (2) N40ºE alignment in Turrialba’s craters (Linkimer 2003). Turrialba volcano is an andesitic stratovolcano located in the southeastern margin of the Central Volcanic Range, at 10º02’ North latitude and 83º46’ West longitude. It has an elongated depression between two strike-slip faults: (1) Elia river fault and (2) Ariete stream (Guácimo river fault), both inferred by Soto (1988) through their fault scarps using photogeology. This tectonic depression is known as Turrialba ‘graben’. It has some particular features, such as: (1) three conserved craters -Northeastern, Central and Southwestern-at the almost flat summit, (2) one collapsed crater at the southwestern-most margin of the summit, and (3) two pyroclastic cones, El Armado and Tiendilla, which are built over Ariete Stream fault. (Fig. 2). According to Soto (1988), Turrialba ‘graben’ seems to have a length of 11 km, including two stratovolcanoes emplaced in the same NE-trending as Turrialba’s craters (Finca Liebres at the SW and Dos Novillos). A great avalanches amphitheatre (2.5 km-wide and 3.5 km-length) enhances the physiographic expression because it is limited by Elia River fault at the North and Guácimo river fault at the South, which present scarps between 300 and 600 meters of height. (Linkimer 2003) Quebrada Gato solfatares, located at the West, 5 km apart from Turrialba’s summit, was included by Soto (1988) in the Turrialba system.
Data and Pre-Processing
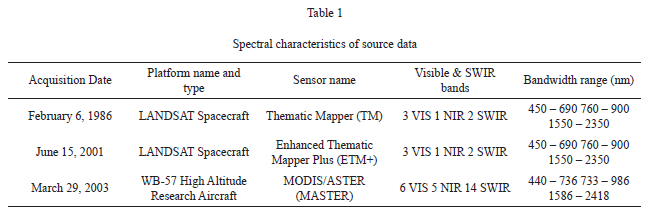
Three images were used in the present study: (1) ‘February 6, 1986’, Thematic Mapper (TM) sensor, LANDSAT spacecraft, (2) ‘June 15, 2001’, Enhanced Thematic Mapper Plus (ETM+) sensor, LANDSAT spacecraft and (3) ‘March 29, 2003’, MODIS/ASTER (MASTER) sensor on board the WB-57 High Altitude Research Aircraft. The pixel size is 30 meters for bands 1 to 5 and 7 of TM and ETM+ sensors, because the satellite is located at 705 km and its Instantaneous Field of View (IFOV) corresponds to 0.043 mrad. Airborne data acquired by MASTER sensor have an IFOV value of 2.5 mrad and a pixel size of 35 meters. Furthermore, both source images differ in their digitalization, 8-bit for bands 1 to 5 and 7 LANDSAT and 16-bit for all MASTER bands. The MASTER sensor has 50 channels, the last 25 placed in the mid-TIR range of the electromagnetic spectrum, i.e. from 3 to 13 microns (3000 to 13000 nm), designed to simulated the 5 channels-TIR of ASTER sensor (Hook et al 2001). Only the visible-SWIR range 0.4 to 2.5 microns (400 to 2500 nm) was used to achieve the aims of the present study. Full width at half maximum (FWHM) of each band is presented in the last column of Table 1 for both data sources, spaceborne as well as airborne images. The set of tasks that have been approached involve the geometric correction and georeferencing of the images. Data from airborne sensors can be much more useful when they are accurately georeferenced (Rejas et al., 2007).
A parametric georeferencing method, known as Direct Georeferencing (DG), was applied to the MASTER images. This allows us to correct geometric distortions produced by movements of the platform during image acquisition, and georeferences each pixel in a single automatic process. To this, we use the positioning data (X, Y, Z) and attitude (roll, pitch, yaw) measured simultaneously by an inertial system based on GPS/IMU (Global Positioning System/Inertial Measurement Unit). The input geometric data (IGM) from a HDF file was applied to georeference directly the MASTER images in Datum WGS 84 UTM zone 16 North, using ENVI software. Spatial enhancement was applied to both LANDSAT images (TM 1986 and ETM+ 2001), using the 15m-panchromatic ETM+ 2001 band to reduce the pixel size of the 30m-VIS-SWIR bands, improving their spatial resolution. IMGFUSE algorithm was implemented, merging the lower spatial resolution with the higher spatial resolution (Bragado et al. 2009). A direct georeferencing was performed on the MASTER image to place it in the same reference system as the LANDSAT images (UTM zone 16 North – WGS84). This task was performed using the positional information from GPS/INS recorded on board which is stored in the HDF file through a tool implemented in ENVI software.
Target Materials Detection
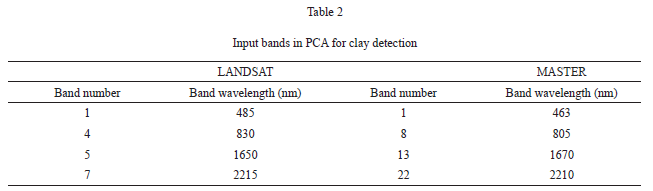
H image encloses the spectral information related to Al-OH bearing mineral assemblages, namely, kaolinite, montmorillonite, dickite, pyrophilite and clay minerals group. The diagnostic absorption feature of clays results from a combination of vibrational processes, specifically Al-OH bending plus OH stretching (Clark 1995). This distinctive feature occurs always in the SWIR region at 2210 nm, characteristic of clays, allowing for clay identification (Figure 3). The 4 PCA input bands for argillic prospection are shown in Table 2, for both data sources (LANDSAT TM and MASTER)
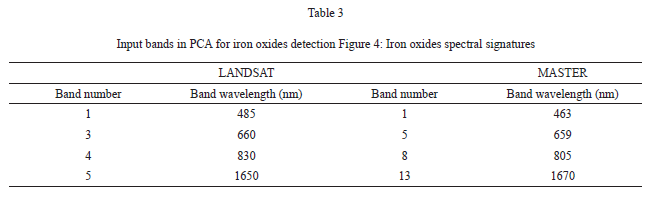
In contrast with clays, the distinctive absorption feature of iron oxides appears in the visible region of electromagnetic spectrum. This feature is related to charge transfer absorptions caused by the movement of electrons between ferrous and ferric states due to a photon interaction (Clark 1995). Hematite and goethite (iron oxides) have strong absorptions in UV region affecting the nearby visible, mainly the range of 450 and 520 nm (Figure 4). In the visible region, both iron oxides and jarosite (hydrous sulphate of potassium and iron) exhibit an increase in its spectral response. Comparing the spectral behaviour in UV-adjacent bands with nearby wavelengths in the NIR region, we note the distinguishable contrast in spectral response used to prospect iron presence. The 4 input bands for limonitic alteration delineation are shown in Table 3, for both data sources (LANDSAT TM and MASTER)
Results
Clays detection (H image)
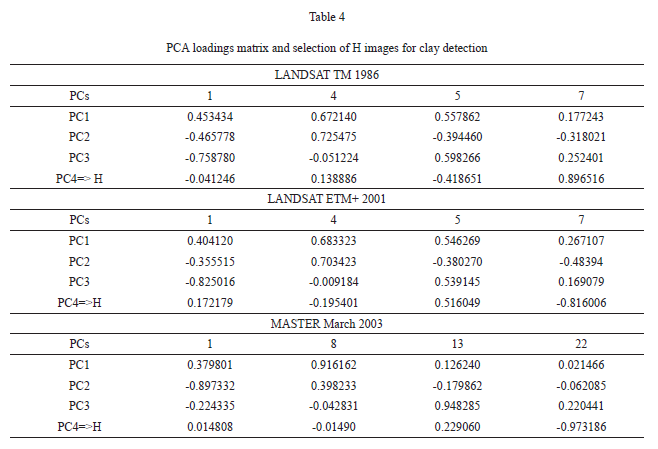
Comparing the columns ‘5’ and ‘7 in Table 4, which correspond to bands 5 and 7 of LANDSAT 1986, the 4th records in each column (highlighted) exhibits the highest contrast between 1650 and 2215 nm, indicative of the aforementioned clay absorption feature. The 4th row corresponds to the principal component 4 (PC4), the eigenvector that contains the typical spectral contrast of clays (i.e. the argillic alteration) and is known as ‘H image’.
Performing the same PCA on the June 2001 image, we get an analogue result: H image corresponds to PC4. It can be noted that stored values in 2001 are positive for ‘5’ and negative for ‘7’, whereas in 1986 we got the opposite result. A visual analysis of the LANDSAT H image shows that argillic alteration (contrast between 1650 and 2215 nm) is associated with dark pixels instead of bright pixels. To solve this, the eigenvector PC4 was negated to enhance the argillic alteration areas as bright pixels (Mhalanga 2002; Pekesin 2005; Yetkin 2003).
MASTER bands ‘13’ and ‘22’ (1670 nm and 2210nm, respectively) correspond to TM bands ‘5’ and ‘7’ (Table 2). The magnitudes and signs of the eigenvectors for MASTER (Table 4) show that the spectral response of clays is stored in PC4. In order to enhance the spectral response of clays as brightest pixels, the negation of PC4 was needed to obtain the H image for the March 2003 MASTER image.
Iron oxides detection (F image)
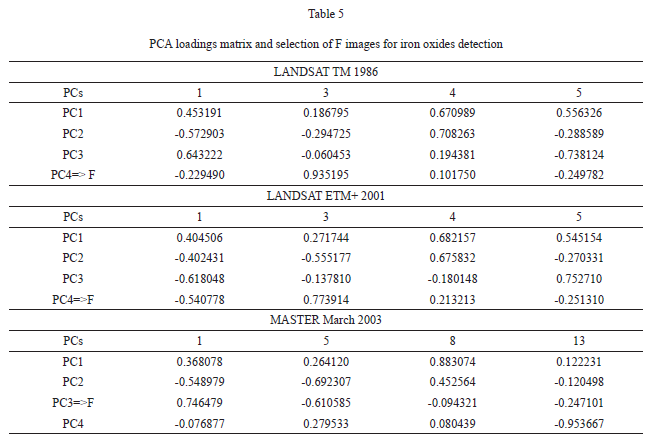
F image corresponds to the eigenvector that enhances the iron oxides spectral response, which is given by low reflectance in 485 nm and relative high reflectance in 660 nm. We compare the loading values that are stored in ‘1’ and ‘3’ columns in order to find highest contrast in magnitude and sign. (Table 5).
An analogue procedure was applied in June 2001 with similar results. Low response in the visible wavelength adjacent to the UV region (band ‘1’) and a relative high response in band ‘3’ (nearby to NIR region) confirm that PC4 is also the F image in this case, (Table 5).
Taking into account the loadings values in Table 5, band ‘1’ (463 nm) and band ‘5’ (659 nm) have opposite signs and enhance the spectral response of iron oxides. As the sign of loading values for MASTER image seems to be inverted in comparison with those from TM images, PC3 should be negated in order to derive the F image of the March 2003 image, where the target material (iron oxides) appear as bright pixels.
Hydrothermal alteration mapping
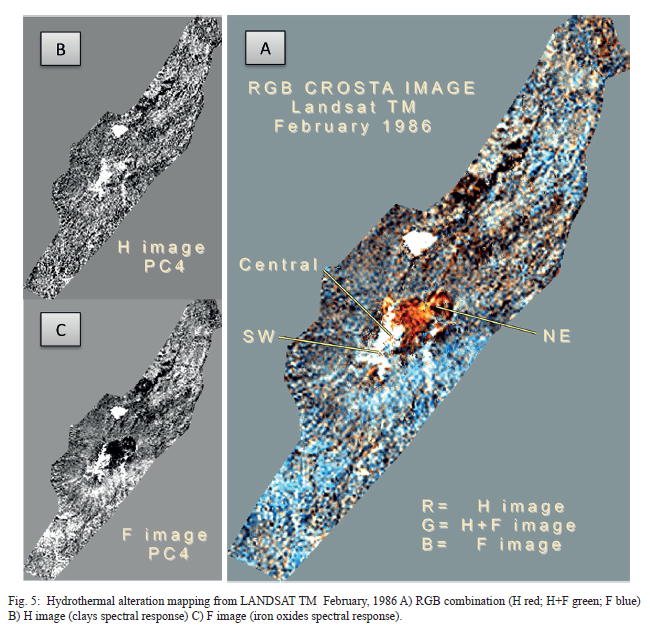
The most conventional way to show the alteration results is displaying them in a RGB combination. As we have only two bands, ‘H image’ and ‘F image’, we need an additional band computed as sum of both (H+F image) (Crosta et al. 2003; Ducart et al. 2005, Pekesin 2005; Ruiz-Armenta & Prol-Ledesma 1995; Suarez 2003; Torres et al.1998; Yetkin 2003). The RGB combination results from assigning the ‘H image’ to the red channel, the sum ‘H+F image’ to the green channel and the ‘F image to the blue channel. In this combination white pixels show both alteration zones, (iron stained and argillized). Bright reddish to orange pixels exhibit the prevalence of argillized zones and bright cyan to bluish pixels show the limonitc alteration preponderance. (Loughlin, 1991, Mhalanga 2002 and Yetkin 2003). The hydrothermal mapping for February 1986 is displayed in Figure 5.
Whitish pixels are related to both alteration types overlapping. This occurs along the graben axis approximately N40ºE, along a N-S alignment crossing over the graben axis nearby Central and Southwestern craters, following a N-S trend at the southern slope of Turrialba volcano and finally an isolated group of pixels with a fan-like morphology located at the north outside of the volcano’s summit. In the same figure, reddish pixels perfectly show the elongated structure of Turrialba’s summit, revealing that hydroxyl-bearing minerals (clays) constitute the main fill material within the volcano’s summit. Finally the bluish pixels appear as patches in the highly vegetated slopes of Turrialba’s volcano.
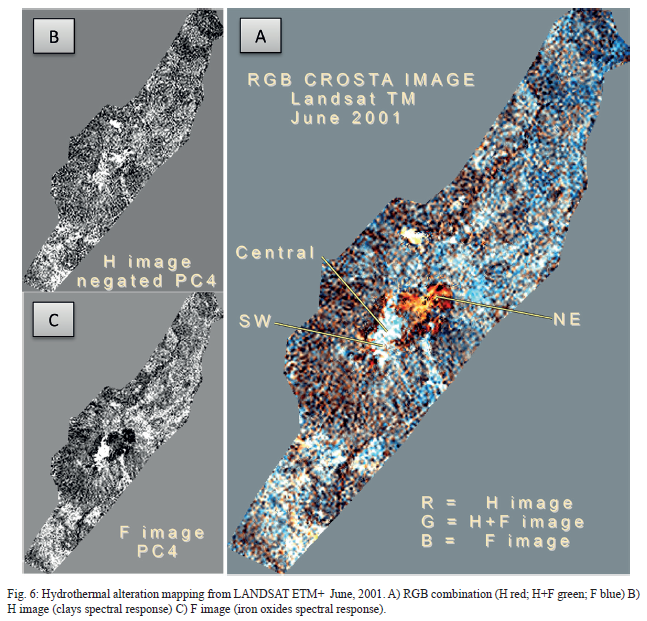
Fifteen years later, both hydrothermal venting patterns, (N40ºE and N-S trending), are apparently merged due to hydrothermal circulation through fractures and weakened zones, promoting an alteration area enlargement in Central and Southwestern craters surroundings. In Figure 6, the wide whitish area at the most active craters (Central and Southwestern) encloses cyan pixels, revealing iron oxides formation in most of the venting points. The northernmost white pixels (clays + iron oxides), which had a fan-like morphology in 1986 (see Figure 5), have changed their morphology in 2001 (see Figure 6) due to re-vegetation of the landslide scar. Reddish to orange pixels show the preponderance of clays at the volcano’s summit, mainly at the Northeastern crater, and have close similarities the hydrothermal maps from both dates: February 1986 and June 2001.
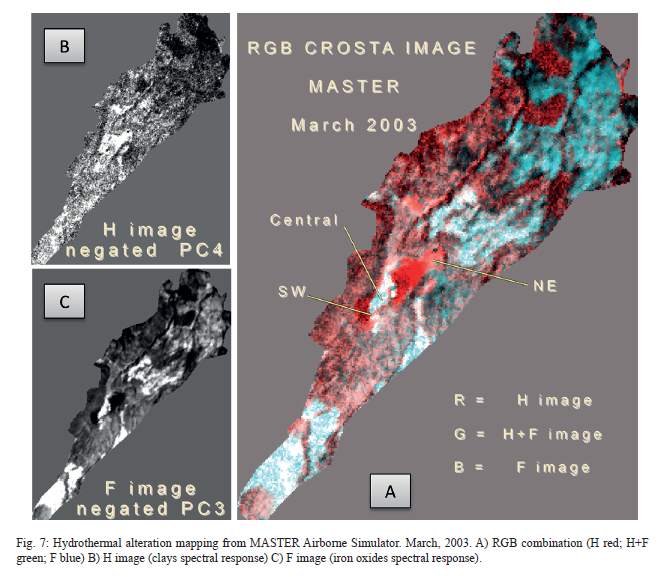
There is correspondence between results from TM spaceborne data and MASTER airborne data. The RGB combination for MASTER 2003 displays red shades in the same areas where both TM images show ochre and orange hues (Figure 7). The principal components that enclose the spectral response from target materials (clays and Fe oxides) were negated to obtain the corresponding H and F images, transforming dark pixels into bright ones, enhancing the altered material. The brightest red pixels are located along the volcano’s summit, following the structural lineament of Turrialba’s graben. The Central crater shows a distinct pattern, characterized by whitish pixels enclosing little cyan pixels. Cyan hues denote the prevalence of iron oxides at the Central and SW craters, while the white pixels seem to be related to both alteration types overlapping. In addition, the landslide scar in the MASTER image corresponds to a bare soil sample (without vegetation cover) with clays in its composition, evidenced by their light red color.
The procedure was the same for spaceborne and airborne data, selecting the corresponding wavelengths as input bands for each PCA analysis. Although coloration in RGB combinations seems to vary depending on data source, it does not affect the interpretation process. In general terms, red and orange hues correspond to argillic zones (clays), blue and cyan colors to limonitic alteration (Fe oxides) while white pixels are related to spectral responses of both alteration types.
The North-eastern margin of Turrialba’s summit shows a uniform patch, orange in the case of the LANDSAT image and red in the MASTER image, denoting the prevalence of clays in the NE crater. Whitish pixels along the axis of Turrialba’s graben form a structural alignment which passes through the SW and Central craters. This N40ºE trending structure, as well as N-S alignment located at the south slope of Turrialba, was identified in alls images. The MASTER image offers a foreseeable result regarding the detection of hydrothermal activity, consistent with the volcanic activity in last thirty years documented at the beginning of present study (Reagan et al., 2006). This activity is located mainly at the Central and SW craters.
Conclusions
This work confirms that periodic monitoring of hydothermal activity in volcanic areas can be programmed using either spaceborne or airborne available data sources. For this purpose, specific bands from each sensor must be selected for multivariate analysis, depending on the spectral response of target minerals, as reported in literature.
Remote sensing offers a cost-effective alternative for volcano monitoring. Hydrothermal alteration seems to be related to most active areas of volcanic activity, especially those prone to phreatic eruptions. Thus, integrated monitoring programs can combine different monitoring techniques: geo-physics, remote sensing and seismology.
Turrialba is an active volcano that is threatening densely populated areas. Further research can be oriented towards the integration of complementary techniques in monitoring programs, such as ground deformation using SAR techniques (Fernández et al., 2003), thermal monitoring (Sobrino et al., 2002) and hydrothermal alteration, as presented, allowing the identification of reliable indicators of increased volcanic activity. This would improve preparedness and warning capacities towards volcanic risk management.
Acknowledgments
This work was supported by the PCI Program (Joint Research Projects) financed by AECID (Spanish Agency of International Cooperation and Development), by projects A/019450/08 DESARROLLO EN NUEVAS TECNOLOGÍAS PARA LA PROTECCIÓN Y PRESERVACIÓN DEL PATRIMONIO CULTURAL DE HONDURAS, A/020787/08 -MEJORA DE LA EFICIENCIA DE CAPTACIÓN Y RECARGA DE LOS SISTEMAS DE ABASTECIMIENTO DE AGUA MEDIANTE ORDENAMIENTO DE LOS USOS DE LA TIERRA EN CENTROAMÉRICA, A2/037794/11 MACOSACEN: Manejo Comunitario Suelos y Aguas en Centroamérica and C/031797/10 FORMAIAS.
References
ALVARADO, G. E., 2000: Los volcanes de Costa Rica: geología, historia y riqueza natural.- 269 págs. Ed. UNED, San José, Costa Rica. [ Links ]
ALVARADO, G. E., CARR, M. J., TURRIN, B. D., SWISHER, C., SCHMINCKE, H. U. & HUDNUT, K. W., 2006: Recent volcanic history of Irazú volcano, Costa Rica: Alternation and mixing of two magma batches, implying at least tw intracrustal chambers.- En: ROSE, W.I., BLUTHB, G. J. S., CARR, M. J., EWERT, J., PATINO, L. C. & VALLANCE, J. (eds): Natural hazards in Central America.- Geo. Soc. Amer. Spec. Paper, 412: 259-276. [ Links ]
BRAGADO, E., REJAS, J. G., MARCHAMALO, M. & BONATTI, J., 2009: Delimitación de zonas de alteración hidrotermal en la Cordillera Volcánica Central de Costa Rica mediante imágenes Landsat y del sensor simulador MASTER.- Proc. XIII Congreso de la Asociación Española de Teledetección. Calatayud, España: 265-268. [ Links ]
CLARK, R. N, 1995: Reflectance spectra.- En T. J. AHRENS (ed.): Rock physics and phase relations: A handbook of physical constants.- Amer. Geophy. Union, Washington: 178-188. [ Links ]
CLARK, R. N., 1999: Spectroscopy of rocks and minerals, and principles of spectroscopy.- En: RENCZ, A. N. (ed.): Manual of remote sensing, Volume 3, Remote sensing for the Earth sciences.- John Wiley and Sons, New York: 3-58. [ Links ]
CROSTA, A. P. & MCMOORE, J., 1989: Enhancement of LANDSAT TM imagery for residual soil mapping in SW Minas Gerais State, Brazil: A Prospecting Case History in Greenstone Belt Terrain.- 7th Thematic Conference on Remote Sensing for Exploration Geology. Environmental Institute of Michigan Calgary, Alberta: 1173 -1187. [ Links ]
CROSTA, A. P., DE SOUZA FILHO, C. R., AZEVEDO, F. & BRODIE, C., 2003: Targeting key alteration minerals in epithermal deposits in Patagonia, Argentina, using ASTER imagery and principal component analysis.- Int. J. Remote Sensing, 24(21): 4233-4240. [ Links ]
DELENDATTI, G. L., 2003: Caracterización de zonas de alteración hidrotermal en las márgenes del río Castaño, provincia de San Juan, mediante procesamiento digital de imágenes TM.- Rev. Asoc. Geol. Argentina, 58(1): 97-108. [ Links ]
DUCART, D., CRÓSTA, A. & DE SOUZA, C., 2005: Mapeamento de alteração hidrotermal no distrito Los Menucos, Argentina, por meio de imagens multiespectrais ASTER.- Anais XII Simpósio Brasileiro de Sensoriamento Remoto, Goiânia, Brasil, INPE: 4057-4064. [ Links ]
FERNÁNDEZ, J., YU, T. T., RODRÍGUEZ-VELASCO, G., GONZÁLEZ-MATESANZ, J., ROMERO, J., RODRÍGUEZ, G., QUIRÓS, R., DALDA, A., APARICIO, A. & BLANCO M. J., 2003: New geodetic monitoring system in the volcanic island of Tenerife, Canaries, Spain. Combination of InSAR and GPS techniques.- J. Volcanol. Geothermal Res. 124: 241-253. [ Links ]
GARCIA-VINDAS, J. & GAZEL, E., 2004: Presencia de radionucléidos en arcillas del sistema hidrotermal del volcán Turrialba, Costa Rica.- Rev. Geol. Amér. Central, 30: 149-155. [ Links ]
GAZEL, E., 2003: Las series alcalinas del plioceno de Costa Rica: Distribución espacial y relación con una fuente mantélica tipo OIB.- Rev. Geol. Amér. Central, 29: 87-94. [ Links ]
HOOK, S. J., MYERS, J. J., THOME, K. J., FITZGERALD, M. & KAHLE, A. B., 2001: The MODIS/ASTER airborne simulator (MASTER)-a new instrument for earth science studies.- Remote Sensing of Environment, 76: 93-102. [ Links ]
KUSSMAUL, S., 2000: Estratigrafía de las rocas ígneas.- En: DENYER, P. & KUSSMAUL, S. (eds) Geología de Costa Rica.- Editorial Tecnológica de Costa Rica, Cartago, Costa Rica: 63-86. [ Links ]
LINKIMER, L. 2003: Neotectónica del extremo oriental del Cinturón Deformado del Centro de Costa Rica.- 114 págs., Univ. de Costa Rica Tesis Lic. [ Links ]
LOUGHLIN, W. P., 1991: Principal component analysis for alteration mapping.- Photogrammetric Engineering and Remote Sensing, 57: 1163-1169. [ Links ]
MARSHALL, J. S., 2000: Active tectonics and Quaternary landscape evolution across the western Panama block, Costa Rica, Central America.- 304 págs., Pennsylvania State Univ. Tesis PhD. [ Links ]
MHALANGA, G., 2002: Data driven predictive modelling for Archean lode gold potential, Bubi greenstone belt, southwest Zimbabwe.- 126 págs. ITC, Netherlands Tesis M.Sc. [ Links ]
MOHAMMADZADEH, M. & BABAEE, H., 2006: Application of crosta technique for porphyry copper alteration mapping using TM data in Varzegan, East Azarbaijan, Iran.- European J. Sci. Res., 13(2): 213-221. [ Links ]
PEKESIN, B. F., 2005: Mineral mapping in Oymaağaç (Beypazari - Ankara) Granitoid by remote sensing techniques.- 116 págs. Middle East Technical Univ. Tesis M.Sc. [ Links ]
PÉREZ, W., 2000: Vulcanología y petroquímica del evento ignimbrítico del Pleistoceno Medio (0,33 M.a.) del Valle Central de Costa Rica.- 192 págs., Universidad de Costa Rica Tesis Lic. [ Links ]
PÉREZ, W., ALVARADO, G. E. & GANS, P. B., 2006: The 322 ka Tiribi Tuff: stratigraphy, geochronology and mechanisms of deposition of the largest and most recent ignimbrite in Valle Central, Costa Rica.- Bull. Volcanol. 69: 25-40. [ Links ]
REAGAN, M., DUARTE, E., SOTO, G. J., & FERNÁNDEZ, E., 2006: The eruptive history of Turrialba volcano, Costa Rica, and potential hazards from future eruptions.- En: ROSE,W. I., BLUTH, G. J. S., CARR, M. J., EWERT, J. W., PATINO, L. C., & VALLANCE, J. W. (eds): Volcanic hazards in Central America.- Geo. Soc. Amer., Spec. Paper, 412: 235–257. [ Links ]
REJAS, J. G., MARTÍNEZ, R. & MALPICA, J. A., 2007: Hyperspectral remote sensing application for semi-urban areas monitoring.- Proc. 4th IEEE GRSS/ISPRS Joint Workshop on Remote Sensing and Data Fusion over Urban Areas, Paris, France, 1: 312-316. [ Links ]
RSN, s.f: Red Sismológica Nacional. National Seismological Network; RSN: UCR-ICE.- http://www.rsn.geologia.ucr.ac.cr. Consulta: 4 de noviembre del 2014. [ Links ]
RUIZ-ARMENTA, J. R. & PROL-LEDESMA, R. M., 1995: Técnicas de procesamiento de imágenes en la exploración de yacimientos minerales de origen hidrotermal.- Física de la Tierra, 7: 105-138. [ Links ]
SALAZAR, L. G., 1996: Análisis geológico y geomorfológico aplicado al “Plan regulador de parte del Cantón de Guácimo, Costa Rica”.- 196 págs., Universidad de Costa Rica Tesis Lic. [ Links ]
SOBRINO, J. A., LI, Z. L., SORIA, G. & JIMENEZ, J. C., 2002: Land surface temperature and emissivity retrieval from remote sensing data.- Recent Res. Developments in Geophy., 4: 21-44. [ Links ]
SOTO, G. J., 1988: Estructuras volcánico-tectónicas del volcán Turrialba, Costa Rica, América Central.- V Congreso Geológico Chileno, Santiago de Chile, Chile, III: 163-175. [ Links ]
SUÁREZ, A., 2003: Predictive mapping of massive sulphide potential in the western part of the Escambray Terrain, Cuba.- 72 págs. ITC, Netherlands Tesis M.Sc. [ Links ]
TORRES GARCÍA, M. A., CROSTA, A. P. & DE SOUZA FILHO, C. R., 1998: Integração de Dados Multiespectrais e Geofísicos na Identificação de Áreas Favoráveis à Ocorrência de Ouro na Chapada Diamantina Bahia.- Anais IX Simpósio Brasileiro de Sensoriamento Remoto, Santos, Brasil, INPE: 405-414. [ Links ]
YETKIN, E., 2003: Alteration mapping by remote sensing: Application to Hasandağ - Melendiz Volcanic Complex.- 94 págs. Middle East Technic Univ. Tesis M.Sc. [ Links ]
1 Departamento de Ingeniería y Morfología del Terreno. Universidad Politécnica de Madrid, Spain
2 Departamento de Ingeniería y Morfología del Terreno. Universidad Politécnica de Madrid, Spain. miguel.marchamalo@upm.es
3 Departamento de Ingeniería y Morfología del Terreno. Universidad Politécnica de Madrid, Spain. INTA. Instituto Nacional de Técnica Aeroespacia, Spain
4 Centro de Investigación en Ciencias Atómicas, Nucleares y Moleculares (CICANUM). Universidad de Costa Rica
5 Instituto de Geociencias, IGEO (CSIC-UCM), Facultad de Ciencias Geológicas C/ José Antonio Novais, 2, Ciudad Universitaria 28040 Madrid, Spain
6 Departamento de Ingeniería y Morfología del Terreno. Universidad Politécnica de Madrid, Spain
(Recibido: 28/02/2014; aceptado: 7/10/2014)

