


 Inglês (pdf)
 Artigo em XML
 Referências do artigo
 Enviar este artigo por email
 Citado por SciELO
  Similares em
SciELO
Similares em
SciELO  uBio
uBio 
 Permalink
Introduction
In the last decades, new techniques have been developed to study marine ecosystems (Barnett et al., 2010) amidst growing threats, such as habitat degradation, pollution, overfishing and climate change (Brautigam et al., 2015; Simpfendorfer et al., 2011). Particular emphasis has been put on non-lethal, non-extractive methods that can detect temporal and spatial fluctuations in populations associated with natural and anthropogenic impacts (Barley et al., 2017; Willis et al., 2000; Whitmarsh et al., 2017). One such method is the Baited Remote Underwater Video Stations (BRUVS). The use of BRUVS has become increasingly popular worldwide for assessing marine diversity and estimating relative abundances (Whitmarsh et al., 2017). This technique is less labour intensive and produces less biased estimates of species richness and relative abundance than underwater visual censuses with SCUBA or Diver Operated Video (Brooks et al., 2011; Harvey et al., 2002; Watson et al., 2010). The use of BRUVS, has also increased in recent years in Brazil as a low-cost alternative to study different ecosystems (Reis-Filho et al., 2019; Rolim et al., 2019; Schimd et al., 2017).
The coastline of Pernambuco State, Northeastern Brazil, includes relatively extensive sandstone reefs, which occur parallel to the coast and at different depths (Maida & Ferreira, 1997). These reefs have been suffering anthropogenic impacts at an accelerated rate, including discharge of sewage, dredging, effects of coastal development, pollution, intense vessel traffic, fishing, disordered tourism, ornamental fish market, and global climate changes (Araújo et al., 2018).
Knowledge of the fish fauna along impacted coastlines is important for management and conservation decisions and efforts to protect the local marine life. Surveys of fisheries landings were conducted along the shoreline of Pernambuco between 1995 and 2005 as part of a regional effort to assess the fish fauna of the Brazilian Economic Exclusive Zone (REVIZEE Programme). Those studies recorded a total of 179 species and 54 families in this region, including 159 species and 47 families of teleosts, and 20 species and seven families of elasmobranchs (Lessa et al., 2009). Previous studies in the region of Recife, the state’s capital and a heavily urbanized area, have focused on fish assemblages in shipwreck sites (Fischer, 2009; Oliveira, 2012), and elasmobranch ecology, due to the historic of human-shark incidents in the region (Afonso et al., 2014; Hazin et al., 2000; Hazin et al., 2008; Niella et al., 2017). Knowledge of fish assemblages on the sandy reefs offshore Recife, however, is relatively scarce, hampering marine management and conservation in the area. To improve this lack of information, a series of single BRUVS surveys was conducted. The goals were to assess the diversity and relative abundance of the ichthyofauna and investigate whether its spatial distribution was influenced by depth, underwater visibility, or habitat type.
Materials and methods
Study area: The study was carried out in the coastal area of the Metropolitan Region of Recife (MRR), which is influenced by clearly defined wet (March-August) and dry (September-February) seasons (Mendonça & Danni-Oliveira, 2007). Southeastern trade winds are more frequent in the austral winter (Northeast wet season), so the surface current at this time flows predominantly northwards. Northeastern trade winds become stronger in the austral summer (Northeast dry season), when the currents occasionally may flow southwards (Lira et al., 2010; Rollnic & Medeiros, 2013). The continental shelf is narrow and relatively flat, extending for 35 km, and typically with the slope at 60 m depth. There is an underwater sandstone reef approximately 1 km from the shore and a 6.5 m deep channel parallel to the beach (Hazin et al., 2008; Lessa et al., 2009). The internal continental shelf (0 to 20 m) is characterized mainly by quartz sand and the medium continental shelf (20 to 40 m) with predominance of sand and calcium carbonate gravel (Coutinho, 1976; Cunha, 2004). Many old vessels were purposely sunk in this area to create a shipwreck park and act as diving points and artificial reefs (Fischer, 2009).
The tidal regime is semidiurnal and mean water temperatures range from 24 to 30 ˚C, during the austral winter and austral summer, respectively. Two main estuaries are included in the study area, the Capibaribe River in its Northern part and the Jaboatão River in the Southern part (Fig. 1). Both are shallow lowland estuaries with a predominance of muddy substrates and scattered sandy deposits in some sections. Both rivers are regarded as heavily polluted due to the inflow of effluents from domestic and industrial sewage, nautical and port activities (Hazin et al., 2008).
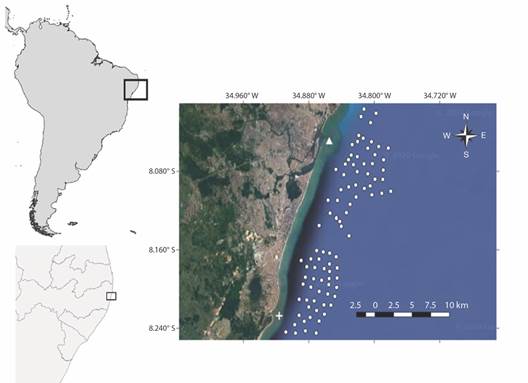
Fig. 1 Geographical position of Pernambuco State in Northeast Brazil and the Metropolitan Region of Recife (MRR) (inset). ∆ and + represent Capibaribe and Jaboatão rivers, respectively, and the white dots represent the locations of BRUVS deployments in November 2017.
Sampling collection and analysis: An approximately 25 km stretch of MRR’s shoreline was sampled as part of the Global FinPrint initiative (http://www.globalfinprint.org). For this reason, samples were concentrated around the two regions where most of the shark-human incidents has been recorded since 1992: Boa Viagem and Piedade (Hazin et al., 2008). Seventy-nine sites were sampled with single BRUVS (one camera) deployed at random sites in 11 days of effort between November 15th and 27th 2017 (Fig. 1). BRUVS were deployed between 8:00 h and 17:00 h, and were left at least 80 min in depths ranging from 10.0 to 28.6 m and at distances from shore ranging from one to nine km. Each BRUVS consisted of a GoPro Hero 3 + camera inside an underwater housing mounted on a stainless-steel frame with a bait cage with a pre-weighted 1 kg of crushed sardine (Sardinella brasiliensis) mounted on a pole in front of the camera. BRUVS were tied by a rope to a buoy and were deployed at least 1 km apart of each other to avoid overlapping bait plumes.
Latitude, longitude, date, time and depth were collected before each deployment. The number of species and individuals attracted to the bait, the maximum number of individuals of each species in the camera field of view at the same time (MaxN) and the sum of MaxN (Sum MaxN) (Cappo et al., 2003) were calculated using the recorded videos. The underwater visibility was visually estimated through video analyses, using the BRUVS’ one-meter pole as a reference. The habitat type was characterised by the predominantly substrate recorded on a frame, which could be Sediment, Sediment with phytobenthos and Sediment in shipwreck area (Fig. 2).

Fig. 2 A. Representative images of the ecosystems within the Sediment with phytobenthos B. Sediment C. Sediment in shipwreck area.
Video files were analysed with QuickTime (Apple Inc., 2010). Species were identified to their lowest possible taxonomic level. Trophic categories of each species were determined according to Fish Base (Froese & Pauly, 2019) and the international conservation status through IUCN’s website (IUCN, 2018). Species richness for each dataset was determined using the species accumulation curve in the vegan package in R (Jari Oksansen, 2022). Confidence intervals were calculated from standard deviations (P < 0.05).
Relative abundance was calculated as MaxN h-1 (maximum number of individuals of each species in the camera field of view at the same time per hour) (Cappo et al., 2003) and compared with habitat type (sediment, sediment with phytobenthos, sediment in shipwreck area), depth (10-15 m, 15.1-20 m, 20.1-25 m, 25.1-30 m), and underwater visibility (≤ 1 m, 2-3 m, 4-5 m, ≥ 6 m). Univariate analyses were conducted on MaxN h-1 data for each factor (habitat type, depth and underwater visibility), to investigate differences in mean individuals/species number recorded, both teleosts and elasmobranchs. One way ANOVA was used for normal distributed data and Kruskal-Wallis tests for nonparametric data. Significant level adopted was P < 0.05 and variables were transformed using (x + 1) or log (x + 1) to achieve normal distribution. To avoid bias due to the passage of schools of fishes, records with more than a hundred individuals were excluded from the abundance related statistical analysis (Fitzpatrick et al., 2012). Diversity Indices were calculated: 1) Shannon-Wiener H’, this value is measured by the community’s specific richness and the distribution of the individuals amidst species and 2) Pielou’s evenness J’, the value (ranging from 0 to 1) follows the abundance distribution among species of the community, where higher values (approximately 1) reflect species abundance lower than the others (Krebs, 1999). All data analysis were performed in R (R Core Team, 2016).
Results
The 79 sites sampling effort was sufficient to explain the overall fish species diversity in MRR (Fig. 3). The total recording time was 7 254 min (120.9 h) with a minimum of 71 min and a maximum of 153 min per deployment (mean time = 93 ± 15 Standard Deviation, SD). The underwater visibility ranged from 0.5 m to ≥ 6 m, with an average of 3.26 m (± 2.52 SD). The highest visibility (≥ 6 m) occurred in 12.7 % of the samples and the lowest (≤ 1 m) in 26.6 %. Depths ranged from 10.0 to 28.6 m, with an average of 19.41 m (± 4.36 m SD). The number of samples per each habitat type was unbalanced, due to the random choice of sampling locations (Sediment: 60, Sediment with phytobentos: 16, Sediment in shipwreck area: 3).
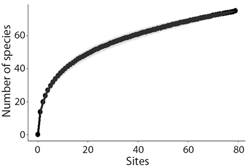
Fig. 3 Species accumulation curve based on fish assemblages observed in BRUV surveys in the Metropolitan Region of Recife.
A total of 3 286 individuals (MaxN h-1 = 27.29 h-1) distributed in 65 taxa and 29 families was recorded. Of the 65 taxa, 60 were teleosts and five were elasmobranchs (Table 1). Fifty-three taxa (83 % of the total) were identified at species level. Eleven taxa (17 % of the total, N = 128 specimens) were identified as genus, due to inadequate visibility and distance from the camera. Flounders were not identified to family or species levels given their mimetic coloration and difficulties of detecting diagnostic characters of their flat-shaped body always in contact with the bottom.
Table 1 Classes, families and species of the fishes observed in BRUVS surveys in the Metropolitan Region of Recife in November 2017
| Class | Family | Species | Sum MaxN | MaxN h-1 | Mean MaxN± SD (Min-Max) | TP | Habitat | IUCN |
| Osteichthyes | ||||||||
| Acanthuridae | Acanthurus chirurgus (Bloch 1787) | 1 | 0.008 | 0.01 ± 0.11 (1) | H | SW | LC | |
| Acanthurus bahianus (Castelnau 1855) | 2 | 0.017 | 0.03 ± 0.23 (1-2) | H | SP | LC | ||
| Acanthurus coeruleus (Bloch & Schneider 1801) | 1 | 0.008 | 0.01 ± 0.11 (1) | H | S | LC | ||
| Balistidae | Balistes capriscus (Gmelin 1788) | 28 | 0.232 | 0.35 ± 0.82 (1-5) | C | SP, S | VU | |
| Balistes vetula (Linnaeus 1758) | 3 | 0.025 | 0.04 ± 0.25 (1-2) | C | SP | NT | ||
| Carangidae | Chloroscombrus chrysurus (Linnaeus 1766)** | 67 | 0.554 | 0.85 ± 3.47 (1-23) | Om | SP. S | LC | |
| Caranx crysos (Mitchill 1815) | 110 | 0.910 | 1.39 ± 3.99 (1-30) | C | SW, SP, S | LC | ||
| Caranx ruber (Bloch 1793)** | 31 | 0.256 | 0.39 ± 1.53 (1-9) | C | SW, SP, S | LC | ||
| Caranx sp. | 11 | 0.091 | 0.14 ± 0.86 (1-7) | C | SW, SP, S | - | ||
| Carangoides bartholomaei (Cuvier 1833) | 1 | 0.008 | 0.01 ± 0.11 (1) | C | S | LC | ||
| Decapterus sp. | 34 | 0.281 | 0.43 ± 3.71 (1-33) | C | SP | - | ||
| Seriola rivoliana (Cuvier 1833)** | 1 | 0.008 | 0;01 ± 0.11 (1) | C | SW | LC | ||
| Chaetodontidae | Chaetodon striatus (Linnaeus 1758) | 5 | 0.041 | 0.06 ± 0.33 (1-2) | H | SW, SP | LC | |
| Clupeidae | Opisthonema oglinum (Lesueur 1818) | 507 | 4.194 | 6.42 ± 56.25 (7-500) | Om | SW, S | LC | |
| Echeneidae | Echeneis naucrates (Linnaeus 1758) | 22 | 0.182 | 0.28 ± 0.6 (1-3) | C | SW, SP, S | LC | |
| Epinephelidae | Epinephelus adscensionis (Osbeck 1765) | 1 | 0.008 | 0.01 ± 0.11 (1) | C | SP | LC | |
| Ephippidae | Chaetodipterus faber (Broussonet 1782) | 2 | 0.017 | 0.03 ± 0.23 (1-2) | C | SP | LC | |
| Fistulariidae | Fistularia sp. | 7 | 0.058 | 0.09 ± 0.4 (1-3) | SP, S | - | ||
| Gerreidae | Eucinostomus sp.** | 42 | 0.347 | 0.53 ± 1.23 (1-7) | SP, S | - | ||
| Haemulidae | Anisotremus virginicus (Linnaeus 1758) | 4 | 0.033 | 0.05 ± 0.27 (1-2) | C | SW, S | LC | |
| Anisotremus surinamensis (Bloch 1791)** | 2 | 0.017 | 0.03 ± 0.23 (1-2) | C | SW | DD | ||
| Anisotremus moricandi (Ranzini 1842)** | 1 | 0.008 | 0.01 ± 0.11 (1) | Om | SP | LC | ||
| Conodon sp. | 1 | 0.008 | 0.01 ± 0.11 (1) | SP | - | |||
| Haemulon squamipinna (Rocha & Rosa 1999) | 59 | 0.488 | 0.75 ± 4.94 (1-43) | C | SW, SP, S | LC | ||
| Haemulon parra (Desmarest 1823) | 2 | 0.017 | 0.03 ± 0.23 (1-2) | C | S | LC | ||
| Haemulon aurolineatum (Cuvier 1830) | 679 | 5.616 | 8.59 ± 21.55 (1-130) | C | SW, SP, S | LC | ||
| Haemulon plumierii (Lacepéde 1801) | 10 | 0.083 | 0.13 ± 0.43 (1-2) | C | SP, S | LC | ||
| Haemulon steindachneri (Jordan & Gilbert 1882) | 267 | 2.208 | 3.38 ± 9.26 (1-60) | C | SW, SP, S | LC | ||
| Orthopristis ruber (Cuvier 1830)** | 55 | 0.455 | 0.7 ± 2.16 (1-15) | C | SP, S | LC | ||
| Holocentridae | Holocentrus adscensionis (Osbeck 1765) | 3 | 0.025 | 0.04 ± 0.25 (1-2) | C | SW, SP | LC | |
| Labridae | Bodianus rufus (Linnaeus 1758) | 3 | 0.025 | 0.04 ± 0.25 (1-2) | C | SW, SP | LC | |
| Lutjanidae | Lutjanus synagris (Linnaeus 1758) | 137 | 1.133 | 1.73 ± 1.95 (1-11) | C | SW, SP, S | NT | |
| Lutjanus analis (Cuvier 1828) | 6 | 0.050 | 0.08 ± 0.42 (1-3) | C | SW | NT | ||
| Lutjanus cyanopterus (Cuvier 1828) | 1 | 0.008 | 0.01 ± 0.11 (1) | C | SW | VU | ||
| Lutjanus griseus (Linnaeus 1758) | 1 | 0.008 | 0.01 ± 0.11 (1) | C | SW | LC | ||
| Ocyurus chrysurus (Bloch 1791) | 7 | 0.058 | 0.09 ± 0.79 (1-7) | C | SW | DD | ||
| Monacanthidae | Aluterus monoceros (Linnaeus 1758) | 38 | 0.314 | 0.48 ± 1.69 (1-12) | C | SP, S | LC | |
| Aluterus scriptus (Osbeck 1765) | 4 | 0.033 | 0.05 ± 0.27 (1-2) | Om | SP | LC | ||
| Aluterus schoepfii (Walbaum 1792)** | 2 | 0.017 | 0.03 ± 0.16 (1) | Om | S | LC | ||
| Cantherhines sp. | 1 | 0.008 | 0.01 ± 0.11 (1) | S | - | |||
| Mullidae | Mulloidichthys martinicus (Cuvier 1829) | 2 | 0.017 | 0.03 ± 0.23 (1-2) | C | SW | LC | |
| Pseudupeneus maculatus (Bloch 1793) | 11 | 0.091 | 0.14 ± 0.52 (1-3) | C | SW, S | LC | ||
| Muraenidae | Gymnothorax funebris (Ranzani 1840) | 2 | 0.017 | 0.03 ± 0.16 (1) | C | S | LC | |
| Gymnothorax vicinus (Castelnau 1856) | 1 | 0.008 | 0.01 ± 0.11 (1) | C | SP | LC | ||
| Ostraciidae | Lactophrys trigonus (Linnaeus 1758)** | 12 | 0.099 | 0.15 ± 0.36 (1) | Om | S | LC | |
| Acanthostracion sp. | 1 | 0.008 | 0.01 ± 0.11 (1) | SW | - | |||
| Pempheridae | Pempheris sp. | 13 | 0.108 | 0.16 ± 1.46 (1-13) | SW | - | ||
| Pomacanthidae | Holacanthus tricolor (Bloch 1795) | 1 | 0.008 | 0.01 ± 0.11 (1) | Om | SW | LC | |
| Pomacanthus paru (Bloch 1787) | 1 | 0.008 | 0.01 ± 0.11 (1) | H | SP | LC | ||
| Pomacentridae | Abudefduf saxatilis (Linnaeus 1758) | 17 | 0.14 | 0.22 ± 1.52 (4-13) | Om | SW, SP | LC | |
| Chromis multilineata (Guichenot 1853) | 7 | 0.058 | 0.09 ± 0.79 (1-7) | Om | SW | LC | ||
| Scombridae | Scomberomorus brasiliensis (Collete, Russo & Zavala-Carmin 1978) | 3 | 0.025 | 0.04 ± 0.19 (1) | C | SP, S | LC | |
| Serranidae | Cephalopholis fulva (Linnaeus 1758) | 14 | 0.116 | 0.18 ± 0.96 (3-7) | C | SW, SP | LC | |
| Diplectrum formosum (Linnaeus 1766) | 45 | 0.372 | 0.57 ± 0.94 (1-3) | C | SP, S | LC | ||
| Sparidae | Calamus pennatula (Guichenot 1868) | 5 | 0.041 | 0.06 ± 0.37 (1-3) | C | SW, SP | LC | |
| Sphyraenidae | Sphyraena barracuda (Walbaum 1792) | 8 | 0.066 | 0.10 ± 0.3 (1) | C | SW, SP, S | LC | |
| Sphyraena picudilla (Poey 1860) | 90 | 0.744 | 1.14 ± 9.06 (10-80) | C | S | LC | ||
| Tetraodontidae | Lagocephalus laevigatus (Linnaeus 1766)** | 10 | 0.083 | 0.13 ± 0.33 (1) | C | SP, S | LC | |
| Sphoeroides sp. | 7 | 0.058 | 0.09 ± 0.33 (1-2) | SP | - | |||
| Unidentified | Unidentified species of flounders | 39 | 0.323 | 0.49 ± 0.75 (1-3) | SP, S | - | ||
| Chondrichthyes | ||||||||
| Carcharhinidae | Carcharhinus sp. | 1 | 0.008 | 0.01 ± 0.11 (1) | C | S | - | |
| Dasyatidae | Hypanus berthalutzae (Petean, Naylor & Lima, 2020) | 17 | 0.141 | 0.22 ± 0.41 (1) | C | SW, SP, S | DD | |
| Hypanus marianae (Gomes, Rosa & Gadig 2000) | 1 | 0.008 | 0.01 ± 0.11 (1) | C | S | DD | ||
| Hypanus sp. | 10 | 0.083 | 0.13 ± 0.33 (1) | C | SW, SP, S | - | ||
| Ginglymostomatidae | Ginglymostoma cirratum (Bonnaterre 1788) | 1 | 0.008 | 0.01 ± 0.11 (1) | C | S | DD | |
Sum MaxN: sum of maximum number of individuals in the camera field of view at the same time. MaxN h-1: relative abundance calculated by the maximum number of individuals of each species in the camera field of view at the same time per hour of sampling. Mean MaxN ± SD: mean of MaxN ± standard error (number in parenthesis indicate minimum and maximum numbers of individuals recorded). TP: trophic position (C= Carnivore; H= Herbivore; Om= Omnivore), Habitat type (S: sediment; SW: sediment in shipwreck area; SP: sediment with phytobenthos) and IUCN status (VU= Vulnerable; NT= Near Threatened; LC= Least Concern; DD= Data Deficient). ** indicates species not observed in previous studies.
The Clupeidae family was dominant in number of individuals, representing 39.6 % of all organisms recorded (10.81 h-1). Haemulidae represented 32.8 % (8.94 h-1), Carangidae 7.7 % (2.11 h-1), Lutjanidae 4.6 % (1.26 h-1), and the remaining families 15.3 % (Fig. 4, Table 1). Haemulidae was the most diverse family (10 species), followed by Carangidae (6), Lutjanidae (5), Monacanthidae (4) and Acanthuridae (3) (Table 1).
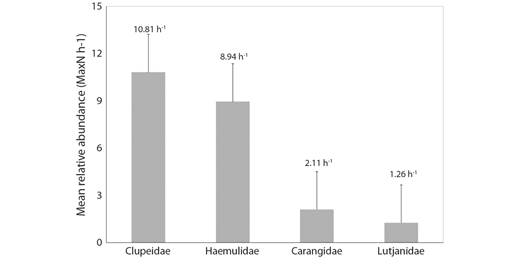
Fig. 4 Mean relative abundance of individuals per hour of sampling (MaxN h-1) of the most representative families recorded in BRUVS surveys in the Metropolitan Region of Recife.
Teleosts represented the majority of specimens observed (3 256 individuals). Haemulon aurolineatum was the predominant species in numbers (679 individuals, 5.62 h-1), followed by Opisthonema oglinum (507, 4.19 h-1), Haemulon steindachneri (267, 2.21 h-1), Lutjanus synagris (137, 1.13 h-1) and Caranx crysos (110, 0.91 h-1) (Fig. 5, Table 1). The most common species was L. synagris, recorded in 56 samples, followed by H. steindachneri (N = 34), C. crysos (N = 32) and H. aurolineatum (N = 30). Ten species (Table 1) were not observed in previous local ichthyofaunal surveys: Chloroscombrus chrysurus, Caranx ruber, Seriola rivoliana, Eucinostomus sp., Anisotremus surinamensis, Anisotremus moricandi, Orthopristis ruber, Aluterus schoepfii, Lactophrys trigonus and Lagocephalus laevigatus (Table 1). Most species recorded (65 %, N = 42) were carnivore, 14 % (N = 9), followed by omnivore and 21 % (N = 5) herbivore (Table 1).
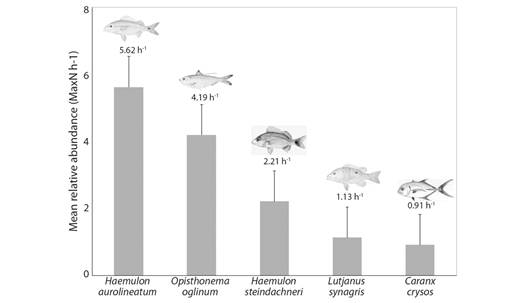
Fig. 5 Mean relative abundance of individuals per hour of sampling (MaxN h-1) of the more common species recorded in BRUVS surveys in the Metropolitan Region of Recife in November 2017.
Thirty elasmobranch specimens (0.8 % of the total number), including two sharks and 28 rays, were recorded in 29 (36.7 %) of the deployments. Sharks were recorded in two samples (2.5 %) and rays in 27 (34.2 %). Two different species of sharks were recorded: Ginglymostoma cirratum and a shark of the genus Carcharhinus that could not be identified at species level due to poor water visibility. Two species of rays were identified: Hypanus berthalutzae (N = 17) and Hypanus marianae (N = 1). The remaining 10 specimens of rays observed belonged to the genus Hypanus, but could not be identified at species level (Table 1).
The highest mean number of species was observed over Sediment in shipwreck area (Sed + wreck), which was significantly higher than that observed in Sediment (Sed) (F = 17.83, P = 0.00008), but not than Sediment with phytobenthos (Sed + phytob) (F = 4.196, P = 0.0562) (Table 2, Fig. 6). The mean number of species observed between the habitat types Sediment and Sediment with phytobentos was not statistically different (F = 2.998, P = 0.0875). Although the mean number of individuals was higher in Sediment, the differences between habitat types were not statistically significant (Table 2). Values of Pielou’s evenness (J’) and Shannon-Wiener diversity (H’) are presented in Table 2.
Table 2 Total number of samples and species in each habitat type, depth and underwater visibility ranges recorded in BRUVS surveys in the Metropolitan Region of Recife in November 2017
| Factors (NS; ST) | NSP | Sp MaxN h-1 ± SD | NI | Ind MaxN h-1 ± SD | NT | Teleosts MaxN h-1 ± SD | NE | Elasmo MaxN h-1 ± SD | J’ | H’ |
| Habitat type | ||||||||||
| Sediment with phytobenthos (16, 1 428) | 45 | 4.68 ± 2.95 | 705*475 | 29.50 ± 25.94*19.71 ± 16.02 | 695*465 | 19.09 ± 15.58 | 10 | 0.42 ± 0.41 | 0.55 | 2.10 |
| Sediment (60, 5 549) | 44 | 3.60 ± 1.99 | 1 960*1 160 | 22.08 ± 73.50*13.09 ± 16.98 | 1 942*1 142 | 12.89 ± 16.96 | 18 | 0.20 ± 0.31 | 0.58 | 2.19 |
| Sediment in a shipwreck area (3, 277) | 34 | 9.55 ± 7.47 | 634*134 | 143.53 ± 228.21*29.90 ± 31.41 | 632*132 | 29.45 ± 31.18 | 2 | 0.44 ± 0.39 | 0.33 | 1.17 |
| Depth | ||||||||||
| 10-15 m (9, 933) | 33 | 3.04 ± 3.60 | 182 | 12.36 ± 17.87 | 179 | 3.80 ± 17.87 | 3 | 0.19 ± 0.31 | 0.69 | 2.38 |
| 15.1-20 (37, 3 483) | 38 | 3.10 ± 1.65 | 777*677 | 14.01 ± 21.21*12.15 ± 19.11 | 765*665 | 5.93 ± 18.88 | 12 | 0.21 ± 0.35 | 0.69 | 2.53 |
| 20.1-25 m (23, 2 047) | 59 | 6.11 ± 3.05 | 2 167*737 | 63.91 ± 137.07*21.83 ± 15.40 | 2 154*724 | 19.57 ± 15.58 | 13 | 0.38 ± 0.35 | 0.52 | 2.11 |
| 25.1-30 m (9, 791) | 20 | 3.78 ± 1.77 | 172 | 12.81 ± 13.01 | 170 | 5.07 ± 12.79 | 2 | 0.15 ± 0.30 | 0.72 | 2.14 |
| Underwater visibility | ||||||||||
| < 1 m (21, 2 057) | 62 | 1.58 ± 1.22 | 303*203 | 9.74 ± 17.07*6.46 ± 10.23 | 298*198 | 2.14 ± 10.14 | 5 | 0.15 ± 0.29 | 0.94 | 2.84 |
| 2-3 m (29, 2 586) | 168 | 3.95 ± 2.32 | 668*538 | 15.47 ± 17.97*12.45 ± 12.70 | 659*529 | 6.66 ± 12.50 | 9 | 0.21 ± 0.36 | 0.96 | 3.23 |
| 4-5 m (19, 1 712) | 165 | 5.85 ± 3.39 | 1 232*732 | 44.03 ± 91.12*26.09 ± 25.87 | 1 221*721 | 18.91 ± 25.90 | 11 | 0.39 ± 0.34 | 0.95 | 2.82 |
| > 6 m (10, 899) | 83 | 5.56 ± 1.43 | 1 096*296 | 73.74 ± 163.64*19.81 ± 11.24 | 1 091*291 | 16.31 ± 11.22 | 5 | 0.34 ± 0.36 | 0.98 | 2.27 |
NS: total number of samples. ST: total soak time in minutes. NSP: total number of species. Sp MaxN h-1: maximum number of species per hour of sampling ± standard error. NI: total number of individuals. Ind MaxN h-1: maximum number of individuals per hour of sampling, including schools of fishes. NT: total number of teleosts. Teleosts MaxN h-1: maximum number of teleosts per hour of sampling ± standard error. NE: total number of elasmobranchs. Elasmo MaxN h-1: maximum number of elasmobranchs per hour of sampling ± standard error. J’: Pielou’s evenness index. H’: Shannon-Wiener diversity index. *Represent the number used in the calculations, excluding fishes in schools.
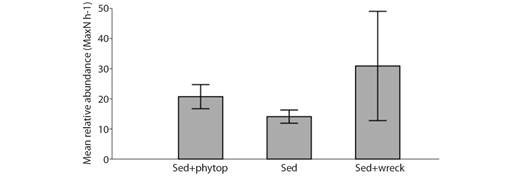
Fig. 6 Mean relative abundance of individuals per hour of sampling (± SE) (MaxN h-1) observed in BRUVS surveys in different habitat types (Sediment with phytobenthos, Sediment, and Sediment in shipwreck area) of the Metropolitan Region of Recife in November 2017.
Among teleosts, 1 942 were recorded over sediment (Sed), 695 over sediment with phytobenthos (Sed+phytob), and 632 over sediment in shipwreck area (Sed + wreck) (Table 2). Despite the large difference in the total number of teleosts by habitat type, the mean teleosts MaxN h-1 was not different between habitat types (X2 = 4.965, P = 0.0835). Eighteen elasmobranchs were recorded over sediment, 10 over sediment with phytobenthos, and two over sediment in shipwreck area (Table 2). Despite the large difference in the total number of elasmobranchs by habitat type, mean elasmobranch MaxN h-1 was not different between habitat types (X2 = 3.072, P = 0.1262).
The highest number of species and individuals were observed between 20.1 and 25 m, which was significantly higher than those observed in other ranges: 10-15 m (F = 9.27, P = 0.0047), 15.1-20 m (F = 12.94, P = 0.0006) and 25.1-30 m (F = 5.196, P = 0.0299) (Fig. 7). The mean number of species per sample was also significantly higher in that depth range: 10-15 m (F = 16.77, P = 0.0002), 15.1-20 m (F = 29.76, P = 0.000001) and 25.1-30 m (F = 7.635, P = 0.0096). Values of Pielou’s evenness (J’) and Shannon-Wiener diversity (H’) for depth range are given in Table 2. Forty-one samples (55 %) contained up to 5 different species, whereas 26 samples (35 %) contained 6 to 10 species, 5 (7 %) had 11 to 15 species, and only three samples (4 %) had more than 16 species (two of them located in shipwreck sites). Teleosts and elasmobranchs sightings per depth range are shown in Table 2. The mean number of teleosts per hour (MaxN h-1) was higher between 20.1 and 25 m compared to 10-15m depth strata (F = 5.475, P = 0.0378) and 15.1-20 m depth strata (F = 12.88, P = 0.0007). No differences were observed between other depth ranges: 10-15 m and 15.1-20 m (X2 = 0.6193, P = 0.4313), 10-15 m and 25.1-30 m (X2 = 0.6667, P = 0.4142), 15.1-20 m and 25.1-30 m (X2 = 0.0089, P = 0.9246), 20.1-25 m and 25.1-30 m (X2 = 2.455, P = 0.1172). There were no differences in the mean elasmobranch MaxN h-1 per depth strata (X2 = 3.948, P = 0.1513).
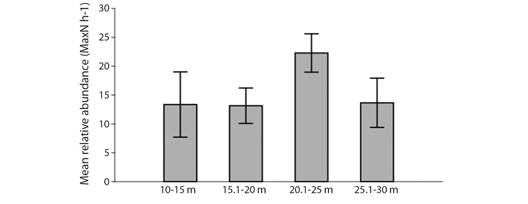
Fig. 7 Mean relative abundance of individuals per hour of sampling (± SE) (MaxN h-1) observed in BRUVS surveys in different depth ranges (10-15 m, 15.1-20 m, 20.1-25 m, and 25.1-30 m) of the Metropolitan Region of Recife in November 2017.
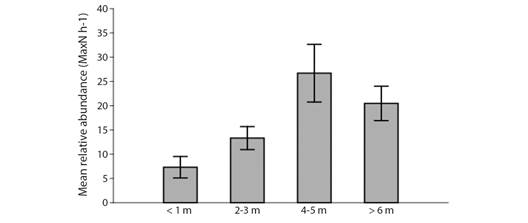
The highest mean number of species was observed in the visibility of 2-3 m, with no significant differences between the 4-5 m (F = 0.478, P = 0.499) and with significant differences to the visibilities < 1 m (F = 6.326, P = 0.0189) and > 6 m (F = 8.428, P = 0.0175). On the other hand, the highest number of individuals was recorded in the 4-5 m visibility, with significant differences in the 2-3 m visibility (F = 8.095, P = 0.0112) and no significant differences to the < 1 m (F = 1.725, P = 0.207) and > 6 m categories (F = 0.391, P = 0.549) (Fig. 8, Table 2). Values of Pielou’s evenness (J’) and Shannon-Wiener diversity (H’) for visibility classes are given in Table 2. The highest mean number of teleosts per hour (MaxN h-1) were observed in the visibility of 4-5 m, with significant differences in the visibilities < 1 m (F = 26.95, P = 7.356x10⁻⁶) and 2-3 m (F = 7.825, P = 0.008), and no differences in the > 6 m visibility. The other combinations were significant different: < 1 m and 2-3 m (F = 9.346, P = 0.004), < 1 m and > 6 m (F = 26.71, P = 1.783x10⁻⁵), 2-3 m and > 6 m (F = 7.24, P = 0.0129). There were no significant differences (X2 = 15.022, P = 0.001798) for the mean elasmobranch MaxN h-1 per visibility class.
Discussion
Most of the previous reef fishes studies in the Metropolitan Region of Recife (MRR) have focused on shipwrecks, due to the large number of ships intentionally sunk to create artificial reefs and the high abundance of species associated with this environment (Coxey, 2008; Fischer, 2009; Oliveira, 2012). The number of fish species reported by investigations employing visual censuses ranged from 65 to 97, with sampling efforts ranging from 180 to 1 800 min (Coxey, 2008; Fischer, 2009; Oliveira, 2012). The present study recorded 65 taxa in 11 days, with a much larger sampling effort of 7 254 min, and the detection of ten species not observed in those previous investigations. Our calculated ecological indices were similar to those calculated by Fischer (2009) and Oliveira (2012), and the BRUVS were effective to not only record carnivores and omnivores, but also a few herbivores species, as reported elsewhere (Harvey et al., 2007; Gomelyuk, 2009; Schmid et al., 2017). Thus, results further demonstrate the efficacy of this technique to assess fish assemblages, employing short temporal sampling periods and higher effort, and covering larger areas than underwater visual census techniques.
The high relative abundance of Haemulidae found in the present study, with the families Haemulidae, Carangidae and Lutjanidae being the most representative (70 % of the total) also corroborate the results of previous studies in MRR (Coxey, 2008; Fischer, 2009; Oliveira, 2012). Lower-level carnivores, represented here by Haemulon aurolineatum, H. steindachneri, Lutjanus synagris and Caranx crysos are the dominant components of temperate and tropical reefs, both in species richness and biomass (Ferreira et al., 2004; Jones et al., 1991; Morais et al., 2017; Wainwright & Bellwood, 2002). H. aurolineatum is dominant from Northeastern to Southern Brazil, H. steindachneri is mainly restricted to high latitudes and coastal habitats, and Caranx has been regarded as the main representative genus of Carangidae along the Brazilian coast (Ferreira et al., 2004; Reis-Filho et al., 2019). Lutjanidae are distributed on tropical and subtropical reefs up to 450 m depth (Allen, 1985) and are highly fished off Northeastern Brazil (Ferreira & Frédou, 2005; Reis-Filho et al., 2019; Santos, 2001). Additional efforts are needed to investigate whether the absence of large specimens of many species and the scarcity of top predators such as sharks, large groupers and large Lutjanidae species are an indicative of the impoverished state of MRR’s fish fauna. This fact has been reported by Reis-Filho et al. (2019) in a large coastal bay in Northeastern Brazil and seems to be common in sites close to heavily urbanised areas.
Previous investigations using fisheries techniques in MRR have demonstrated the occurrence of 11 species of sharks and six species of rays (Afonso et al., 2014; Afonso et al., 2017; Hazin et al., 2000). Only two species of sharks and two species of rays previously recorded in MRR were observed in the present study. Earlier fisheries independent surveys also corroborate the low shark density recorded by BRUVS in MRR (Afonso et al., 2017; Hazin et al., 2000; Niella et al., 2017). Niella et al. (2017) have shown a peak of abundance of sharks from May to August in MMR and additional surveys focusing elasmobranchs are needed to investigate their seasonal abundance.
Structural complexity is a strong predictor of reef fish abundance and species richness (Darling et al., 2017; Gratwicke & Speight, 2005), and this explains the highest mean number of species observed close to the more complex structures of shipwrecks in MRR. However, no differences were found in the mean number of individuals between habitat types. Reef fish communities are strongly influenced by depth with effects on abundance and species richness, among other attributes (Asher et al., 2017; Mac Donald et al., 2016; Pereira et al., 2018). Deep reefs are currently considered to be less susceptible to local disturbances, such as overfishing and pollution, when compared to shallower ones (Lesser et al., 2009; Lindfield et al., 2014). We observed the highest number of species, specimens, and the mean number of species per sample in the 20.1-25 m depth range. Although further studies are needed to evaluate depth effects in MRR, this higher abundance might reflect lower disturbance levels caused by depth and distance from the shoreline.
Since the MRR is located between two estuaries, water turbidity is commonly high and most of the BRUVS deployments (64 %) had less than 3 m of underwater visibility. Notwithstanding, studies of nektonic assemblages using BRUVS have been efficiently carried out in regions with low visibility (Cappo et al., 2003; Gomelyuk, 2009; Whitmarsh et al., 2014), as corroborated here. Although the poor visibility has not compromised the performance of the present study, it has hindered identification of species in sites closer to the shoreline, even at the time of the year when visibility is supposed to be at its best. Thus, visibility should be taken into account when planning future surveys closer to the shoreline, as it may potentially preclude or reduce species identification, especially during the heavy rains of the austral winter.
Overall, this first use of BRUVS in MMR provided a baseline on the local the species richness and relative abundance. We recommend future research and monitoring programs to evaluate the influence of seasonal distribution of the local fish fauna using a combination of BRUVS and techniques such as visual censuses and fisheries dependent and independent surveys. Results also attest the relatively degraded condition of MRR reef environments except for the shipwrecks that showed a greater diversity of species, even though usually represented by solitary individuals. Top predators are rare, and few species were detected in most sites, with the predominance of one medium (Caranx crysos) and three small-sized (genera Lutjanus and Haemulon) mesopredators. The low species abundance and absence of top predators call the attention for actions aimed at the local coastal management, including the recovery and conservation of the reef ecosystems and its fish fauna.
Ethical statement: the authors declare that they all agree with this publication and made significant contributions; that there is no conflict of interest of any kind; and that we followed all pertinent ethical and legal procedures and re-quirements. All financial sources are fully and clearly stated in the acknowledge-ments section. A signed document has been filed in the journal archives.

