


 Inglês (pdf)
 Artigo em XML
 Referências do artigo
 Enviar este artigo por email
 Citado por SciELO
  Similares em
SciELO
Similares em
SciELO  uBio
uBio 
 Permalink
Introduction
Brazil has a high potential for the production of numerous varieties of fruits due to its territorial extension, varied types of soils, and climatic conditions (Carvalho et al., 2017). It also has a great diversity of native fruits, many of them still unknown or little exploited commercially, but that have increasing market value, among which is the yellow mombin (Spondias mombin L.) (Freitas & Mattietto, 2013). This tree species belongs to the family Anacardiaceae and its fruit stands out for its sensory and functional qualities (Pinto et al., 2003). In addition, the fruit has high levels of carotenoids, tannins and phenolic compounds, and is considered a natural source of antioxidants (Freitas & Mattietto, 2013; Mattietto et al., 2010). S. mombin is among the Brazilian species that has the greatest economic potential (Lederman et al., 2008); however, it is in a domestication phase, and information that would assist in the deployment of viable commercial orchards is scarce (Souza et al., 2006). The type of exploitation, the lack of commercial crops and the high loss of fruits during harvest and transport cause annual variations in the harvests, which directly influence its industrialization and functioning of the fruit processing industries (Santana, 2010).
The domestication and incorporation of native species into productive systems require information on genetic variation and knowledge of the size and distribution of genetic variability in natural populations (Costa et al., 2011). In addition, knowledge of the genetic structure of populations and their levels of genetic diversity are important in order to understand how selection acts as a function of adaptability and how the effects of environmental fragmentation may influence population dynamics, thus helping to guide more efficient breeding and conservation programs (Estopa et al., 2006; Sujii et al., 2015).
Genetic diversity can be verified through morphological, agronomic, molecular characteristics, among others (Dardengo et al., 2021; Giles et al., 2018; Giustina et al., 2017; Santos et al., 2020). However, molecular techniques make it possible to accelerate the process of analysis of variability and selection especially when working with perennial species, since they do not require the plant to complete its reproductive cycle, do not suffer interference from the environment and, in addition, have high efficiency for material discrimination (Ferreira & Grattapaglia, 1998).
Recently, some studies have contributed to the characterization of the Spondias genus through molecular phylogeny (Silva et al., 2015; Machado et al., 2015), and much information is now available in GenBank. For S. mombin, the assembly of the complete chloroplast genome (Santos & Almeida, 2019) and its mitochondria (Martins et al., 2019) has already been obtained. The genetic diversity of S. mombin has been evaluated by means of isoenzymes (Gois et al., 2009), morphological traits of the fruits (Silva et al., 2017a), molecular markers, RAPD (Lima et al., 2011) and ISSR (Silva et al., 2017b). However, no studies are available regarding the diversity and genetic structure based on microsatellite molecular markers.
Microsatellites are one of the most polymorphic classes of molecular markers available today and have advantages over other markers based on PCR (polymerase chain reaction) because they are codominant, highly reproducible, require small amounts of DNA, and have high resolution power and high levels of polymorphism (Caixeta et al., 2016). The greatest limitation to the use of this type of marker is the lack of initiators available for all species, since the marker is specific (Arnold et al., 2002) as well as the great amount of work required for the development and isolation of loci containing these markers (Zane et al., 2002). However, the flanking regions of microsatellites are generally conserved between nearby species or genera (Arnold et al., 2002; Caixeta et al., 2016), thus enabling the transferability of these markers between some species. Aguilar-Barajas et al. (2014) were able to select 14 polymorphic microsatellites for Spondias radlkoferi Donn. Sm., of which 12 were successfully transferred to S. mombin, which enabled its use in diversity studies of this species.
Due to an increase in the demand for the fruits of S. mombin and the lack of knowledge that would assist in the implementation of commercial plantations in the future, especially with regard to understanding of the genetic diversity that the species possesses, this study aimed to evaluate, by means of microsatellite molecular markers, the diversity and genetic structure of natural populations of S. mombin, in the state of Mato Grosso, Brazil.
Materials and methods
Study area: The study was conducted in 10 municipalities in the state of Mato Grosso. In each municipality, an area in which the species naturally occurred was selected. Each selected area was evaluated as a natural population of S. mombin. We sampled 139 individuals distributed as follows: Alta Floresta (AF) 19, Apiacás (AP) 7, Cáceres (CC) 15, Colíder (CL) 14, Marcelândia (MR) 18, Nobres (NB) 8, Nova Bandeirantes (NA) 18, Porto Estrela (PE) 15, Tangará da Serra (TS) 17 and Vila Bela da Santíssima Trindade (VB) 8. All the sampled areas have strong anthropogenic influence, with isolated trees in the middle of the pasture matrix, in the urban matrix or in disconnected forest fragments. The sampled populations of S. mombin come from the three biomes that exist in the state of Mato Grosso, namely the Amazon, Pantanal and Cerrado biomes, according to the delimitation of biomes proposed by the Ministry of the Environment (2018).
The Amazon is one of the biomes with the greatest richness of species in the world, but it is also marked by environmental degradation. The Amazon region where sample collections were carried out has mostly an Am-type climate, with defined dry and rainy seasons, a mean annual temperature above 26 °C and annual rainfall capacity of between 2 500 to 3 100 mm (Alvares et al., 2013).
The Pantanal biome is a large wetland mainly located in Brazil. It has natural resources of great importance, but is one which has been put at risk due to unsustainable land use and occupation practices, such as the conversion of natural vegetation into cultivated areas and pastures (Bergier et al., 2018). The region where the sample collections were carried out has an Aw-type climate, with annual precipitation ranging from 1 300 to 1 600 mm and a mean annual temperature of 24 to 26 °C (Alvares et al., 2013).
The Cerrado is the biome that occupies 20 % of the Brazilian territory; however, it is extremely anthropized and much of the original cover has been replaced by pasture areas or temporary crops such as soybeans, maize and rice (Duarte & Leite, 2020). The sample collection region has an Aw-type climate, with annual precipitation ranging from 1 900 to 2 200 mm and a mean annual temperature of 24 °C (Alvares et al., 2013).
Collection of plant material and DNA extraction: Sampling of populations was carried out by randomly prioritizing individuals of reproductive age and with greater geographical distance from each other. Leaf material was collected from each selected individual with a preference for young leaves, without damage and/or signs of disease. Control material was herborized and deposited in the Southern Amazon Herbarium - HERBAM, Mato Grosso State University, Alta Floresta, MT, according to the methodology of Fidalgo and Bonomi (1989) and under the registry numbers: 15 289, 15 290, 15 291, 15 292 and 15 293.
The total genomic DNA was extracted from approximately 100 mg of the foliar material following the CTAB method described by Doyle and Doyle (1987), with modifications for the species: an increase in the concentration of Polyvinylpyrrolidone (PVP) from 1 to 2 % and of β-mercaptoethanol from 0.2 to 1.8 %, an addition of 0.4 % proteinase K in the extraction buffer, reduction of the incubation time in a water bath from 60 minutes to 30 minutes, while maintaining the temperature at 65 °C.
Genotyping: Amplifications were performed via PCR using seven microsatellite markers developed by Aguilar-Barajas et al. (2014) for Spondias radlkoferi and with proven transfer to S. mombin. The reactions were performed in a final volume of 10 µl, containing 1.5 µL buffer 10x (100 mM Tris-HCl pH 8.3; 500 mM KCl), 1.5 mM MgCl2, 0.2 mM of each dNTP, 0.5 µM of each primer (F and R); 0.12 µL of Taq DNA polymerase (5 U/µL); 20 ng of DNA and ultrapure water. Amplifications were conducted using an AerisTM thermocycler (Esco®) following the method described by Aguilar-Barajas et al. (2014).
The primers were marked using different fluorochromes to allow the analysis of the PCR products through duplex and triplex systems in an automatic sequencer (model ABI 3 730, Applied Biosystems). The amplified fragments were detected using the software GeneMarker V. 2.6.3. The fragment size information was used to assemble the matrix with each primer pair for each individual, which was subjected to analysis of the diversity and genetic structure.
Data analysis: The genetic diversity of S. mombin populations was characterized as the total number of alleles, number of alleles per locus (Na), observed heterozygosity (Ho) and expected (He) in Hardy-Weinberg equilibrium and polymorphic information content (PIC). The inbreeding coefficient (ƒ) was also calculated according to the method by Weir and Cockerham (1984) for each population and for each locus. These analyses were performed with the aid of Power Marker software v. 3.25 (Liu & Muse, 2005). Alleles were classified according to their frequency and occurrence. As for the frequency, alleles with a frequency equal to or less than 0.05 were considered rare, and those that were common were those with a frequency greater than 0.05 (Sebbenn, 2003). Regarding occurrence, alleles were considered to be widely distributed if they were found in more than 25 % of the populations, and of local distribution if they were found in less than 25 % of the analyzed populations (Sebbenn, 2003). Alleles that occurred in only one population, regardless of frequency, were considered exclusive. For each population, the rare and exclusive alleles were classified. The classification proposed by Sebbenn (2003) was used for local rare, widely distributed rare, local common and widely distributed common alleles.
The analysis of molecular variance (AMOVA) was used to infer the genetic structure of populations and was performed according to Excoffier et al. (1992) with the aid of Arlequin 3.01 software (Excoffier et al., 2006). The gene flow (Nm) was obtained in the PopGene program 1.32 (Yeh et al., 1999), via the equation: Nm = 0.25 (1 - FST)/FST. The matrix of the genetic distance values of Nei et al. (1983) among populations generated by the Power Marker Program v. 3.25 was imported into the GENES program (Cruz, 2016) for the construction of the dendrogram using the UPGMA method (Unweighted Pair-Group Method with Arithmetic Averages). This grouping method was chosen because it was the one that best represented the genetic variation under study, based on the value of the cophenetic correlation coefficient (CCC), stress and distortion. To verify whether there was a correlation between genetic similarity and geographical distance in the different populations analyzed, a Mantel test was performed, with 10 000 permutations, using the Genes software (Cruz, 2016).
The Structure program (Pritchard et al., 2000), based on Bayesian statistics, was used to infer the number of groups (k). Twenty runs were performed for each k value (1 to 13), 200 000 burn-ins and 500 000 Markov chain Monte Carlo (MCMC) simulations. The criteria proposed by Pritchard & Wen (2004) and also the criterion proposed by Evano et al. (2005) were used to define the most probable K in relation to those proposed, and the results were uploaded to the Structure Harvester site (Earl & von Holdt, 2012).
Results
Genetic diversity of S. mombin: The seven microsatellites used from S. mombin amplified a total of 46 alleles, ranging from 5 to 10 and averaging 6.6 alleles per locus. The PIC ranged from 0.048 (SPO21) to 0.700 (SPO40) with an average of 0.317. He was higher than Ho for six loci and presented means of 0.335 and 0.300 respectively. The fixation index was positive and different from 0, indicating a higher number of homozygotes in the loci and presence of inbreeding. Only locus SPO18 presented a negative value for ƒ (Table 1).
Table 1 Estimation of the genetic diversity of S. mombin obtained in seven microsatellite loci
| Locus | Repeat motif | N | Na | PIC | He | Ho | ƒ |
| SPO3 | (TTAA)6 | 134 | 5 | 0.185 | 0.193 | 0.164 | 0.153 |
| SPO12 | (CTT)10 | 135 | 10 | 0.250 | 0.256 | 0.178 | 0.310 |
| SPO18 | (CT)9 | 126 | 6 | 0.294 | 0.316 | 0.350 | -0.103 |
| SPO21 | (CT)6 | 124 | 5 | 0.048 | 0.048 | 0.024 | 0.495 |
| SPO22 | (AT)9 | 137 | 7 | 0.470 | 0.500 | 0.445 | 0.111 |
| SPO31 | (AAT)9 | 136 | 6 | 0.272 | 0.294 | 0.287 | 0.028 |
| SPO40 | (ATGT)7 | 99 | 7 | 0.700 | 0.742 | 0.646 | 0.134 |
| Mean | 127.28 | 6.6 | 0.317 | 0.335 | 0.300 | 0.112 |
N: number of individuals used in the analysis, except for missing data; Na: number of alleles; PIC: polymorphism information content; He: expected heterozygosity; Ho: observed heterozygosity; ƒ: fixation index.
The mean number of alleles found per population was 18.3, among which the Cáceres population (CC) presented the highest number of alleles. The highest number of heterozygotes, estimated by the fixation index, was found in Nobres (NB) and the highest number of homozygotes in the Tangará da Serra population (TS). This result for TS is also observed by the lower Ho value. The PE and TS populations presented a higher rate of inbreeding compared to the other populations (Table 2).
Table 2 Estimation of the genetic diversity of S. mombin populations obtained using seven microsatellite loci
| Population | N | Na | PIC | He | Ho | ƒ |
| AF | 19 | 23 | 0.340 | 0.380 | 0.354 | 0.095 |
| AP | 7 | 17 | 0.368 | 0.486 | 0.833 | -0.245 |
| CC | 15 | 24 | 0.326 | 0.359 | 0.349 | 0.073 |
| CL | 14 | 21 | 0.305 | 0.375 | 0.500 | -0.076 |
| MR | 18 | 20 | 0.279 | 0.314 | 0.344 | -0.064 |
| NB | 8 | 15 | 0.465 | 0.211 | 0.298 | -0.351 |
| NA | 18 | 16 | 0.482 | 0.251 | 0.284 | -0.091 |
| PE | 15 | 17 | 0.228 | 0.263 | 0.227 | 0.187 |
| TS | 17 | 16 | 0.224 | 0.250 | 0.169 | 0.357 |
| VB | 8 | 14 | 0.174 | 0.199 | 0.235 | -0.115 |
| Total/Species | 139 | 46 | 0.317 | 0.335 | 0.300 | 0.112 |
N: number of individuals used in the analysis, except for missing data; Na: number of alleles; PIC: polymorphism information content; He: expected heterozygosity; Ho: observed heterozygosity; ƒ: fixation index.
In the evaluation of the general allelic frequency for the 10 populations, 10 local rare alleles, 13 local common alleles and 23 widely distributed common alleles were found. By evaluating the allelic frequency by populations, we found 27 rare alleles (frequency < 0.05), distributed in 8 of the 10 populations of S. mombin analyzed. The population Caceres (CC) and Alta Floresta (AF) had the highest numbers of rare alleles (Table 3). In all, 16 unique alleles were found, that is, they appeared in only one of the 10 populations. The highest number of exclusive alleles was found in the AF population (Table 3).
Table 3 Rare and unique alleles found in the populations of S. mombin for the 7 loci microsatellites
| Population | Rare alleles | Exclusive alleles |
| AF | 6 | 4 |
| AP | 0 | 2 |
| CC | 7 | 2 |
| CL | 3 | 3 |
| MR | 2 | 1 |
| NB | 2 | 0 |
| NA | 2 | 0 |
| PE | 3 | 3 |
| TS | 2 | 1 |
| VB | 0 | 0 |
| Total | 27 | 16 |
Genetic structure of natural populations of S. mombin: The analysis of molecular variance showed that there was significant genetic differentiation (P < 0.000) among populations and that the largest component of variation was within populations (90.64 %) (Table 4). The estimated gene flow was 1.99, which indicates that there is no genetic isolation among populations. The FST value (0.0963) demonstrates that there is little genetic differentiation among populations. Thus, it appears that the gene flow maintained low differentiation among populations.
Table 4 Analysis of molecular variance (AMOVA) of the 10 populations of S. mombin studied from 7 microsatellite markers
| Source of variation | D.f. | SS | CV | TV (%) | p value |
| Among populations | 9 | 31.686 | 0.112 | 9.36 | < 0.000 |
| Within populations | 268 | 257.646 | 1.084 | 90.64 | |
| Total | 277 | 289.332 | 1.196 |
D.f.: Degrees of freedom; SS: sum of squares; CV: coefficient of variation; TV: total variation; p: are the probabilities of having a component of variance greater than the values observed at random. The probabilities were calculated by 1 023 random permutations. FST = 0.0963.
The UPGMA dendrogram provided the formation of two groups, the first group (GI) formed by 8 populations and the second group (GII) by 2 populations. The populations for Alta Floresta (AF) and Marcelândia (MR) were isolated in GII (Fig. 1).
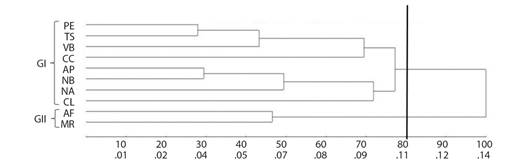
Fig. 1 UPGMA dendrogram generated from the matrix of genetic distance by Nei et al. (1983), and based on data from seven microsatellite loci for 10 natural populations of S. mombin. CCC = 0.78; distortion = 3.79 %; stress = 19.47 %.
The Bayesian analysis obtained by the Structure program, grouped the 139 individuals of S. mombin into two groups (k = 2). The contribution of each population to the groups generated by the Structure program can be verified in Fig. 2A and Fig. 2B. The populations of Alta Floresta (AF) and Marcelândia (MR) presented greater contribution to the red group and the rest of the populations presented greater contribution to the green group. This grouping is in accordance with the UPGMA dendrogram, where the AF and MR populations are more genetically similar, and form a separate group from the other populations. This structure demonstrates that genetic variation between populations is lower than within populations and agrees with the result of AMOVA.
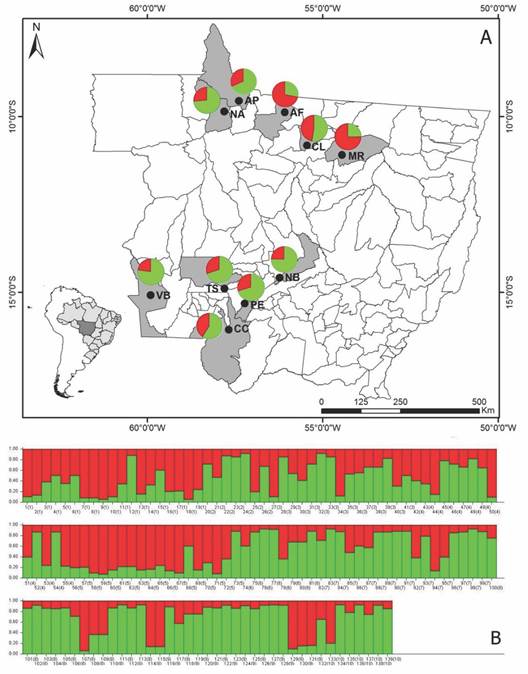
Fig. 2 Grouping analysis and geographical distribution of the groups generated by the Structure program. A. Each population is represented by a graph, the colors indicate the proportion of contribution of each Spondias mombin population to the groups formed in the Structure program (K = 2). B. Distribution of the two genetic groups generated by the Structure program. The vertical lines along the X axis represent the individuals and the colored segments along the Y axis demonstrate the coefficient of association of each individual assigned to each of the inferred K. Numbers within parentheses correspond to populations. 1: AF (Alta Floresta); 2: AP (Apiacás); 3: CC (Cáceres); 4: CL (Colider); 5: MR (Marcelândia); 6: NB (Nobres); 7: NA (Nova Bandeirantes); 8: PE (Porto Estrela); 9: TS (Tangará da Serra); 10: VB (Vila Bela da Santíssima Trindade).
The genetic structure of S. mombin is not determined by the geographical structure, since the most genetically similar populations are not the closest geographically speaking. This result is supported by the Mantel test, which revealed a negative correlation (-0.158) and was not significant between the matrices of genetic similarity and geographical distance. To better illustrate this result, one can cite the example of the AF population that in the analyses is grouped with the MR population that is geographically further than the AP, CL and NA populations (Fig. 2A and Table 5).
Table 5 Genetic distance matrix* by Nei et al. (1983) and geographical distances** (Km) among the 10 natural populations of S. mombin
| AF | AP | CC | CL | MR | NB | NA | PE | TS | VB | |
| AF | ---- | 0.146 | 0.147 | 0.188 | 0.066 | 0.128 | 0.095 | 0.150 | 0.131 | 0.167 |
| AP | 154 | ---- | 0.134 | 0.116 | 0.148 | 0.042 | 0.083 | 0.140 | 0.126 | 0.098 |
| CC | 705 | 718 | ---- | 0.107 | 0.146 | 0.096 | 0.101 | 0.093 | 0.098 | 0.105 |
| CL | 126 | 253 | 632 | ---- | 0.168 | 0.079 | 0.112 | 0.164 | 0.156 | 0.093 |
| MR | 220 | 359 | 655 | 102 | ---- | 0.107 | 0.087 | 0.170 | 0.136 | 0.163 |
| NB | 528 | 570 | 225 | 432 | 439 | ---- | 0.058 | 0.105 | 0.100 | 0.069 |
| NA | 192 | 62 | 677 | 270 | 376 | 540 | ---- | 0.096 | 0.074 | 0.101 |
| PE | 650 | 674 | 68 | 570 | 588 | 157 | 630 | ---- | 0.040 | 0.068 |
| TS | 588 | 584 | 130 | 524 | 560 | 174 | 544 | 104 | ---- | 0.055 |
| VB | 714 | 680 | 261 | 685 | 733 | 403 | 620 | 298 | 231 | ---- |
*Genetic distance above the diagonal. **Geographical distances (Km) below the diagonal.
Discussion
The polymorphism found in all the analyzed loci indicate the presence of genetic diversity in the analyzed populations. The mean number of alleles per locus found in this study was higher than that found by Aguilar-Barajas et al. (2014) for the same loci in 20 individuals from S. mombin in Mexico. These authors tested the transfer of SSR primers developed for S. radlkoferi in S. mombin and found an average of 6.4 alleles per locus, with a range of 5 to 7 alleles per locus. The increase in the mean of alleles per locus in this study may be a result of the sizable genetic difference between the individuals evaluated and the greater geographical distance between the areas sampled.
The expected and observed heterozygosity were lower than that found by Aguilar-Barajas et al. (2014) for the same loci. They were also inferior to those found by Silva et al. (2009) when analysis was performed by means of isoenzymes for the genetic diversity of four populations of S. mombin in the Rainforest Atlantic Zone of Pernambuco, Brazil. The lower rate of heterozygosity found for S. mombin in relation to other tropical tree species may be related to forest fragmentation and population size reduction. These factors can affect genetic processes such as genetic drift, gene flow, selection, reproduction systems, in addition to causing reproductive isolation, increased spatial structure within the population and consequently loss of genetic variability (Carvalho et al., 2010; Young et al., 1996). All the populations of S. mombin analyzed in this study were in fragmented areas with significant anthropogenic action, and some individuals were isolated in a pasture or urban matrix.
The frequency of heterozygotes in the population is also a measure of diversity (Nei, 1973), and a heterozygote presents variability due to carrying two different alleles in the same locus. Observed heterozygosity (Ho) is the mean frequency of heterozygous individuals per locus among the sample components (Shimizu et al., 2000) and is highly influenced by the reproductive system, with allogamous species, such as S. mombin, generally presenting higher values (Faraldo et al., 2000). The expected heterozygosity (He) is the average frequency of heterozygotes, per locus, expected by the Hardy-Weinberg equilibrium (Shimizu et al., 2000) and in this case, there is no influence of the reproductive system. In the analyzed populations of S. mombin, the Ho was higher than the He in 6 of the 10 populations and, when Ho is higher than He, it is understood that there are more heterozygotes in the population than expected by the Hardy-Weinberg equilibrium (Gois et al., 2009). This result demonstrates there is an important genetic diversity in the populations studied.
In all, one locus and six populations had negative fixation rates, which indicates an excess of heterozygotes. However, the positive fixation index in most loci and in four populations, as well as in the average for the species, indicates the presence of inbreeding, even if in a low proportion, due to the excess of homozygotes. The fixation index (ƒ) ranges from -1 to 1, in which positive values indicate excess homozygotes and negative values indicate excess heterozygotes (Azevedo, 2007). Inbreeding is a consequence of the reduction in the number of reproductive individuals in the population, which induces self-fertilization and crossbreeding between related individuals (Young et al., 1996; Reis et al., 2011). Since S. mombin is a preferentially allogamous species, with a low rate of self-fertilization and with a tendency to self-incompatibility (Carneiro & Martins, 2012; Oliveira et al., 2012), it is unlikely that only self-fertilization is responsible for inbreeding, and may be caused by crossbreeding between related individuals or by preferential mating.
The way seeds are dispersed may favor the formation of a spatial genetic structure, with more closely related individuals (Sobierajski et al., 2006). It was found during the collections that there was a large amount of endocarps under the individuals, as well as young individuals of S. mombin in a nearby radius. The agoutis, tapirs, bats and monkeys are considered dispersants of seeds of S. mombin (Heithaus et al., 1975; Henry et al., 2000; Smythe, 1970), however, no studies were conducted on the distance of seed dispersion performed by these animals. In this case, if they consume the pulp of the fruit and leave the endocarp near the mother tree and the seeds germinate giving rise to a new individual, a spatial genetic structure is formed that allows the crossing between related individuals increasing inbreeding. In addition, there is the possibility of seeds germinating from fruits that fall close to the mother plant, without the need for a disperser to interfere with the process.
Another factor that can contribute to this is pollination or pollinating agents of the species. Turner et al. (1982) found that when pollinators perform pollination preferably in neighboring or nearby plants, high levels of inbreeding are found, even in plants that have self-incompatibility. Small bees, mainly Apis mellifera and Scaptotrigona tubiba (Carneiro & Martins, 2012; Oliveira et al., 2012), carry out pollination of S. mombin. This type of bee calculates energy expenditures for resource collection and opts for shorter displacements in search of energy savings (Bizotto & Santos, 2015). Thus, pollinators may prefer to forage nearby plants so as not to increase energy expenditure, thus assisting in fertilization among related individuals.
The mean of the PIC showed that the loci analyzed were moderately informative, two being poorly informative (PIC < 0.25), four moderately informative (PIC ranging between 0.25 and 0.50) and one highly informative (PIC > 0.50), according to the classification of Botstein et al. (1980). Although they are not all highly informative, it was possible, through these loci, to verify the genetic diversity of S. mombin and find rare and unique alleles.
The Caceres (CC) and Alta Floresta (AF) populations presented the highest number of rare alleles and deserve more attention regarding conservation since, according to Raposo et al. (2007), populations that have a higher proportion of rare alleles are more sensitive to loss of genetic diversity due to genetic drift. The AF population also presented a greater number of exclusive alleles, thus deserving greater attention for conservation. In addition to rare and exclusive alleles, 13 common alleles of local distribution were identified. These alleles are also important for the conservation of the species because, supposedly, they are the ones that ensure adaptation to specific environments and, thus, can have great value in cases of sudden environmental changes or even as a source of genetic variability for resistance to attack by pests and diseases (Sebbenn, 2003).
The UPGMA dendrogram demonstrated that the populations formed two groups, one with the MR and AF populations and the other containing the other populations. The cophenetic correlation showed an association of 78 % (CCC = 0.78) between the distances obtained in the dissimilarity matrix and the cophenetic matrix. According to Rohlf (1970), CCC values greater than 0.70 reflect good agreement between matrices. The dendrogram data were confirmed by the structure grouping, where AF and MR were again presented in the same group.
The geographic distance of the populations is not related to the genetic similarity between them, which was verified by the Mantel test. Despite the absence of a relationship between the genetic structure and the geographical distances for the species, the presence of exclusive alleles in the populations may indicate that this differentiation process is underway and that time and evolutionary mechanisms have not yet been sufficient to differentiate populations at geographical levels. In addition, the species presents alleles with high frequency, which decrease the differentiation between populations.
The value of gene flow revealed that populations are not genetically isolated, since it was greater than 1. According to Wright (1931), Nm values greater than 1 are sufficient to avoid random loss of alleles within the population. However, this information should be evaluated with care, since due to the high distance between most populations, current gene flow via pollen or seed dispersal is unlikely. Thus, this value may refer to the historical gene flow between populations over time, according to the distribution dynamics of the species in the studied area, which helped to make the allelic frequencies similar amongst themselves.
The populations of S. mombin in the state of Mato Grosso present genetic diversity and are promising sources of genetic resources that can be selected, collected and propagated. An example of this is the presence of local common alleles that indicate adaptation to specific environments. Furthermore, a study of genetic divergence between S. mombin genotypes through morphological characteristics carried out by Silva et al. (2017a) in the region where the AF, MR and NA populations are located has already demonstrated the potential of some sampled genotypes for use in breeding, due to the presence of variation in traits of interest. These data reinforce the importance of maintaining the genetic diversity of the populations studied.
Genetic diversity is higher at the intrapopulational level, thus, in situ or ex situ conservation of individuals from each of the studied populations is proposed, in order to enable the maintenance of genetic diversity and effective conservation of S. mombin. It is hoped that this knowledge regarding the genetic diversity of S. mombin will assist in the implementation of conservation strategies, since it reveals how this diversity is distributed in space and it signals how the loss of genetic variability has occurred in the species.
Ethical statement: authors declare that they all agree with this publication and made significant contributions; that there is no conflict of interest of any kind; and that we followed all pertinent ethical and legal procedures and requirements. All financial sources are fully and clearly stated in the acknowledgements section. A signed document has been filed in the journal archives.

