


 Inglés (pdf)
 Articulo en XML
 Referencias del artículo
 Enviar articulo por email
 Citado por SciELO
  Similares en
SciELO
Similares en
SciELO  uBio
uBio 
 Permalink
Introduction
The semiarid region of Brazil has a highly rich flora and the genus Spondias is widely found in this area. Many species of Spondias occur in spontaneous and subspontaneous forms, such as S. mombin L., S. purpurea L., S. cytherea Sonn., Spondias sp., S. tuberosa x S. mombin, and S. tuberosa Arruda) (Pires, 1990). In particular, the umbu tree (S. tuberosa) species has great relevance to the semiarid region due to its production potential and drought resistance. Umbu tree fruits have many uses, for example, they are eaten fresh and used in sweets, juices, jellies and other local products. In addition to its commercial potential, umbu is also notable for its bioactive compounds, such as phenolic, carotenoid, flavonoid and vitamin C compounds that have beneficial health effects (Silva & Alves, 2008).
Agronomic and genetic characterization are important tools for genetic improvement and possible agronomic exploitation. However, there are few studies that focus on the genetic variability of umbu tree. Santos, Rodrigues, and Zucchi (2008) studied the genetic variability of umbu tree in the Brazilian semi-arid region using AFLP markers and found high variability in populations, suggesting that the genetic diversity of umbu tree could be used to improve the species. The Embrapa Semiárido in Brazil maintains an umbu tree germplasm collection, with 80 accessions (Ramos, Queiroz, Romão, & Silva Júnior, 2008).
Molecular markers have been increasingly used due their widely applied in genetic studies (Turchetto-Zolet, Turchetto, Zanella, & Passaia, 2017). Among these biotechnological tools microsatellite markers or single sequence repeats (SSRs) are widely employed due to their ease of use, codominance, multiallelism and high reproducibility. Due to the restriction of SSR developed for species of Spondias sp., studies of marker transferability are common, as in the study of Aguilar-Barajas et al. (2014). Balbino, Martins, Morais, and Almeida (2019) developed 18 polymorphic SSR markers useful for studies of genetic population and conservation and breeding activities. Estimations of genetic diversity parameters, applying SSR, are still rare with umbu tree, mainly among accessions of the Embrapa Semiárido germplasm collection, the most important one.
The objective of the present study was to estimate the genetic diversity and structure of accessions at the Embrapa Semiárido germplasm bank of S. tuberosa from four areas of the semiarid region in Brazil, which will help guide future genetic resource studies of this species.
Materials and methods
Plant material and DNA extraction and quantification: Samples of young and healthy leaves of 24 accessions from four areas of the Brazil semiarid region (Fig. 1) were collected from the umbu tree germplasm bank at Embrapa Semiárido in Petrolina, Pernambuco, Brazil. The DNA was extracted using the CTAB 2X protocol (Doyle & Doyle, 1990) with some modifications. DNA quantification and the integrity were verified in 0.8 % agarose gel, followed by diluting the genomic DNA to 10 ng mL-1.

Fig. 1 Sampling locations of the umbu tree accessions maintained in the germplasm bank at Embrapa Semiárido (BGU), Brazil. Accessions were collected in the following Brazilian municipalities: Petrolina, Pernambuco (PE); Juazeiro and Uauá, Bahia (BA); and Januária, Minas Gerais (MG).
PCR protocols: The amplification reactions were made using 10 primers, including four developed by Aguilar-Barajas et al. (2014) and six developed by Balbino et al. (2019). The PCRs were adjusted to a final volume of 10 μL containing the following: 1µL of buffer, 2 mM of MgCl2, 0.22 μM of each dNTP, 0.4 μM of each primer (forward and reverse), a unit of Taq DNA polymerase and 10 ng of genomic DNA.
The amplifications were made in a Biometra thermocycler using the program proposed by Aguilar-Barajas et al. (2014): 15 min at 94 ºC, followed by 35 cycles of 30 s at 94 ºC, 1 min 30 s at 59 or 60 ºC and 1 min at 72 ºC, and a final extension of 10 min at 72 ºC. The amplification products were observed using polyacrylamide gel at a concentration of 6 %, according to the methodology described by Costa and Santos (2013), stained with silver nitrate (Creste, Neto, & Figueira, 2001).
Cluster, population structure and AMOVA analysis: the number of base pairs (bp) of each allele was estimated using the inverse mobility method based on the regression of products of known size of a molecular marker with 50 bp (Ludwig Biotec ®). The microsatellites were analyzed for allelic presence (1) and absence (2) to construct a Jaccard index of similarity. A dendrogram was generated using the UPGMA clustering method (unweighted, based on the arithmetic mean). The dendrogram was tested using the cophenetic correlation coefficient. The program NTSYSpc (Rohlf, 2000) was used for these analyses.
The accessions were grouped using the program STRUCTURE 2.3.4 (Pritchard, Stephens, & Donnelly, 2000) and the Markov Monte Carlo chain (MCMC), with 100 000 permutations and 100 000 simulations for cluster inferences. Ten runs were performed for each K value (number of possible clusters). Using STRUCTURE HARVEST (Earl & vonHoldt, 2012), the ΔK value was calculated to detect the probable number of clusters (Evanno, Regnaut, & Goudet, 2005).
The analysis of molecular variance (AMOVA) was conducted by decomposing the total variation of the components between and within populations using the square Euclidean distance (Excoffier, Smouse, & Quattro, 1992). The significance of the genetic parameters was determined by the randomization method (999 permutations). Gene flow (Nm) was estimated by the number of migrants, based on the FST parameter that is analogous to the ΦST, defined as the function of the between-population variance component and the within-population variance component (ΦST = σ2 a/(σ2 a+σ2 b)) (Wright, 1949; Excoffier et al., 1992; Meirmans & Hedrick, 2011). The program GenAlEx 6.5 (Peakall & Smouse, 2006) was used for the AMOVA.
Results
SSR polymorphism: All of the SSR loci had a good amplification pattern in the polyacrylamide gel (6 %). The allelic diversity ranged from two to seven alleles per locus, with an average of 3.5 alleles per locus (Table 1). The polymorphic information content ranged from 0.195 to 0.778 (Table 1). The expected heterozygosity varied from 0.195 to 0.822 and the observed heterozygosity ranged from 0.167 to 0.958.
Table 1 Genetic parameters of ten microsatellite loci evaluated in 24 individuals of Spondias tuberosa
| Locus | Primer sequences (5’-3’) | Parameters in S. tuberosa | |||||
| Ta(ºC) | NA | BS | PIC | He | Ho | ||
| SPO4 | Forward: CGCTAGTTGTCATTCGCGG Reverse: GCTTAACCTCTGGAAAGTCGC | 62 | 7 | 548-696 | 0.778 | 0.822 | 0.958 |
| SPO8 | Forward: GCAGCAGCCATTTGTGAAC Reverse: CACGTGTTCCCAGTTATGATTTG | 60 | 4 | 505-529 | 0.486 | 0.552 | 0.458 |
| SPO14 | Forward: ACACCAACGTTTGCGGAG Reverse: TCTAGGTAGACAGCGACAAATC | 62 | 3 | 640-707 | 0.575 | 0.662 | 0.500 |
| SPO18 | Forward: TCTATTTGCGTCCAGGTATTTC Reverse: GAATGGGCACGTTCCTTGG | 62 | 3 | 820-874 | 0.477 | 0.580 | 0.609 |
| TUB78 | Forward: TGCTCTGCCTTCCAACATGT Reverse: GTACGTGAGGGACAATGGGG | 59 | 3 | 558-642 | 0.388 | 0.414 | 0.458 |
| TUB84 | Forward: CACCTCCTACGTTACTGCCA Reverse: TCAAACTGGATTCAGGCATGC | 59 | 2 | 580-613 | 0.359 | 0.479 | 0.333 |
| TUB93 | Forward: AGCCTTTTTGAGTCACATGCA Reverse: ACACTGATGGTACGTGAACAA | 60 | 2 | 570-624 | 0.195 | 0.223 | 0.167 |
| TUB94 | Forward: TGTCTGAGGATCGAGACGAGA Reverse: GCACGCGCTTACTTATGTTGG | 60 | 3 | 689-767 | 0.522 | 0.600 | 0.542 |
| TUB98 | Forward: AGCGGAAAAGAATGATGAAGGC Reverse: GTTGGCTTCTTTCTTGCGGC | 60 | 4 | 647-683 | 0.474 | 0.554 | 0.667 |
| TUB103 | Forward: GGAGCAGTGAAACCCCTGAA Reverse: GTCCAGGTCGCCGTAAAGAA | 60 | 4 | 519-533 | 0.357 | 0.392 | |
Ta(°C): annealing temperature; NA: number of alleles; BS: band size; PIC: polymorphic information content; He: expected heterozygosity; Ho: observed heterozygosity.
Cluster analysis: The clustering of the 24 individuals has a cophenetic correlation coefficient of 1.0 (Fig. 2), indicating that the data are reliable and there is good fit between the genetic distances, original matrix and graphic representation. The similarity matrix ranged from 0.115 to 0.842, indicating high variability among the individuals analyzed (Fig. 2).
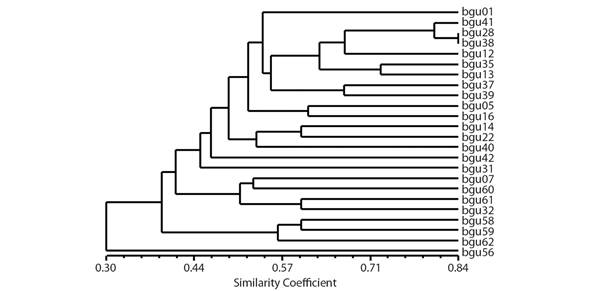
Fig. 2 Dendrogram representing the SSR genetic divergence among the 24 accessions of S. tuberosa obtained from the UPGMA method, using the complement of the Jaccard index as the average of dissimilarity. Cophenetic value = 1.0.
Based on the microsatellite markers and the similarity matrix of the umbu tree accessions, it was possible to separate the accessions into four groups, using the average distance of 0.44 as the cutoff point. The groups are formed by the following accessions: group I by BGU56 (Januária); group II by BGU58, BGU59 and BGU62 (Januária); group III by BGU07, BGU32, BGU60 and BGU61 (Juazeiro, Uauá and Januária, respectively); and group IV by 16 accessions, including BGU01, BGU05, BGU16, BGU41, BGU42 (Juazeiro); BGU28, BGU31, BGU35, BGU37 and BGU38 (Uauá), and BGU12, BGU13, BGU14, BGU22, BGU39 and BGU40 (Petrolina) (Fig. 2).
Genetic structure and gene flow: Two groups were identified based on ΔK (K = 2) (Fig. 3, Fig. 4). Of the clusters obtained from the similarity matrices, there is a group of three accessions (BGU58, BGU59 and BGU62) exclusive to the region of Januária, Minas Gerais that is located in Brazil Southeastern part of the semiarid region.
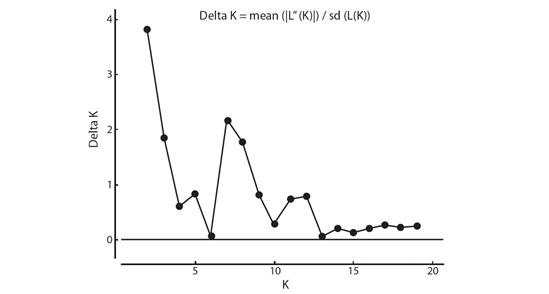
Fig. 3 Delta K, calculated with the second-order average rate of variation of the K probability divided by the standard deviation of the K probability.
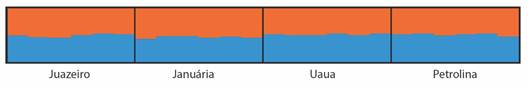
Fig. 4 Genetic structure of 24 umbu tree accessions from four semiarid regions, based on a Bayesian analysis, considering K = 2, obtained by the ΔK method, from 20 independent simulations for each number of possible clusters (k).
The Bayesian analysis indicated the existence of only two groups, the three accessions from Januária, Minas Gerais in one group and the remaining accessions from Uauá, Bahia; Juazeiro, Bahia; and Petrolina, Pernambuco in another group (Fig. 4).
The analysis of molecular variance of 24 individuals the umbu tree from four distinct populations revealed that only 12 % of the genetic variability is between populations and 88 % of the variability is within populations (Table 2).
Table 2 Analysis of molecular variance (AMOVA) among four umbu tree populations assessed with ten microsatellite loci
| Source of variation | d.f. | SS | MS | p-value | Total genetic variation (%) | ΦST | Nm |
| Among populations | 3 | 27.833 | 9.278 | < 0.001 | 12 | ΦST = 0.12 | 1.865 |
| Within population | 20 | 102.833 | 5.142 | < 0.001 | 88 | 1- ΦST = 0.88 | |
| Total | 23 | 130.667 |
d.f.: Degree of freedom; SS: Sum of squares; MS: Mean squares; p-value based on 999 permutations; ΦST: Subpopulation genetic variance (S)/total genetic variance (T); Nm: Number of migrants calculated using the method by Wright (1949) [(1-ΦST)/(4 ΦST)].
Discussion
Microsatellite markers used to estimate the genetic diversity and structure of S. tuberosa accessions had good amplification patterns and an average of 3.5 alleles per locus. This is similar to the study of Balbino, Caetano, and Almeida (2018) who found an average of 2.7 alleles per locus for the same species Cristóbal-Pérez, Fuchs, Harvey, and Quesada (2019) evaluated the genetic variability of another species of the genus (S. purpurea) using 24 microsatellites and found an average of 5.88 alleles. Silva et al. (2017) also found high allelic diversity (6.97 alleles per locus) using ISSR markers to characterize the genetic diversity of S. mombin.
The polymorphic information content (PIC) values were moderate (0.5 > PIC > 0.25) to highly (PIC > 0.5) informative, according to the classification by Botstein, White, Skolnick, and Davis (1980), except for TUB93 that had a less-informative PIC value of 0.195, and the SPO4, SPO14 and TUB94 loci were the most informative (Table 1; Silva et al., 2017) estimated the genetic diversity of S. mombin using ISSR markers and found PIC values above 0.250 for most of the markers used, similar to our study.
For the SPO8, SPO14, TUB84, TUB93, TUB94 and TUB103 markers, the expected heterozygosity was higher than the observed heterozygosity, meaning high genetic variability and mixing of populations. Cristóbal-Pérez et al. (2019) also found higher expected heterozygosity values when evaluating 139 individuals of S. purpurea, from three Mexican localities, based on 10 polymorphic SSR loci.
The expected and observed heterozygosity values were similar to those observed by Balbino et al. (2018), who found values between 0.158 and 0.607, and 0.170 and 0.781, respectively, in a study about the phylogeographic pattern of S. tuberosa using accD-psaI plastid sequences and SSR markers of individuals from 20 localities of Brazil Northeastern.
In the cluster analysis, the cophenetic correlation coefficient of 1.0 indicates the confidence of the data and shows there is a good fit between the genetic distances, original matrix, and graphic representation. Dendrogram of the 24 individuals analyzed, based on the UPGMA method, showed four groups. Reduced cluster number was reported by Santana et al. (2011), when analyzed the genetic diversity among 17 Spondias sp. accessions from Brazil Northeast, with 25 ISSR markers, a king of universal SSR. Based on ISSR, Silva et al. (2017) reported nine groups with a sampling of 126 individuals of S. mombin from three populations, collected in the Mato Grosso State, Brazil.
The BGU56 accession comprised the first group diverging from the other studied accessions. The second group only contains the accessions from Januária-MG, municipality located in the Brazilian Southeast Region, geographically distant, around 2 000 Km, from the other analyzed regions. The fourth group has the most accessions and comprises individuals from the Juazeiro, state of Bahia, Uauá, state of Bahia, and Petrolina, state of Pernambuc regions, which are relatively close to each other, maximum of 150 km, in the same ecogeographic region. Thus, we can infer that their proximity justifies this cluster. Based on phenotypic characters, Santos (1997) concluded that variability in umbu tree is uniformly distributed in the semiarid region of Brazil. Differently, Santos et al. (2008), based on AFLP markers, concluded that the genetic variability of umbu tree is not uniformly distributed in this region and that geographic barriers or edaphoclimatic conditions have limited the crossing and frequency of the alleles among populations. The present study also indicates that the variability of umbu tree is not uniformly distributed in the semiarid region, since individuals from Januária form nearly exclusive group, while individuals from Uauá, Juazeiro and Petrolina are almost all in the same group.
Based on Bayesian statistics, two genetic groups (K) were found in this study. Of these two groups obtained for K, one includes the three accessions (BGU58, BGU59 and BGU62) from Januária-MG, in the southeast part of the Brazilian semiarid region, and the other contains the remaining accessions from Uauá, Juazeiro, and Petrolina. Balbino et al. (2018) also found K = 2 in a study of the phylogeographic pattern of S. tuberosa using sequences of the accD-psaI plastid region and six SSR markers for individuals from 20 localities of the Brazil North-eastern. By Bayesian analysis, the two groups found in the present study can be seen at a cutoff point of 0.40 in the UPGMA dendrogram (Fig. 1), in three groups. Costa and Santos (2017) also reported concordances between UPGMA and Bayesian analyses when studying accessions of Psidium (guava) with SNPs.
The analysis of molecular variance indicated moderate genetic differentiation diversity among population (12 % of the variability). A similar result was found in the study of Balbino et al. (2018), where the authors detected 13 % genetic variability among populations of S. tuberosa from Brazil North-eastern regions. These data go to what was reported by Paiva (1998) who noted that in natural plant populations in tropical regions most genetic variability is preserved within populations. Still about, according to Wright (1965), FST (=ΦST) values above 0.25 indicate high levels of genetic differentiation and an FST value of 0.12 indicates moderate differentiation.
Using the AFLP molecular marker, Santos et al. (2008) studied the distribution of the genetic variability of umbu tree in the semiarid region of Brazil and found high genetic differentiation (FST = 0.3138), suggesting that this species has restricted flow, with less than one migrant per generation (Nm = 0.567), and high variability between populations. Using an isoenzymatic polymorphism analysis Silva, Martins, and Oliveira (2009) estimated the genetic diversity and structure of S. lutea populations in the forest zone in Pernambuco State, in Northeastern Brazil, and found an Nm value of 5.27, which differs from that found in the present study.
The cluster analysis, AMOVA and Bayesian analysis of the present study indicate that the genetic diversity of S. tuberosa is not uniformly distributed in the Januária-MG, Juazeiro-BA, Uauá-BA and Petrolina-PE regions. Thus, germplasm from a greater number of populations should be collected in other Brazilian regions to increase the genetic diversity of the germplasm collection maintained at Embrapa Semiárido, Brazil.
The FST value of 0.12 indicates moderate genetic differentiation among the S. tuberosa populations from Januária-MG, Juazeiro-BA, Uauá-BA and Petrolina-PE, suggesting that the genetic variability of the accessions of the Embrapa germplasm collection is moderately structured in function of origin. The genetic diversity of S. tuberosa is not uniformly distributed in the four studied Brazilian semiarid regions and germplasm expedition should consider sampling in other regions to increase the collection variability.
Ethical statement: authors declare that they all agree with this publication and made significant contributions; that there is no conflict of interest of any kind; and that we followed all pertinent ethical and legal procedures and requirements. All financial sources are fully and clearly stated in the acknowledgements section. A signed document has been filed in the journal archives.

