


 English (pdf)
 Article in xml format
 Article references
 Send this article by e-mail
 Cited by SciELO
  Similars in
SciELO
Similars in
SciELO  uBio
uBio 
 Permalink
Introduction
Urban areas are expanding and currently support more than 50 % of the world’s population leading to the transformation of natural and rural environments into urban centers (Montgomery, 2008; Aronson, Handel, La Puma, & Clemants, 2015). Urbanization alters the composition of biological communities and the ecological relationships among their species (Marzluff, 2017). Urban gradients often lead to gains and losses of non-native and native species, respectively (Lindenmayer, Cunningham, Donnelly, Nix, & Lindenmayer, 2002; Lewis et al., 2015). While the relative number of these gains and losses across the gradient varies by location (Blair, 1996), diversity is always lowest in the urban core (Marzluff, 2001). Invasive species tend to be less affected by urbanization due to their capacity to adapt to and use the new habitats created (Lindenmayer et al., 2002; Lewis et al., 2015). In contrast, species that decrease in abundance or disappear are usually those that inhabit on the natural vegetation before urbanization (Marzluff, 2001).
Habitat fragmentation is a process that turns large and continuous habitats into smaller patches with a different pattern from the original and separated by others habitat types (Fahrig, 2003). Habitat fragmentation and habitat loss can be considered independent process (Fahrig, 2003), but in urbanization context is difficult to separate their effects, as both happen simultaneously (Hadley & Betts, 2016). Habitat fragmentation may increase endogamy by restricting gene flow among populations (Templeton, Shaw, Routman, & Davis, 1990; Jump & Peñuelas, 2006), limit dispersion (Hanski & Ovaskainen, 2000), and disrupt conspecific attraction (Fletcher, 2009). Therefore, increases in the probability of extinction of native species are expected in highly fragmented habitats (Jump & Peñuelas, 2006; Fletcher et al., 2018).
We used as a model species the recently recognized Costa Rican endemic Cabanis’s Ground-Sparrow (Melozone cabanisi, Passerellidae) because is one of the species that may be most affected by urbanization, due to its reduced distribution in Costa Rica (Sandoval, Bitton, Doucet, & Mennill, 2014; Sandoval, Epperly, Klicka, & Mennill, 2017). Because of that reason is classified by the government of Costa Rica, after an expert evaluation, as Critically Endangered (SINAC, 2017), contrary to the wrong UICN classification of Least Concern justified in a suspected population increase associated with an increase on habitat result of the degradation of natural habitats (BirdLife International, 2019. This species originally inhabited areas with a native scrub community, thickets, and young secondary growth, near riversides or in forest gaps of the Central Valley and Turrialba Valley (Sandoval et al., 2014). Nevertheless, after habitat alterations caused by agricultural expansion in both regions, this species adapted to live in coffee, sugar cane, squash plantations, and non-native shrubs and thickets (Stiles & Skutch 1989; Sandoval et al., 2014). Currently these habitats are urban or industrial areas that contrary to UICN information (BirdLife International 2019), its habitats are decreasing and fragmenting (Sánchez, Criado, Sánchez, & Sandoval, 2009; Biamonte, Sandoval, Chacón, & Barrantes, 2011). This because those habitats are not protected by any law and the majority of habitats (if not all) occur outside of protected areas (Sandoval et al., 2019). However, beyond this information, nothing is known about the current distribution of this species and their populations related to the available habitat and land cover types within their range.
Considering these knowledge gaps regarding the current distribution and habitat availability for this species, here we aim to (1) create an ecological niche model (ENM) to determine the area of potentially suitable habitat (sites of major bioclimatic suitability) for the Melozone cabanisi, (2) estimate the current suitable habitat area, and (3) analyze connectivity among the current suitable habitat patches for the study species. We proposed these three objectives in order to assess the effect of habitat quantity, quality, and spatial pattern on Melozone cabanisi occurrence.
Materials and methods
We developed an ecological niche model (ENM) to predict the area of potentially suitable habitat of the Cabanis’s Ground-Sparrow in Costa Rica using the Maximum Entropy Algorithm (MaxEnt). This is a presence-background method that correlates incomplete information from occurrences and bioclimatic predictors to establish suitable areas for a given species (Elith et al., 2011). MaxEnt quantifies the statistical relations between the predictor variables associated with occurrence points (precipitation of the driest month and isothermality) and the background of the study area (Muscarella et al., 2014). Then we identified the actual suitable area near the urban centers by comparing the potentially suitable areas with a land cover map, after a model selection process.
Occurrence Data: We obtained the occurrence data for Cabanis’s Ground-Sparrow from three different sources: personal observations, observations from colleagues, and occurrences available from eBird (www.ebird.org) and the Global Biodiversity Information Facility (www.gbif.org). From these three sources, we gathered all the data occurrences with available coordinates from 1817 (oldest) to 2015. In total we gathered 472 occurrences that were filtered to 37 occurrences and then used to build the models. The reduction to 37 occurrences was expected because Cabanis’s Ground-Sparrow is a species of limited distribution and also, we reviewed the data set by projecting all the compiled records with available coordinates onto a map, discarded spatial outliers derived from erroneous coordinate assignation or species misidentification and occurrences closer to 1 km from each other to avoid pseudoreplication. By the time this species was not recognized as a separate one from Prevost´s Ground-Sparrow (Melozone biarcuata), we selected the occurrences from Prevost´s that were from Costa Rica which corresponded exclusively to Cabanis´s Ground-Sparrow.
Bioclimatic Predictors: We used as predictor variables the 19 bioclimatic layers available at www.worldclim.org at a 1 km2 resolution (Hijmans, Cameron, Parra, Jones, & Jarvis, 2005). This standard set of variables are interpolations derived from global weather stations mostly for the period between 1950 and 2000 based on precipitation and temperature and represent annual trends, seasonality and extreme of limiting environmental factors (Hijmans et al., 2005). Since our objective was to create a predictive model, rather than an explanatory model (Araújo & Guisan, 2006), we used the entire set of bioclimatic variables to run the models. MaxEnt works under a machine learning approach (Olden, Lawler, & Poff, 2008), meaning that the algorithm itself can discriminate and assign the contribution of each predictor variable used to generate the models (Elith et al., 2011). To mitigate overfitting models to the occurrence points (Merow, Smith, & Silander, 2013), we delimited the calibration area of the models using only the bioclimatic information within 25 km radius around each occurrence point.
Model Parametrization and Evaluation: We generated the models using the package “dismo” (Hijmans, Phillips, Leathwick, & Elith, 2016) after a tuning process conducted with the package “ENMeval” (Muscarella et al., 2014), in R 3.3.1. For model calibration, we generated 80 tuned candidate models by varying two parameters: feature classes (FC) and regularization multiplier values (RM, Merow et al., 2013). The FC corresponds to different transformations of the predictor variables, which allows different fits of the observed data (Elith et al., 2011). The RM values limit model complexity by penalizing each additional term included in the models in order to prevent overfitting (Radosavljevic & Anderson, 2014). We set the RM values from 0.5 to 4.0 at 0.5 increments and used 10 FC combinations (FC = “L”,”Q”,”H”, “P”,”T”, “LQ”, “LQHP”, “LQH”, “LHP”, and “LQHPT”; where L = linear, Q = quadratic, H = hinge, P = product and T = threshold). We set 10 000 background points for the evaluation of the models and used the block method for data partitioning which splits the data into four bins based on the latitude and longitude lines that creates subsets of equal numbers of localities, both occurrences and background points (Muscarella et al., 2014). We partitioned data to have testing and training bins for building the models (Muscarella et al., 2014). We chose the block method because it was the method that separates the localities most equally from all the partition methods and this is advantageous because the amount of data used for testing the model is similar to the data used for training.
We used the mean omission rate and the area under the response curve (AUC) as metrics to select the best-fitted model (Muscarella et al., 2014). Then we projected the selected model (potentially suitable area) to the rest of the country and superposed it with a land cover type layer of Costa Rica’s Gran Área Metropolitana (GAM) updated to 2005. This land cover type layer despite being rather old, reflected useful present day situation of habitat availability, because by that time the major changes in land use were already done (Morera, Romero, & Sandoval, 2013). We consider that the changes that may have happened between 2005 and 2020 are not significant to our purposes which are to do a primary assessment of Cabanis’s Ground-Sparrow with the available data, prior to propose directed field research. We did this to determine which areas, from the potentially suitable area, correspond to the actual suitable area. This layer was developed by the Regional and Urban Planification Program of the GAM, for the years 1986, 1996 and 2005, and spans 3.8 % of the total extension of Costa Rica with a classification based on 17 different types of land cover (PRUGAM, 2005). Based on the existing knowledge of the species’ natural history (Stiles & Skutch, 1989), we considered as remnants of habitat the areas classified as shrubs, thickets, and plantations (coffee, squash, cane sugar). For this, we binarized the best-fitted model into suitable and non-suitable areas using the minimum training presence threshold, which assumes as suitable all cells with probability values above the minimum assigned to any of the points used to train the model (0 % omission rate; Muscarella et al., 2014; Radosavljevic & Anderson, 2014).
Connectivity Analyses of the Actual Suitable Area: We used Patch Analyst extension for ArcGIS 10 to obtain descriptors of different patches including: surface indices, number of fragments, mean size of fragments, standard deviation of mean fragment size, total edge length, landscape edge density, and mean edge per patch. These metrics were related to all the patches in the matrix (Paudel & Yuan, 2012). We used these metrics to analyze the patch dynamics in terms of fragmentation, configuration, distribution, and edges of habitat sites for Cabanis’s Ground-Sparrow. We compared the changes through three time periods using the GAM land cover type layers for the years 1986, 1996 and 2005 (PRUGAM, 2005; Morera et al., 2013) to analyze if a tendency exists in changes in the patch metrics according to patch-type.
We decided to run both single and multi-patch connectivity analyses because the former considers the area of each patch, but focused on each patch individually; while the latter consider groups of patches as a whole, but do not consider the area of the patches, and because both are based on graph theory (Pereira, Saura, & Jordán, 2017). We calculated the probability of connectivity (dPC) for each patch in the suitable habitat matrix for Cabanis’s Ground-Sparrow based on a single-patch approach using Conefor sensinode 2.6 (Saura & Torné, 2009). We focused on the dPCconn, which is one of the three fractions that composed the dPC index, because it indicates the patches that act as important stepping stones between the other patches and is also closer and more comparable to pure centrality metrics as those implemented in the “keyplayer” package (Pereira et al., 2017). The dPCconn considers the topological position of each patch in the matrix and the area of the patches that they connect with, done by removal experiments (Pereira et al., 2017).
We conducted a connectivity analysis based on a multi-patch approach using the R package “keyplayer” (An & Liu, 2016). For the selection of the key sets of patches, we focused on two of the eight centrality metrics implemented in the package. We used fragmentation centrality and m-reach-closeness centrality due to its ecologically applicable output sets as proposed before (Pereira & Jordán, 2017; Pereira et al., 2017). Fragmentation centrality key sets are obtained by calculating the degree of fragmentation (connectivity lost respect to the overall connectivity) after the removal of a patch or a group of patches from the network (An & Liu, 2016; Pereira & Jordán, 2017). The m-reach-closeness centrality metric measures to what extent a patch or group of patches are connected to the rest of the intact network (An & Liu, 2016; Pereira & Jordán, 2017). For each centrality metric, we ran 10 iterations to increase the chance of finding the global optimum that is the best group of patches, of a given size, among all possible combinations in the patch matrix (Pereira & Jordán, 2017) and chose the key set with the highest centrality score. These two analyses require the natal dispersal distance of the study species as an input to determine the connectivity among the matrix, therefore we used a maximum natal dispersal distance of 1 500 m reported for the Rufous-Crowned Sparrow (Aimophila ruficeps; Greenwood & Harvey, 1982). The closest relative species (Sandoval et al., 2017), for which natal dispersal information is available.
Results
Model Parametrization and Evaluation: We obtained 80 candidate ENM’s based on different parameterizations to predict the area of Cabanis’s Ground-Sparrow’ potentially suitable habitat. The best-fitted model (mean omission rate = 0.03; AUC = 0.70) was the one using a regularization multiplier of 3.5 and a threshold feature class (Fig. 1). We determined that only 49 037.4 ha correspond to the actual suitable habitat for Cabanis’s Ground-Sparrow based on the occurrence of coffee plantations, shrubs, and thickets (Fig. 2A).
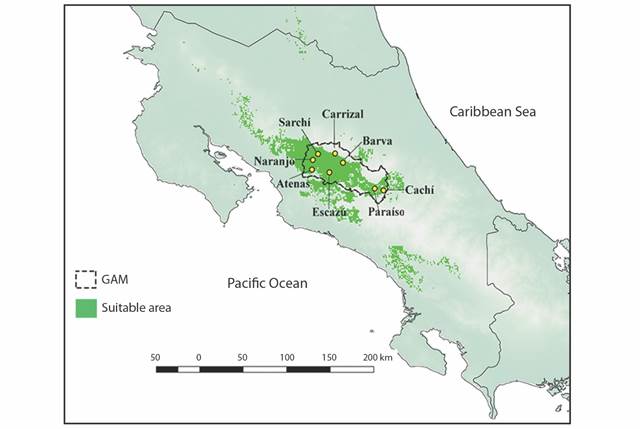
Fig. 1 Binarized projection of the best-fitted ecological niche model prediction out of 80 candidate models for the Melozone cabanisi (Cabanis’s Ground-Sparrow) and georeferenced points along the GAM.
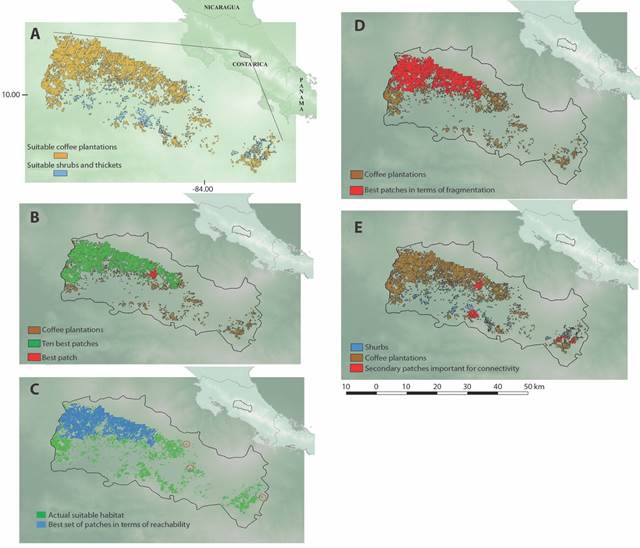
Fig. 2 A. Actual suitable habitat patches of coffee plantations, shrubs, and thickets for Melozone cabanisi (Cabanis’s Ground-Sparrow). B. Important steppingstone patches for Cabanis´s Ground-Sparrow connectivity according to the single-patch analysis located towards the center of the matrix. Multi-patch analysis results; C. Corridor like set of suitable habitat patches arrangement in terms of reachability, and D. Clustered set of suitable habitat patches in terms of fragmentation for Cabanis’s Ground-Sparrow. E. Complementary suitable area patches selected by more than one analysis for the species.
Connectivity Analyses of the Actual Suitable Area: A total of 1 206 (41 837.2 ha) patches of coffee plantations and 717 (7 200.2 ha) patches of shrubs and thickets were analyzed. From those, the ten biggest patches for each land cover category represented 74.3 and 36.3 % respectively. The biggest patches of coffee plantations were located from Carrizal to Sarchí in the province of Alajuela in the Northwest side of the GAM, but the biggest patches of shrubs and thickets are near San Rafael of Escazú in San José province and Paraíso in Cartago province towards the South and Southeast of the area.
The patch indices for the shrubs, thickets, and coffee plantation (Table 1) indicated that both surface areas (+16.16 %) and fragment numbers (+17.7 %) increased from 1986 to 2005. However, the mean fragment size, standard deviation, and the amount of edge per patch decreased (1.30, 30.52, and 4.14 % respectively). On the other hand, the amount of edge relative to the landscape increased (11.35 %; Table 1). In summary, the area covered by shrubs, thickets, and coffee fields increased in general. Nevertheless, if the coffee plantations are excluded, these indices show that the shrubs and thickets decreased in size (from 1996 to 2005), and the bigger patches that existed in the past suffered fragmentation producing a larger amount of edge length per patch (EP, Table 1).
Table 1 Patch analysis indices for the patches of suitable habitat inside the “Gran Área Metropolitana”
| Index | Shrubs and thickets | Coffee plantations | Total | ||||||
| 1986 | 1996 | 2005 | 1986 | 1996 | 2005 | 1986 | 1996 | 2005 | |
| S (ha) | 3 882 | 24 516 | 8 993 | 43 494 | 48 331 | 46 042 | 47 377 | 72 847 | 55 035 |
| P | 743 | 2 668 | 922 | 1183 | 858 | 1 345 | 1 926 | 3 526 | 2267 |
| PS (ha) | 5 | 9 | 10 | 37 | 56 | 34 | 25 | 21 | 24 |
| SDP (ha) | 8 | 38 | 38 | 959 | 1 122 | 677 | 752 | 555 | 523 |
| PP (m) | 994 908 | 4 405 926 | 1 839 889 | 4 132 061 | 5 018 115 | 3 944 993 | 5 126 969 | 9 424 041 | 5 784 882 |
| ED (m/ha) | 4.7 | 20.6 | 8.6 | 19.3 | 23.5 | 18.5 | 24.0 | 44.1 | 27.1 |
| EP (m/patch) | 1 339 | 1 651 | 1 996 | 3 493 | 5 849 | 2 933 | 2 662 | 2 673 | 2 552 |
S = Surface area, P = Number of patches, PS = Mean patch size, SDP = Standard deviation of the mean patch size, PP = Total edge perimeter, ED = Landscape edge density and EP = Mean edge per patch.
The 10 best patches for Cabanis’s Ground-Sparrow that serve as steppingstones for the overall connectivity according to the single-patch analysis were located in the Northwestern part of the matrix and four were amongst the largest in all matrix (Fig. 2B). Nonetheless, the best patch according to dPCconn (Fig. 2B) was medium-sized and located at Center-North of the matrix. The multi-patch analyses of the suitable habitat network showed that 10 most important patches, in terms of reachability (Fig. 2C; KPr = 0.93), were more dispersed in the network forming a corridor-like arrange. This group of patches has different areas, ranging from 7.2 ha to over 22 000 ha. Two of these patches also coincided with the single-patch results, the largest ones in the area. On the other hand, the set of 10 most important patches determined by fragmentation centrality (Fig. 2D; KPf = 0.85) were more grouped at the center of the matrix near the periphery of urban settlements of Northern Heredia and Alajuela provinces and eastern San José province. In this group, two of the patches were also selected as the largest in the matrix by both single-patch and multi-patch reachability analysis. Seven of selected patches in fragmentation centrality analysis were shared also in the results of the reachability centrality analysis, corroborating their importance to the overall patch matrix connectivity (Fig. 2E).
Discussion
Our model showed that the area of potentially suitable habitat for Cabanis’s Ground-Sparrow occured within the largest urban area in Costa Rica. Historically, this region has been the area with the highest urban and industrial development in the country (Herrera et al., 2014). The expansion has occurred from city centers of San José, Alajuela, Heredia, and Cartago provinces towards the periphery forming a growth ring that reaches localities at 10 to 15 km from the urban center (PRUGAM, 2005). Currently, according to a study of Costa Rica’s land cover type change (PRUGAM, 2005), coffee plantations, shrubs, and thickets are the habitats that suffered a major decline in the last 25 years, this was has been also documented in the change of the number of patches, surface area, patch size (for coffee plantations), and landscape edge density from 1996 to 2005 (Biamonte, Sandoval, Chacón, & Barrantes, 2011). Species with small distribution ranges and low abundances, as the study species, tend to be more threatened by the reduction and fragmentation of the habitats inside urban areas, than those with large distributions and high abundances (Manne & Pimm, 2001). Shrubs and thickets habitats where Cabanis’s Ground-Sparrow occurred, are abundant during the early urban development as we found (Table 1), and are rarely included in management plans (Sandoval et al., 2019). Therefore, these habitats alongside the urban areas will end eliminated or altered more quickly (Askins, 2001), which is what happened from 1996 to 2005 (Table 1). These results support the suggestions that the habitat for this species is decreasing (Sánchez et al., 2009; Sandoval et al., 2014) contrary to the information published for UICN (BirdLife International, 2019).
According to the three complementary patch analysis, the two patches that were crucial for maintain the connectivity of Cabanis’s Ground-Sparrow habitats were coffee plantations at Northwestern portion of the urban area. This highlighting the important role of such type of land cover as stepping stones for conservation of this ground-sparrow. The main problem that may arise with the destruction of these habitats is a significant loss of biodiversity. This area is heavily urbanized and some of the few adequate areas for maintaining biodiversity are coffee plantations, shrubs, and thickets. Moreover, a decrease in the overall connectivity within the natural habitat matrix may occur, and this will affect the remnant routes of passage for several other taxa (Perfecto, Rice, Greenberg, & Van der Voort, 1996; Harvey et al., 2008). Even though the Cabanis´s Ground-Sparrow can occur in either shaded or not shaded coffee plantations, but the shaded ones are always better for the overall maintenance of biodiversity (Perfecto et al., 1996). Their relative importance relies not on just in the amount of surface area they cover but in their particular location; the most important coffee plantations occur in heavily deforested areas, where are used as wintering grounds for migratory birds or source of resources in drought periods for resident species (Perfecto et al., 1996; Bakermans, Rodewald, Vitz, & Rengifo, 2012; Biamonte et al., 2011; Sandoval et al., 2019). Therefore, protect these areas used by Cabanis´s Ground-Sparrow will benefit also the migratory species and several other resident species that use it.
The other patches could serve as secondary connectivity routes to maintain the individuals’ flow between patches. These patches were considered secondary because they were either part of both groups of patches from the fragmentation and reachability analyses, but not the largest in area, or the biggest shrubs and thickets which are restricted to the eastern (Paraíso, Cartago province) and Southern (Escazú, San José province). These patches connect the remnant habitat at East and Southeast, with the biggest patches located at Northwestern distribution. Although we were conservative in using a distance of dispersal of 1 500 m in the multi-patch analysis our results showed the relative importance of these patches for ground-sparrow movements. However, their higher levels of isolation, smaller area compared to coffee plantations, and the fact that they do not generate direct incomes from economic activities, as coffee does, make them more prone to disappear (Sandoval et al., 2019). Moreover, most of the shrubs and thickets were separated from the coffee plantations by a complete urbanized area. Therefore, we also suggest studying the dispersal ecology of the Cabanis´s Ground-Sparrow, not only to improve future connectivity analyses but to delimitate with more accuracy the priority areas for this species.
Our study points out the most important patches of coffee plantations, shrubs, and thickets inside the Cabanis’s Ground-Sparrow distribution for its conservation. These findings may be used to study and preserve other resident and migratory bird species that use those patches such as warblers, flycatchers, orioles, or tanagers (Perfecto et al., 1996), including the threatened Golden-winged Warblers (Vermivora chrysoptera) and Olive-sided Flycatcher (Contopus cooperi). These habitat remnants support not only the persistence and survival of the endemic Cabanis’s Ground-Sparrows, but are also a refuge for several other taxa that are restricted to this type of habitats such as other 88 bird, 27 butterfly, and 10 mammal species in Costa Rica (Sandoval et al., 2019).
Cabanis´s Ground-Sparrow is only one of many species potentially threatened by urbanization and habitat loss in Costa Rica. This also demonstrates that our knowledge about endemic species and their population dynamics in urban centers is still vague, especially in the neotropics. However, this study shows that initiatives about the conservation of this species or any other can help to direct and prioritize the areas of action, which is especially crucial in the dynamic and chaotic environments that characterize urban centers. We hold that it is strictly necessary to expand the view of conservation policies and include the important role of coffee plantations, shrubs, and thickets in the urban matrix for several taxa, as demonstrated here with Cabanis’s Ground-Sparrow. We propose to declare the detected areas as conservation priorities due to their vital importance for the species survival in this urban context. Among the actions necessary to guarantee the conservation of these areas we suggest the following: avoid changing the land cover type through the implementation of pertinent land cover policies that mitigate their fragmentation; implement a program, supported by the local governments, for the payment of environmental services or reducing tax payments as an incentive to land owners, apply for reforestation programs to enhance connectivity among the rest of the matrix, and foment the protection of areas in successional states by their controlled management. We suggest that UICN need to re-evaluate Cabanis’s Ground-Sparrow classification based on this information about habitat availability and fragmentation, and previous publications (Sánchez et al., 2009; Biamonte et al., 2011; Sandoval et al., 2014). Finally, our analyses on potential species distribution, patches importance, and connectivity between patches is a tool that will help to detect which habitats within heavily urbanized areas are the most important to ensure different species conservation.
Ethical statement: authors declare that they all agree with this publication and made significant contributions; that there is no conflict of interest of any kind; and that we followed all pertinent ethical and legal procedures and requirements. All financial sources are fully and clearly stated in the acknowledgements section. A signed document has been filed in the journal archives.

